K3s 集群 Helm3 国内(外)快速部署 Operator & Prometheus
背景提要
近来通过 helm3 在 k8S/k3s 集群部署资源,国内的话阿里,网易,清华总是热衷做镜像源,因为国内外网络总是存在这样或者那样的问题,所以针对刚开始入门的小朋友,往往你的能力和别人的区别度就是你如何快速的处理类似这种网络问题就会让你更快的成长。
题外话:
网络问题:因为一些大厂可以向工信部申请开启外网联通的权力,所以类似百度/腾讯/阿里的大厂,公司的网络都是可以访问国外网络的(wiki除外),这也是大厂所谓先进技术的来源的一种动力,用百度搜索浪费时间和生命,且行且珍惜。
镜像问题:国内的一些镜像维护网站,往往都是一时兴起,不知道那个小哥想着搞一波镜像转换,但是持续赋能的维护真的是让人一言难尽,往往有以下几方面的原因,比如 helm 版本2 和版本3 发生比较大的变化,更新不及时,有些网站半途而废,本来是要解决国内外网络互通的问题的,结果做了一半没人维护了,或者国外版本大升级,人家天天更新,跟不上节奏和速度,那些好事的同学你搞这个麻烦事干嘛?
举个栗子
按照 helm3 部署教程,我们完成 helm3 部署以后,通常会设置 helm 源,但是国内源和国外源真心不一样呦!
- 国外 helm 源
# 导入国外源
helm repo remove stable
helm repo add stable https://charts.helm.sh/stable
helm repo update
helm list
helm search repo stable/prometheus-operator

- 国内 helm 源
helm repo remove stable
helm repo add stable https://kubernetes.oss-cn-hangzhou.aliyuncs.com/charts
helm repo update
helm list
helm search repo stable/prometheus-operator
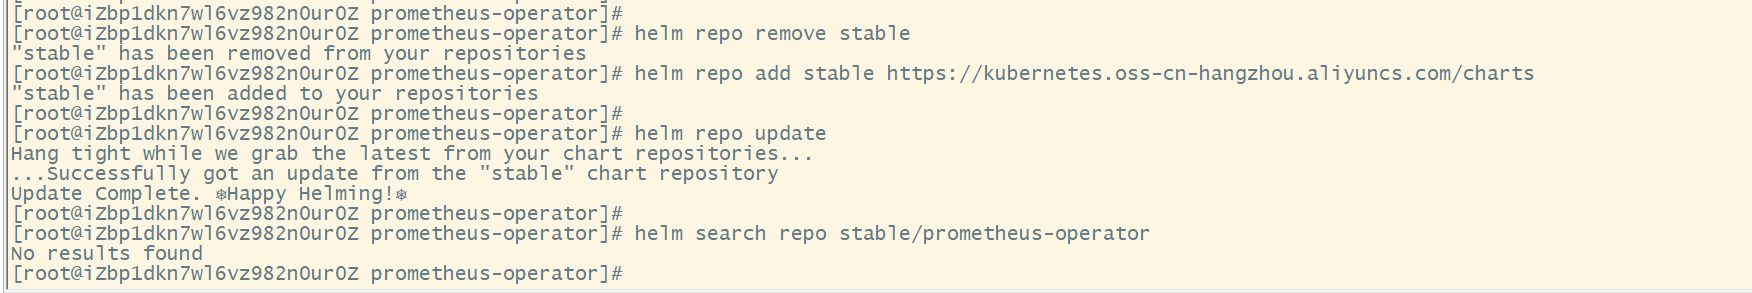
说明: 国内的源就是因为网络造成的快,国内无法正常使用国外源,可不要单独测试了,除非自己的网络区域被开放以外可访问外网,不然国外源在国内的服务器集群是无法正常使用的。
解决办法
云原生领域或者因为网络问题造成的譬如镜像,helm 源等资源文件的问题,其实存在通用的处理解决办法的,以下展开汇总诉述:
构建一个国外的 k8s/k3s 集群,或者机器环境,最好 helm ctr 等环境命令正常使用方便获取
-
购买国外机器
自己动脑子 -
配置对等环境
根据自己的环境进行展开
国外集群环境展开
- 迁移环境资源(helm3 资源为例)
# 查看是否存在可获取的 helm 资源
helm search repo stable/prometheus-operator
# 保存资源到本地
helm pull stable/prometheus-operator
# 拷贝保存的 helm 资源tgz的包到国内集群环境中来(同理镜像或者其他资源的获取方式也是一样的)

Operator & Prometheus(国内)
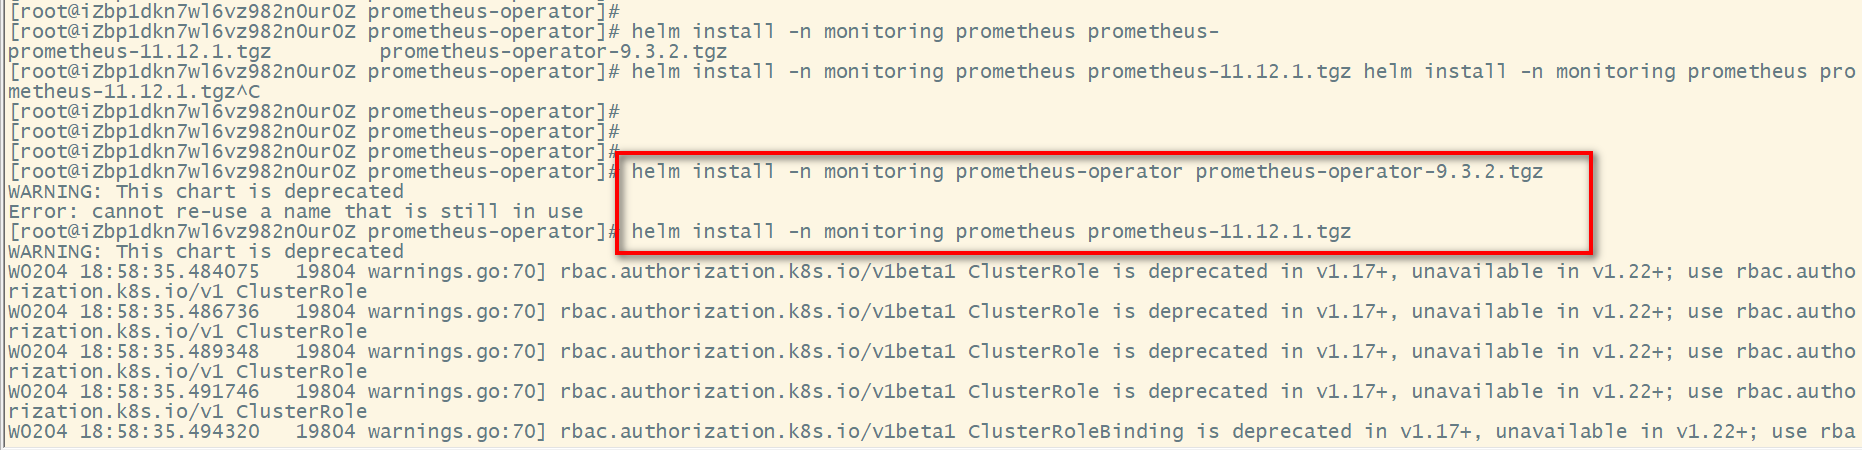
# 查看走私过来的 helm 资源
[root@iZbp1dkn7wl6vz982n0ur0Z prometheus-operator]# pwd
/home/work/helm/prometheus-operator
[root@iZbp1dkn7wl6vz982n0ur0Z prometheus-operator]# ls
prometheus-11.12.1.tgz  prometheus-operator-9.3.2.tgz

# 创建资源部署的 namespace
kubectl create ns monitoring

# 安装 prometheus-operator
helm install -n monitoring prometheus-operator prometheus-operator-9.3.2.tgz

# 安装 prometheus
helm install -n monitoring prometheus prometheus-11.12.1.tgz
服务暴露
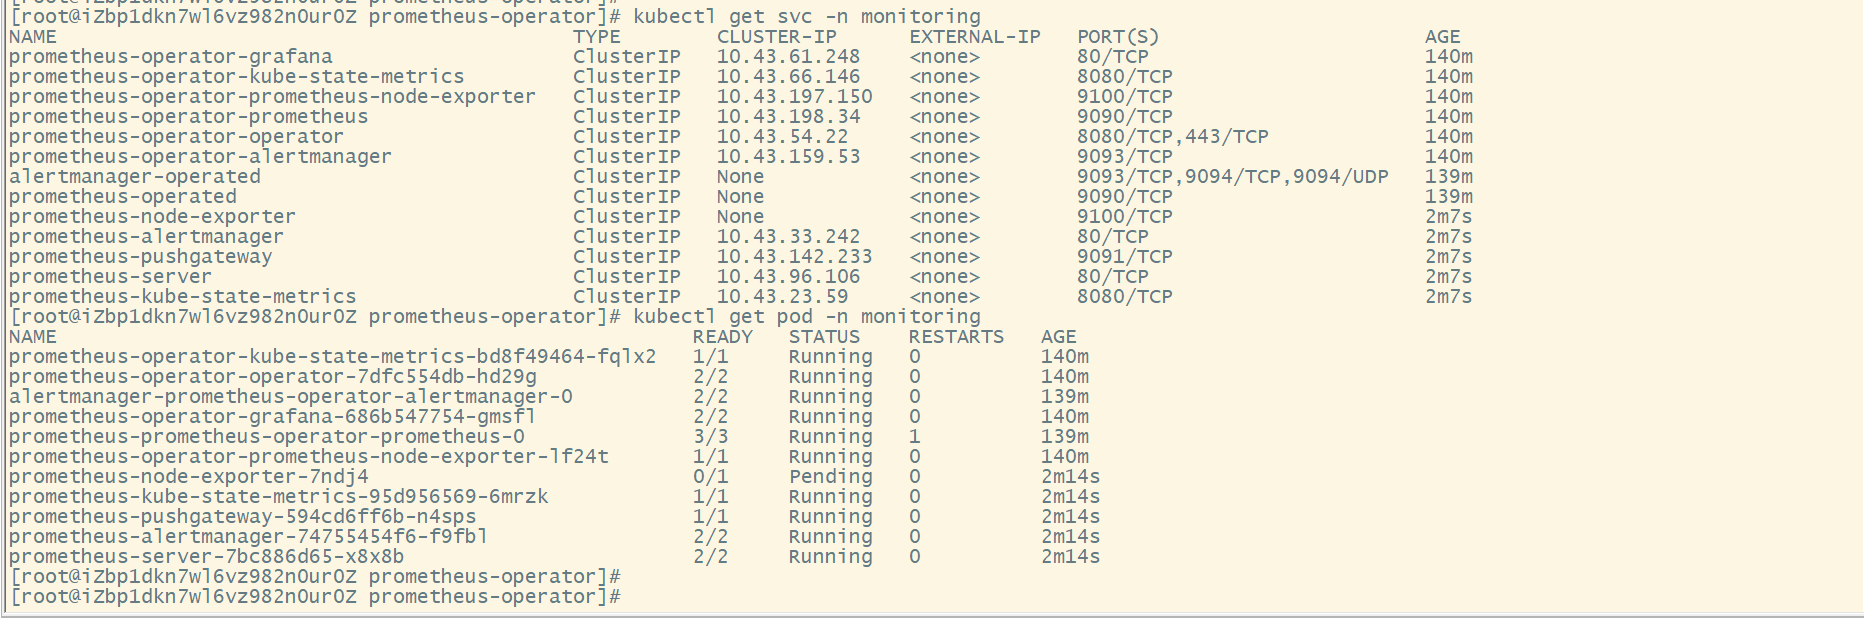
kubectl get svc -n monitoring
kubectl get pod -n monitoring
# 暴露 nodeport 端口
kubectl patch svc prometheus-operator-grafana -p '{"spec":{"type":"NodePort"}}' -n monitoring
kubectl patch svc prometheus-operator-prometheus -p '{"spec":{"type":"NodePort"}}' -n monitoring
查看访问方式:
[root@iZbp1dkn7wl6vz982n0ur0Z prometheus-operator]# kubectl get svc -n monitoring
NAME                                           TYPE        CLUSTER-IP      EXTERNAL-IP   PORT(S)                      AGE
prometheus-operator-kube-state-metrics         ClusterIP   10.43.66.146    <none>        8080/TCP                     141m
prometheus-operator-prometheus-node-exporter   ClusterIP   10.43.197.150   <none>        9100/TCP                     141m
prometheus-operator-operator                   ClusterIP   10.43.54.22     <none>        8080/TCP,443/TCP             141m
prometheus-operator-alertmanager               ClusterIP   10.43.159.53    <none>        9093/TCP                     141m
alertmanager-operated                          ClusterIP   None            <none>        9093/TCP,9094/TCP,9094/UDP   141m
prometheus-operated                            ClusterIP   None            <none>        9090/TCP                     141m
prometheus-node-exporter                       ClusterIP   None            <none>        9100/TCP                     3m42s
prometheus-alertmanager                        ClusterIP   10.43.33.242    <none>        80/TCP                       3m42s
prometheus-pushgateway                         ClusterIP   10.43.142.233   <none>        9091/TCP                     3m42s
prometheus-server                              ClusterIP   10.43.96.106    <none>        80/TCP                       3m42s
prometheus-kube-state-metrics                  ClusterIP   10.43.23.59     <none>        8080/TCP                     3m42s
prometheus-operator-grafana                    NodePort    10.43.61.248    <none>        80:30901/TCP                 141m
prometheus-operator-prometheus                 NodePort    10.43.198.34    <none>        9090:31559/TCP               141m
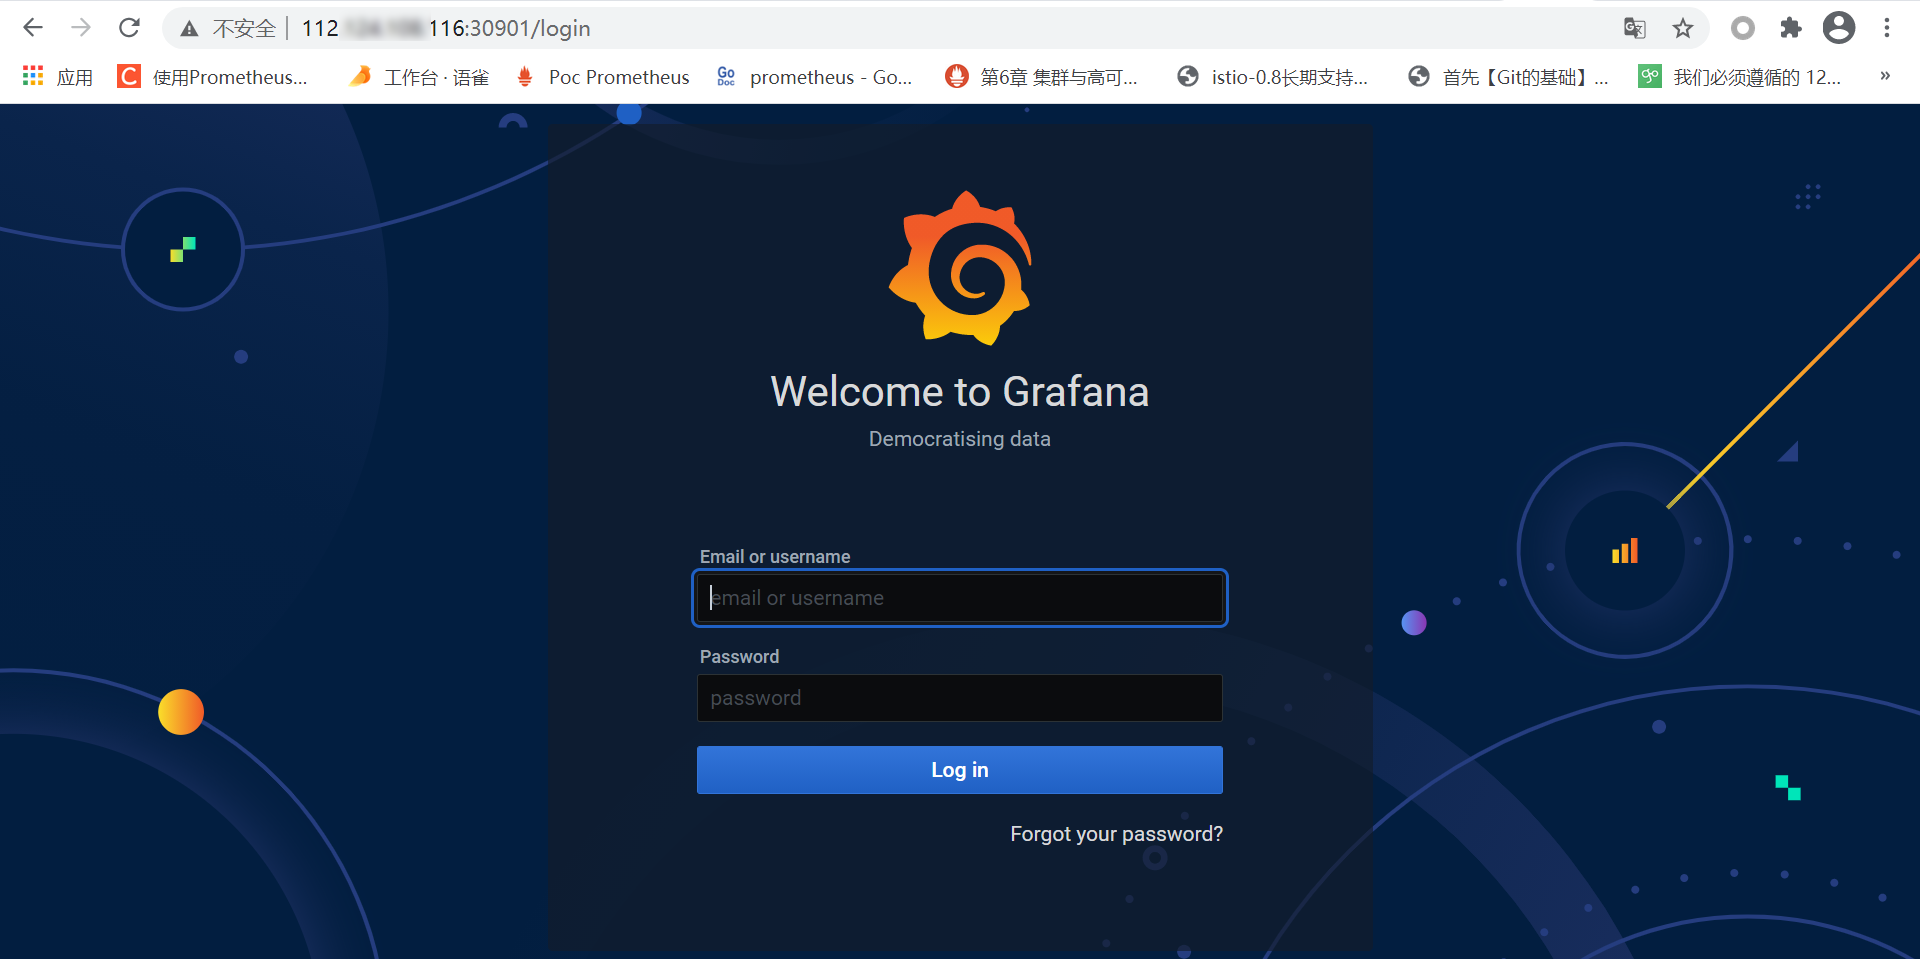
grafana 需要登录才能查看,账号密码
账号: admin
密码:
kubectl get secret --namespace monitoring  prometheus-operator-grafana -o jsonpath="{.data.admin-password}" | base64 --decode ; echo
说明:
Grafana 访问入口:http://your_vhost_ip:30901
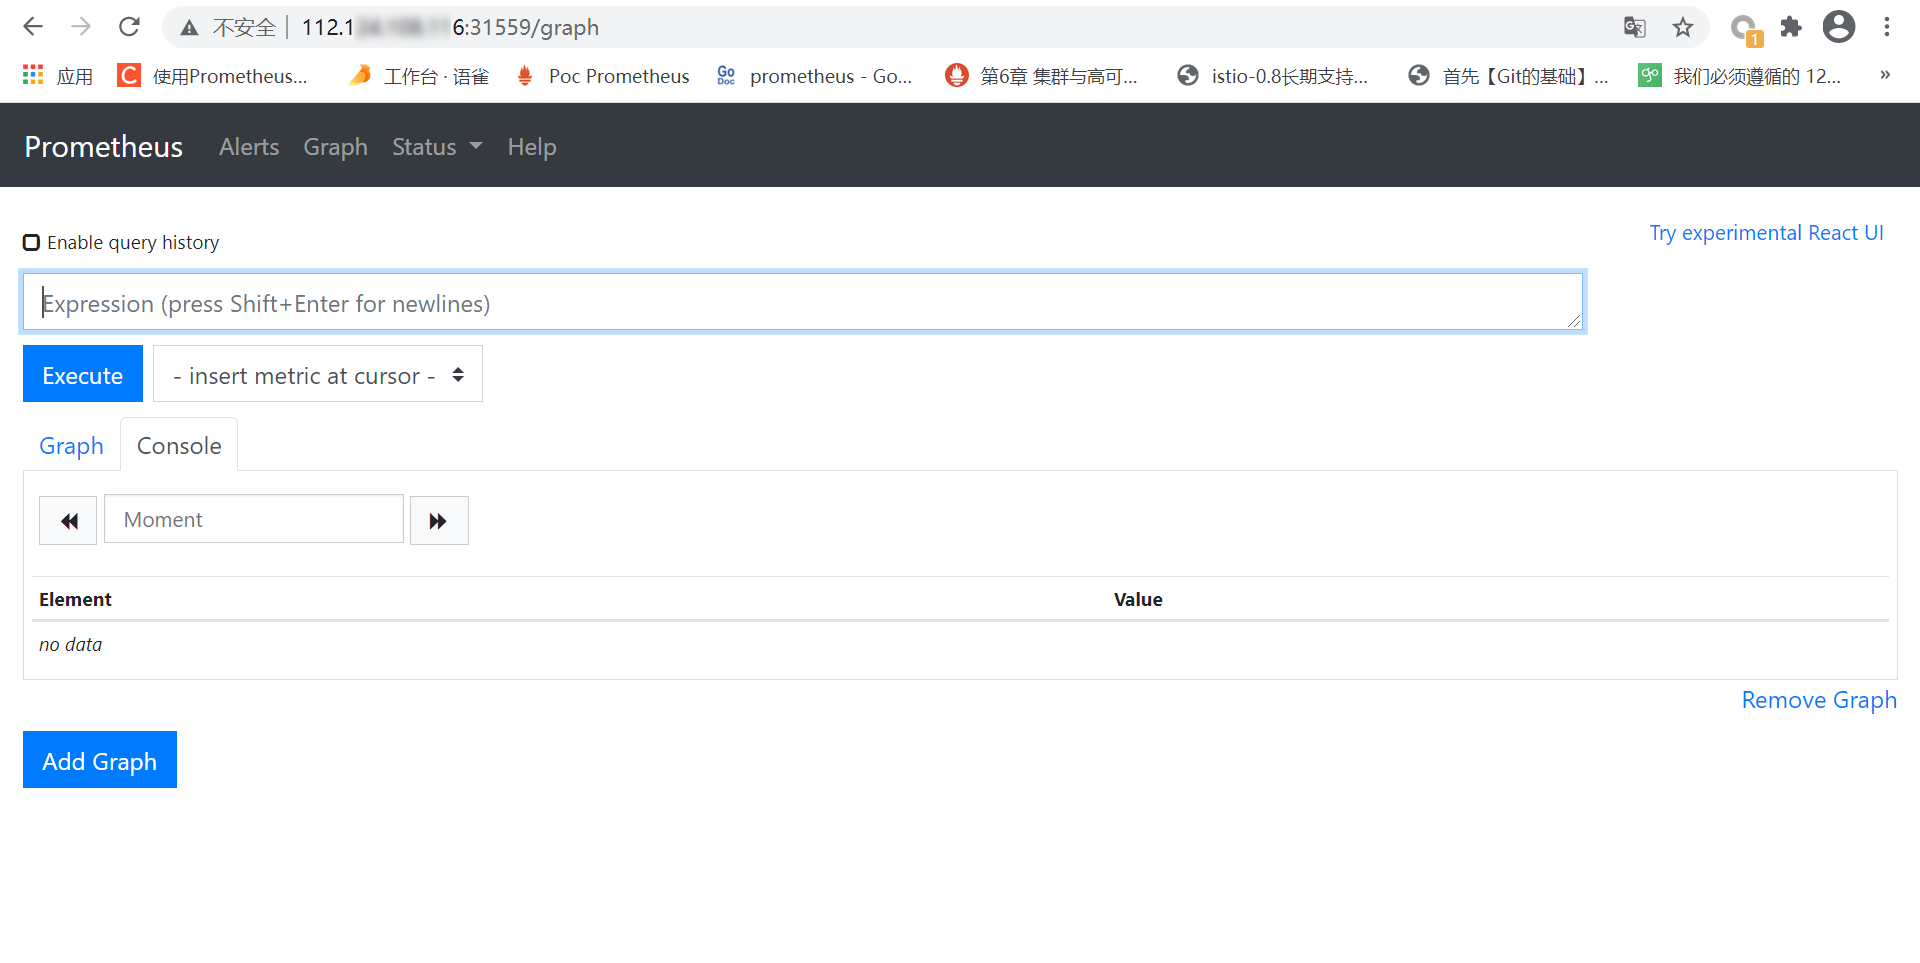
Prometheus 访问入口:http://your_vhost_ip:31559。
扩展阅读
实际上我们访问到了想要的服务,但是因为我本地端口占用冲突了,其实 node-export 没有开始采集我们期望的数据,我就不展开端口占用的问题的处理了哈!
往往我更喜欢使用 ingress 暴露类似这种 http 的应用访问服务的,为了操作便捷,我通过 nodeport 的方式进行了服务暴露,其实方式和之前的教程完全类似的,没必要重复。
国内和国外的 helm 源可以看到有很大不同,所以在处理兼容和资源获取问题上,国内的开发人员往往需要多花点心思才能达到目的呦!
