
如何实现通过Leaflet加载dwg格式的CAD图
前言
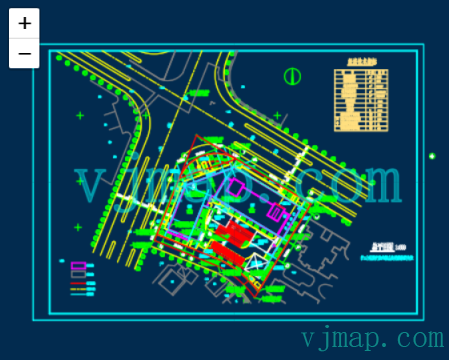
在前面介绍了通过openlayers加载dwg格式的CAD图并与互联网地图叠加,openlayers功能很全面,但同时也很庞大,入门比较难,适合于大中型项目中。而在中小型项目中,一般用开源的leaflet比较多, leaflet小而美,插件很多。本文介绍如何用Leaflet来加载DWG格式的CAD图,并在上面做应用开发,如与互联网地图叠加显示等。
Leaflet介绍
Leaflet 是领先的用于移动友好交互式地图的开源 JavaScript 库。仅仅重约 39KB 的 JS,它拥有大多数开发者所需要的所有地图功能。Leaflet 在设计时考虑到了简单性、性能和可用性。它可以在所有主要的桌面和移动平台上高效地工作,可以通过大量的插件进行扩展,拥有一个漂亮的、易于使用的、记录良好的 API,以及一个简单的、可读的源代码。。
Leaflet 官网地址 https://leafletjs.com/
Leaflet 源码地址 [https://github.com/Leaflet/
Leaflet中加载CAD栅格瓦片
在leaflet中加载CAD图,需要建立一个由cad建立的坐标系。可以由L.CRS.Simple来进行扩展,设置好坐标系的范围、分辨率及转换参数即可。
// 地图服务对象,调用唯杰地图服务打开地图,获取地图的元数据
let svc = new vjmap.Service(env.serviceUrl, env.accessToken)
// 打开地图
let mapId = "sys_zp";
let res = await svc.openMap({
    mapid: mapId, // 地图ID
    mapopenway: vjmap.MapOpenWay.GeomRender, // 以几何数据渲染方式打开
    style: vjmap.openMapDarkStyle() // div为深色背景颜色时,这里也传深色背景样式
})
if (res.error) {
    // 如果打开出错
    message.error(res.error)
}
// 获取地图范围
let mapBounds = vjmap.GeoBounds.fromString(res.bounds);

// 建立一个基于CAD图范围的坐标系
let CadCRS = L.Class.extend({
    includes: L.CRS.Simple,
    initialize: function (bounds) {
        // 当前CAD图的范围
        this.bounds = bounds;
        // 投影
        this.projection = L.Projection.LonLat;
        // 计算分辨率
        let r = (256 / Math.abs(this.bounds.getEast() - this.bounds.getWest()));
        // 设置转换参数 一个仿射变换:一组系数a, b, c, d,用于将一个形式为(x, y)的点变换为 (ax + b, cy + d)并做相反的变换
        this.transformation = new L.Transformation(r, -r * this.bounds.getWest(),  - r,  r * this.bounds.getNorth());
    }
});

// leaflet中坐标是反的,如果要用L.latLng传入坐标的时候要传[y,x],如果要传[x,y],官网建议如下方案
// https://leafletjs.com/examples/crs-simple/crs-simple.html
L.XY = function(x, y) {
    if (L.Util.isArray(x)) {    // When doing XY([x, y]);
        return L.latLng(x[1], x[0]);
    }
    return L.latLng(y, x);  // When doing XY(x, y);
};

// 当前CAD地图范围
let bounds = new L.LatLngBounds([L.XY(mapBounds.min.toArray()), L.XY(mapBounds.max.toArray())]);
let center = mapBounds.center(); // 地图中心点

// 创建leaflet的地图对象
let map = L.map('map', {
    // 坐标系
    crs: new CadCRS(bounds),
    attributionControl: false
}).setView(L.XY([center.x, center.y]), 2); // 设置初始中心点和缩放级别
// 如果要用L.latLng设置的话,x,y应写反进行设置。如
// map.setView(L.latLng([center.y, center.x]), 2);

// 增加一个栅格瓦片图层
let layer = L.tileLayer(
    svc.rasterTileUrl(),  // 唯杰地图服务提供的cad的栅格瓦片服务地址
    {
        bounds: bounds // 当前CAD地图范围
    }
).addTo(map);
// 把图层增加至地图中
layer.addTo(map);
Leaflet中选择高亮CAD实体
选择高亮的实现思路为:响应地图的点击事件,通过当前位置去后台查询当前的实体的数据。通过返回的geojson数据,在前端用leaflet的geoJSON进行绘制即可。
let highlightLayer; // 高亮图层
const highlight_ent = async co => {
    if (highlightLayer) {
        highlightLayer.remove(); // 先删除之前的高亮图层
        highlightLayer = null;
    }
    let res = await svc.pointQueryFeature({
        x: co[0],
        y: co[1],
        zoom: map.getZoom(),
        fields: ""
    }, pt => {
        // 查询到的每个点进行坐标处理回调
        return mapPrj.fromMercator(pt);// 转成cad的坐标
    })
    if (res && res.result && res.result.length > 0) {
        let features = [];
        for (let ent of res.result) {
            if (ent.geom && ent.geom.geometries) {
                let clr = vjmap.entColorToHtmlColor(ent.color);
                for (let g = 0; g < ent.geom.geometries.length; g++) {
                    features.push({
                        type: "Feature",
                        properties: {
                            objectid: ent.objectid + "_" + g,
                            color: clr,
                            alpha: ent.alpha / 255,
                            lineWidth: 1,
                            name: ent.name,
                            isline: ent.isline,
                            layerindex: ent.layerindex
                        },
                        geometry: ent.geom.geometries[g]
                    })
                }
                // 选择提示
                let content = `feature: ${ent.objectid}; layer: ${cadLayers[ent.layerindex].name}; type: ${ent.name}`
                message.info({ content, key: "info", duration: 3});
            }
        }
        let data = {
            type: "FeatureCollection",
            features: features
        }
        if (data.features.length > 0) {
            highlightLayer = L.geoJSON(data, {
                style: function (feature) {
                    const highlightColor = svc.currentMapParam().darkMode ? "#57FFC9" : "#11F";
                    return {color: highlightColor, fillColor: highlightColor}; // feature.properties.color
                }
            })
            highlightLayer.addTo(map);
        }
    }
};
Leaflet中上传打开CAD的DWG图形
// 地图服务对象,调用唯杰地图服务打开地图,获取地图的元数据
let svc = new vjmap.Service(env.serviceUrl, env.accessToken)

// 上传dwg文件
const uploadDwgFile = async file => {
    message.info("正在上传图形,请稍候", 2);
    let res = await svc.uploadMap(file); // 上传地图
    // 输入图id
    let mapid = prompt("请输入图名称ID", res.mapid);
    res.mapid = mapid;
    res.mapopenway = vjmap.MapOpenWay.GeomRender; // 几何渲染,内存渲染用vjmap.MapOpenWay.Memory
    res.isVector = false; // 使用栅格瓦片
    res.style = vjmap.openMapDarkStyle(); // 深色样式,浅色用openMapDarkStyle
    message.info("正在打开图形,请稍候,第一次打开时根据图的大小可能需要几十秒至几分钟不等", 5);
    let data = await svc.openMap(res); // 打开地图
    if (data.error) {
        message.error(data.error)
        return;
    }
    openMap(data);
}
Leaflet中切换CAD图层
实现思路为:调用后台服务切换CAD图层,获取切换的图层样式id,修改leaflet栅格图层的瓦片地址即可。
// 切换图层
const switchLayer = async layers => {
    let res = await svc.cmdSwitchLayers(layers); // 调用唯杰服务切换图层,返回图层id {layerid: "xxxx"}
    let source = layer.getSource();
    // 重新设置新的唯杰地图服务提供的cad的栅格瓦片服务地址
    source.setUrl(svc.rasterTileUrl());
    // 刷新
    source.refresh();
}
Leaflet中切换CAD图形
实现思路为:切换图层时重新新成一个新的div对象,重新new一个新的map对新的div对象相关联。
const switchToMapId = async (mapId)=> {
    let res = await svc.openMap({
        mapid: mapId, // 地图ID
        mapopenway: vjmap.MapOpenWay.GeomRender, // 以几何数据渲染方式打开
        style: vjmap.openMapDarkStyle() // div为深色背景颜色时,这里也传深色背景样式
    })
    if (res.error) {
        // 如果打开出错
        message.error(res.error)
        return;
    }
    // 获取地图范围
    let mapBounds = vjmap.GeoBounds.fromString(res.bounds);
    let mapPrj = new vjmap.GeoProjection(mapBounds);

    // 建立一个基于CAD图范围的坐标系
    let CadCRS = L.Class.extend({
        includes: L.CRS.Simple,
        initialize: function (bounds) {
            // 当前CAD图的范围
            this.bounds = bounds;
            // 投影
            this.projection = L.Projection.LonLat;
            // 计算分辨率
            let r = (256 / Math.abs(this.bounds.getEast() - this.bounds.getWest()));
            // 设置转换参数 一个仿射变换:一组系数a, b, c, d,用于将一个形式为(x, y)的点变换为 (ax + b, cy + d)并做相反的变换
            this.transformation = new L.Transformation(r, -r * this.bounds.getWest(), -r, r * this.bounds.getNorth());
        }
    });


    // 当前CAD地图范围
    let bounds = new L.LatLngBounds([L.XY(mapBounds.min.toArray()), L.XY(mapBounds.max.toArray())]);
    let center = mapBounds.center(); // 地图中心点

    // 创建leaflet的地图对象
    map = L.map(createNewMapDivId(), {
        // 坐标系
        crs: new CadCRS(bounds),
        attributionControl: false
    }).setView(L.XY([center.x, center.y]), 2); // 设置初始中心点和缩放级别
    // 如果要用L.latLng设置的话,x,y应写反进行设置。如
    // map.setView(L.latLng([center.y, center.x]), 2);

    // 增加一个栅格瓦片图层
    let layer = L.tileLayer(
        svc.rasterTileUrl(),  // 唯杰地图服务提供的cad的栅格瓦片服务地址
        {
            bounds: bounds // 当前CAD地图范围
        }
    ).addTo(map);
    // 把图层增加至地图中
    layer.addTo(map);

    map.on('click', (e) => message.info({content: `您点击的坐标为: ${e.latlng.lng}, ${e.latlng.lat}}`, key: "info", duration: 3}));
}
Leaflet中深色浅色切换主题
实现思路为:通过修改后台样式,通过返回的样式名,修改leaflet栅格图层的瓦片地址即可。
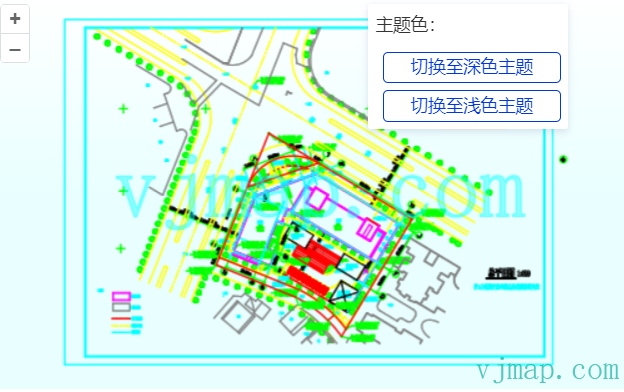
let curIsDarkTheme = true;
const switchToDarkTheme = async () => {
    if (curIsDarkTheme) return;
    curIsDarkTheme = true;
    document.body.style.background = "#022B4F"; // 背景色改为深色
    await updateStyle(curIsDarkTheme)
}

const switchToLightTheme = async () => {
    if (!curIsDarkTheme) return;
    curIsDarkTheme = false;
    document.body.style.backgroundImage = "linear-gradient(rgba(255, 255, 255, 1), rgba(233,255,255, 1), rgba(233,255,255, 1))"
    await updateStyle(curIsDarkTheme)
}

const updateStyle = async (isDarkTheme) => {
    style.backcolor = isDarkTheme ? 0 : 0xFFFFFF;//深色为黑色,浅色为白色
    let res = await svc.cmdUpdateStyle(style);
    layer.setUrl(svc.rasterTileUrl()) // 唯杰地图服务提供的cad的栅格瓦片服务地址
}
Leaflet中自定义CAD地图样式
通过修改CAD地图后台样式数据自定义地图。
// 更改样式
const expressionList = [] ;// 表达式数组
const updateStyle = async (style) => {
    let res = await svc.cmdUpdateStyle({
        name: "customStyle2",
        backcolor: 0,
        expression: expressionList.join("\n"),
        ...style
    });
    layer.setUrl(svc.rasterTileUrl());  // 唯杰地图服务提供的cad的栅格瓦片服务地址
}

// 表达式语法和变量请参考
// 服务端条件查询和表达式查询 https://vjmap.com/guide/svrStyleVar.html
// 服务端渲染表达式语法 https://vjmap.com/guide/expr.html

// 修改颜色  红color.r, 绿color.g, 蓝color.b, 透明度color.a,如果输入了级别的话,表示此级别及以上的设置
const modifyColor = (color, zoom) => {
    let result = "";
    let z = Number.isInteger(zoom) ? `[${zoom + 1}]` : '';
    if ("r" in color) result += `gOutColorRed${z}:=${color.r};`;
    if ("g" in color) result += `gOutColorGreen${z}:=${color.g};`;
    if ("b" in color) result += `gOutColorBlue${z}:=${color.b};`;
    if ("a" in color) result += `gOutColorAlpha${z}:=${color.a};`;
    return result;
}
Leaflet中对CAD图处理组合
对多个cad图进行图层开关裁剪旋转缩放处理后合并成一个新的cad图
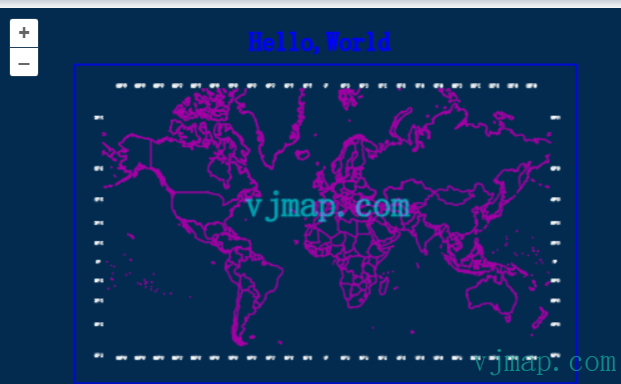
// 组合成新的图,将sys_world图进行一定的处理后,再与sys_hello进行合成,生成新的地图文件名
let rsp = await svc.composeNewMap([
    {
        mapid: "sys_world", // 地图id
        // 下面的参数可以根据实际需要来设置,可以对图层,范围,坐标转换来进行处理
        layers: ["经纬度标注","COUNTRY"], // 要显示的图层名称列表
        //clipbounds: [10201.981489534268, 9040.030491346213, 26501.267379,  4445.465999], // 要显示的范围
        //fourParameter: [0,0,1,0] // 对地图进行四参数转换计算
    },
    {
        mapid: "sys_hello"
    }
])
if (!rsp.status) {
    message.error(rsp.error)
}
// 返回结果为
/*
{
    "fileid": "pec9c5f73f1d",
    "mapdependencies": "sys_world||sys_hello",
    "mapfrom": "sys_world&&v1&&&&0&&&&&&&&&&00A0&&10||sys_hello&&v1&&&&0&&&&&&&&&&&&2",
    "status": true
}
 */
Leaflet中查询图中所有文字并绘制边框
实现思路为:通过条件查询去后台获取所有文字的属性数据和geojson数据,在前端通过leaflet的geojson图层绘制每个文字的边框。
let highlightLayer; // 高亮图层
const queryTextAndDrawBounds = async () => {
    if (highlightLayer) {
        highlightLayer.remove(); // 先删除之前的高亮图层
        highlightLayer = null;
    }
    let queryTextEntTypeId = getTypeNameById("AcDbText"); // 单行文字
    let queryMTextEntTypeId = getTypeNameById("AcDbMText"); // 多行文字
    let queryAttDefEntTypeId = getTypeNameById("AcDbAttributeDefinition"); // 属性定义文字
    let queryAttEntTypeId = getTypeNameById("AcDbAttribute"); // 属性文字
    let query = await svc.conditionQueryFeature({
        condition: `name='${queryTextEntTypeId}' or name='${queryMTextEntTypeId}' or name='${queryAttDefEntTypeId}' or name='${queryAttEntTypeId}'`, // 只需要写sql语句where后面的条件内容,字段内容请参考文档"服务端条件查询和表达式查询"
        fields: "",
        limit: 100000 //设置很大,相当于把所有的圆都查出来。不传的话,默认只能取100条
    }, pt => {
        // 查询到的每个点进行坐标处理回调
        return mapPrj.fromMercator(pt);// 转成cad的坐标
    })
    if (query.error) {
        message.error(query.error)
    } else {
        message.info(`查询到符合的记数条数:${query.recordCount}`)

        if (query.recordCount > 0) {
            let features = [];
            for(var i = 0; i < query.recordCount; i++) {
                let bounds = vjmap.getEnvelopBounds(query.result[i].envelop, mapPrj);
                let clr = vjmap.entColorToHtmlColor(query.result[i].color); // 实体颜色转html颜色(

                features.push({
                    type: "Feature",
                    properties: {
                        name: "objectid:" + query.result[i].objectid,
                        color: clr
                    },
                    geometry: {
                        'type': 'Polygon',
                        'coordinates': [
                            bounds.toPointArray(),
                        ],
                    }
                })
            }


            let data = {
                type: "FeatureCollection",
                features: features
            }
            if (data.features.length > 0) {
                highlightLayer = L.geoJSON(data, {
                    style: function (feature) {
                        return {color: "#FF6EA0", fillColor: "#FF6EA0", fillOpacity: 0.4}; // feature.properties.color
                    }
                })
                highlightLayer.addTo(map);
            }
        }
    }
}
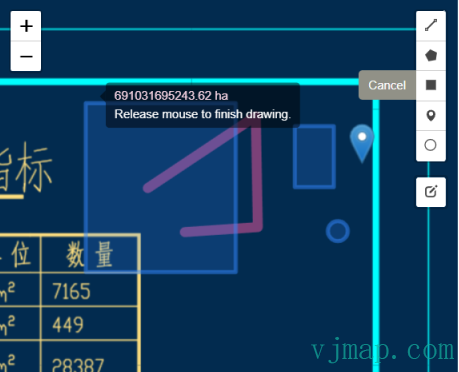
Leaflet中图形绘制
实现思路为:利用leaflet提供的图形绘制插件https://github.com/Leaflet/Leaflet.draw进行图形绘制。
var editableLayers = new L.FeatureGroup();
map.addLayer(editableLayers);

var MyCustomMarker = L.Icon.extend({
    options: {
        shadowUrl: null,
        iconAnchor: new L.Point(12, 41),
        iconSize: new L.Point(25, 41),
        iconUrl: './js/leaflet2.0/plugins/images/marker-icon.png'
    }
});

var options = {
    position: 'topright',
    draw: {
        polyline: {
            shapeOptions: {
                color: '#f357a1',
                weight: 10
            }
        },
        polygon: {
            allowIntersection: false, // Restricts shapes to simple polygons
            drawError: {
                color: '#e1e100', // Color the shape will turn when intersects
                message: '<strong>Oh snap!<strong> you can\'t draw that!' // Message that will show when intersect
            },
            shapeOptions: {
                color: '#bada55'
            }
        },
        circle: false, // Turns off this drawing tool
        rectangle: {
            shapeOptions: {
                clickable: false
            }
        },
        marker: {
            icon: new MyCustomMarker()
        }
    },
    edit: {
        featureGroup: editableLayers, //REQUIRED!!
        remove: false
    }
};

var drawControl = new L.Control.Draw(options);
map.addControl(drawControl);

map.on(L.Draw.Event.CREATED, function (e) {
    var type = e.layerType,
        layer = e.layer;

    if (type === 'marker') {
        layer.bindPopup('A popup!');
    }

    editableLayers.addLayer(layer);
});
Leaflet中CAD图叠加互联网地图[CAD为底图]
// 增加高德地图底图
let gdlayer;
const addGaodeMap = async (isRoadway) => {
    const tileUrl = svc.webMapUrl({
        tileCrs: "gcj02",
        tileUrl:  isRoadway ? [
                "https://webrd0{s}.is.autonavi.com/appmaptile?lang=zh_cn&size=1&scale=1&style=8&x={x}&y={y}&z={z}"
            ] :
            /* 如果用影像 */
            [
                "https://webst0{s}.is.autonavi.com/appmaptile?lang=zh_cn&size=1&scale=1&style=6&x={x}&y={y}&z={z}",
                "https://webst0{s}.is.autonavi.com/appmaptile?lang=zh_cn&size=1&scale=1&style=8&x={x}&y={y}&z={z}"
            ],
        tileSize: 256,
        tileRetina: 1,
        tileMaxZoom: 18,
        tileShards: "1,2,3,4",
        tileToken: "",
        tileFlipY: false,
        mapbounds: res.bounds,
        srs: "EPSG:4527",// 可通过前两位获取 vjmap.transform.getEpsgParam(vjmap.transform.EpsgCrsTypes.CGCS2000, 39).epsg
        // 因为sys_cad2000这个图只有6位,没有带系。需要在坐标转换前平移下带系  https://blog.csdn.net/thinkpang/article/details/124172626
        fourParameterBefore: "39000000,0,1,0"
    })

    gdlayer = L.tileLayer(
        tileUrl,
        {
            zIndex: 0
        }
    );
    gdlayer.addTo(map);


    // cad坐标与高德坐标相互转换示例
    let webCo = await cad2webCoordinate(center, false); // cad转高德
    let cadCo = await web2cadCoordinate(webCo, false); // 高德转cad
    console.log(center, webCo, cadCo)
}
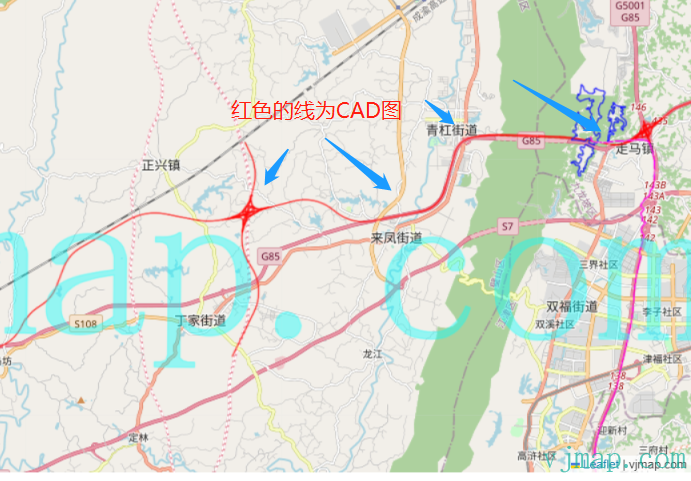
Leaflet中互联网地图自动叠加CAD图[互联网图为底图]
let cadEpsg = "EPSG:4544";// cad图的espg代号
// 增加cad的wms图层
let wmsUrl = svc.wmsTileUrl({
    mapid: mapId, // 地图id
    layers: layer, // 图层名称
    bbox: '', // bbox这里不需要
    srs: "EPSG:3857", //
    crs: cadEpsg,
})

let mapBounds = vjmap.GeoBounds.fromString(res.bounds);
// cad图坐标转web wgs84坐标
const cadToWebCoordinate = async point => {
    let co = await svc.cmdTransform(cadEpsg, "EPSG:4326", point);
    return co[0]
}

// 增加wms图层
let wmsLayer = L.tileLayer.wms(wmsUrl, {
    attribution: "vjmap.com"
});
wmsLayer.addTo(map);
Leaflet中互联网地图公共点叠加CAD图[互联网图为底图]
// cad上面的点坐标
let cadPoints = [
    vjmap.geoPoint([587464448.8435847, 3104003685.208651,]),
    vjmap.geoPoint([587761927.7224838, 3104005967.655292]),
    vjmap.geoPoint([587463688.0280377, 3103796743.3798513]),
    vjmap.geoPoint([587760406.0913897, 3103793700.1176634])
];


// 在互联网图上面拾取的与上面的点一一对应的坐标(wgs84坐标)
let webPoints = [
    vjmap.geoPoint([116.48476281710168, 39.96200739703454]),
    vjmap.geoPoint([116.48746772021137, 39.96022062215167]),
    vjmap.geoPoint([116.48585059441585, 39.9588451134361]),
    vjmap.geoPoint([116.48317418949145, 39.960515760972356])
]


// 通过坐标参数求出四参数
let epsg3857Points = webPoints.map(w => vjmap.geoPoint(vjmap.Projection.lngLat2Mercator(w)));
let param = vjmap.coordTransfromGetFourParamter(epsg3857Points, cadPoints , false); // 这里考虑旋转
let fourparam = [param.dx, param.dy, param.scale, param.rotate]

// wms图层地址
const getCadWmsUrl = (transparent) => {
    let wmsUrl = svc.wmsTileUrl({
        mapid: mapId, // 地图id
        layers: layer, // 图层名称
        bbox: '', // bbox这里不需要
        fourParameter: fourparam,
        transparent: transparent,
        backgroundColor: 'rgba(240, 255, 255)' // 不透明时有效
    })
    return wmsUrl
}


let mapBounds = vjmap.GeoBounds.fromString(res.bounds);
let cadPrj = new vjmap.GeoProjection(mapBounds);


// cad图坐标转wgs84坐标
const cadToWebCoordinate = point => {
    // 再调用四参数反算求出web的坐标
    let mkt = vjmap.coordTransfromByInvFourParamter(vjmap.geoPoint(point), param);
    return vjmap.Projection.mercator2LngLat(mkt);
}
// wgs84转cad图坐标
const webToCadCoordinate = point => {
    let mkt = vjmap.Projection.lngLat2Mercator(vjmap.geoPoint(point));
    return vjmap.coordTransfromByFourParamter(mkt, param)
}
let VisibleBounds = mapBounds.scale(0.4);
let pt1 =  cadToWebCoordinate([VisibleBounds.min.x, VisibleBounds.min.y])
let pt2 =  cadToWebCoordinate([VisibleBounds.min.x, VisibleBounds.max.y])
let pt3 =  cadToWebCoordinate([VisibleBounds.max.x, VisibleBounds.max.y])
let pt4 =  cadToWebCoordinate([VisibleBounds.max.x, VisibleBounds.min.y])
// 计算出cad的范围
let bounds = vjmap.GeoBounds.fromDataExtent([pt1, pt2, pt3, pt4])


let wmsLayer;
const addWmsLayer = async (transparent)=> {
    removeWmsLayer();
    let wmsUrl = getCadWmsUrl(transparent);
    wmsLayer = L.tileLayer.wms(wmsUrl, {
        attribution: "vjmap.com"
    });
    wmsLayer.addTo(map);
}

const removeWmsLayer = ()=> {
    if (!wmsLayer) return;
    wmsLayer.remove();
    wmsLayer = null;
}
最后
可点击 https://vjmap.com/demo/#/demo/map/leaflet/01leafletraster 在线体验上面功能
如果需要用leaflet来加载CAD图进行开发,请参考示例 https://vjmap.com/demo/#/demo/map/leaflet/01leafletraster
如果需要用openlayers来加载CAD图进行开发,请参考示例 https://vjmap.com/demo/#/demo/map/openlayers/01olraster
如果需要用maptalks来加载CAD图进行开发,请参考示例 https://vjmap.com/demo/#/demo/map/maptalks/01maptalksraster
如何基于vue3来开发Leaflet应用,可查看此开源代码 https://github.com/vue-leaflet/vue-leaflet
如何基于vue2来开发Leaflet应用,可查看此开源代码 https://github.com/vue-leaflet/Vue2Leaflet

 浙公网安备 33010602011771号