

matplotlib 详解
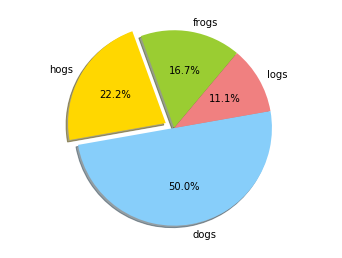
import matplotlib.pyplot as plt
labels='frogs','hogs','dogs','logs'
sizes=15,20,45,10
colors='yellowgreen','gold','lightskyblue','lightcoral'
explode=0,0.1,0,0
plt.pie(sizes,explode=explode,labels=labels,colors=colors,autopct='%1.1f%%',shadow=True,startangle=50)
plt.axis('equal') #保证是正圆
plt.show()
matplotlib图标正常显示中文
为了在图表中能够显示中文和负号等,需要下面一段设置:
具体请看:
https://www.cnblogs.com/zhizhan/p/5615947.html
posted on 2018-06-25 16:45 vivianzy1985 阅读(139) 评论(0) 编辑 收藏 举报

