using System;
using System.Collections.Generic;
using System.Linq;
using System.Web;
using System.Data;
using System.Web.UI;
using System.Web.UI.WebControls;
using Microsoft.Office.Core;
using Microsoft.Office.Interop.Owc11;
using Microsoft.Office.Interop;
using System.Web.UI.DataVisualization.Charting;
namespace BeautyCode.SharePoint.MVPDemo.Pages
{
public partial class Chart : System.Web.UI.Page
{
private DataTable _SampleDataTable;
private DataTable _InSchool;
protected void Page_Load(object sender, EventArgs e)
{
if (!IsPostBack)
{
PaintChart1();
PaintChart2();
}
}
private void CreateDataTable()
{
_SampleDataTable = new DataTable();
_SampleDataTable.Columns.Add("jx");
_SampleDataTable.Columns.Add("count");
DataRow row;
row = _SampleDataTable.NewRow();
row[0] = "上将";
row[1] = 100;
_SampleDataTable.Rows.Add(row);
row = _SampleDataTable.NewRow();
row[0] = "准将";
row[1] = 400;
_SampleDataTable.Rows.Add(row);
row = _SampleDataTable.NewRow();
row[0] = "大校";
row[1] = 1000;
_SampleDataTable.Rows.Add(row);
row = _SampleDataTable.NewRow();
row[0] = "上校";
row[1] = 800;
_SampleDataTable.Rows.Add(row);
row = _SampleDataTable.NewRow();
row[0] = "上尉";
row[1] = 600;
_SampleDataTable.Rows.Add(row);
}
private void PaintChart1()
{
CreateDataTable();
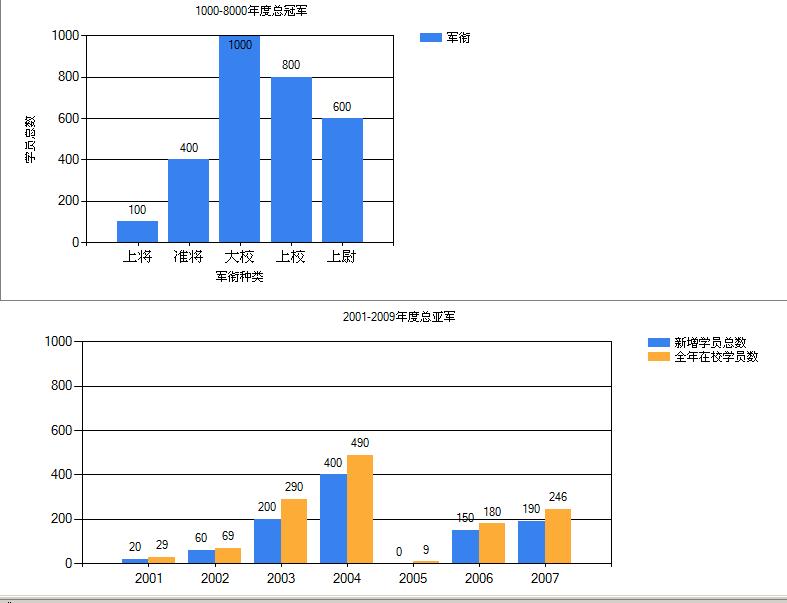
this.Chart1.Titles["Title"].Text = "1000-8000年度总冠军";
this.Chart1.Series.Add(new Series("军衔"));
this.Chart1.Width = 500;
#region MSChart manual add data
//this.Chart1.Series["军衔"].Points.AddXY("上将", 20);
//this.Chart1.Series["军衔"].Points.AddXY("中将", 200);
//this.Chart1.Series["军衔"].Points.AddXY("准将", 40);
//this.Chart1.Series["军衔"].Points.AddXY("中校", 60);
//this.Chart1.Series["军衔"].Points.AddXY("少校", 100);
//this.Chart1.Series["军衔"].Points.AddXY("上尉", 48);
#endregion
#region MSChart DataSource Array
//int xy = _SampleDataTable.Rows.Count;
//List<string> jx = new List<string>();
//List<int> count = new List<int>();
//DataRowCollection rows = _SampleDataTable.Rows;
//foreach (DataRow row in rows)
//{
// jx.Add(row["jx"].ToString());
// count.Add(int.Parse(row["count"].ToString()));
//}
//this.Chart1.Series["军衔"].Points.DataBindXY(jx,count );
#endregion
#region MSChart DataSource DataTable
this.Chart1.DataSource = _SampleDataTable;
this.Chart1.Series["军衔"].XValueMember = "jx";
this.Chart1.Series["军衔"].XValueType = ChartValueType.String;
this.Chart1.Series["军衔"].XAxisType = AxisType.Primary;
this.Chart1.Series["军衔"].YValueMembers = "count";
this.Chart1.Series["军衔"].YValueType = ChartValueType.Int32;
this.Chart1.Series["军衔"].YAxisType = AxisType.Primary;
#endregion
#region
this.Chart1.Series["军衔"].ChartType = SeriesChartType.Column;
this.Chart1.Series["军衔"].BorderWidth = 1;
this.Chart1.Series["军衔"].IsVisibleInLegend = true;
this.Chart1.Series["军衔"].IsValueShownAsLabel = true;
#endregion
#region
this.Chart1.ChartAreas["ChartAreas1"].AxisX.Title = "军衔种类";
this.Chart1.ChartAreas["ChartAreas1"].AxisY.Interval = 200;
this.Chart1.ChartAreas["ChartAreas1"].AxisY.Title = "学员总数";
this.Chart1.ChartAreas["ChartAreas1"].AxisY.Maximum = 1000;
this.Chart1.ChartAreas["ChartAreas1"].BorderDashStyle = ChartDashStyle.Solid;
this.Chart1.ChartAreas["ChartAreas1"].BorderWidth = 1;
this.Chart1.ChartAreas["ChartAreas1"].AxisX.MajorGrid.LineWidth = 0;
#endregion
}
private void CreateInSchool()
{
_InSchool = new DataTable();
_InSchool.Columns.Add("year");
_InSchool.Columns.Add("allyear");
_InSchool.Columns.Add("new");
_InSchool.Rows.Add("2001", 20, 29);
_InSchool.Rows.Add("2002", 60, 69);
_InSchool.Rows.Add("2003", 200, 290);
_InSchool.Rows.Add("2004", 400, 490);
_InSchool.Rows.Add("2005", 0, 9);
_InSchool.Rows.Add("2006", 150, 180);
_InSchool.Rows.Add("2007", 190, 246);
}
private void PaintChart2()
{
CreateInSchool();
this.Chart2.Titles.Add("2001-2009年度总亚军");
this.Chart2.Width = 800;
this.Chart2.Series.Add(new Series("新增学员总数"));
this.Chart2.Series["新增学员总数"].ChartType = SeriesChartType.Column;
this.Chart2.Series["新增学员总数"].BorderWidth = 1;
this.Chart2.Series["新增学员总数"].IsVisibleInLegend = true;
this.Chart2.Series["新增学员总数"].IsValueShownAsLabel = true;
#region
this.Chart2.Series["新增学员总数"].ChartType = SeriesChartType.Column;
this.Chart2.Series["新增学员总数"].BorderWidth = 1;
this.Chart2.Series["新增学员总数"].IsVisibleInLegend = true;
this.Chart2.Series["新增学员总数"].IsValueShownAsLabel = true;
this.Chart2.Series["新增学员总数"].ChartArea = "ChartAreas1";
#endregion
#region
this.Chart2.ChartAreas["ChartAreas1"].AxisY.Interval = 200;
this.Chart2.ChartAreas["ChartAreas1"].AxisY.Maximum = 1000;
this.Chart2.ChartAreas["ChartAreas1"].BorderDashStyle = ChartDashStyle.Solid;
this.Chart2.ChartAreas["ChartAreas1"].BorderWidth = 1;
this.Chart2.ChartAreas["ChartAreas1"].AxisX.MajorGrid.LineWidth = 0;
#endregion
this.Chart2.Series.Add(new Series("全年在校学员数"));
this.Chart2.Series["全年在校学员数"].ChartType = SeriesChartType.Column;
this.Chart2.Series["全年在校学员数"].BorderWidth = 1;
this.Chart2.Series["全年在校学员数"].IsVisibleInLegend = true;
this.Chart2.Series["全年在校学员数"].IsValueShownAsLabel = true;
#region
this.Chart2.Series["全年在校学员数"].ChartType = SeriesChartType.Column;
this.Chart2.Series["全年在校学员数"].BorderWidth = 1;
this.Chart2.Series["全年在校学员数"].IsVisibleInLegend = true;
this.Chart2.Series["全年在校学员数"].IsValueShownAsLabel = true;
this.Chart2.Series["全年在校学员数"].ChartArea = "ChartAreas1";
#endregion
#region
this.Chart2.ChartAreas["ChartAreas1"].AxisY.Interval = 200;
this.Chart2.ChartAreas["ChartAreas1"].AxisY.Maximum = 1000;
this.Chart2.ChartAreas["ChartAreas1"].BorderDashStyle = ChartDashStyle.Solid;
this.Chart2.ChartAreas["ChartAreas1"].BorderWidth = 1;
this.Chart2.ChartAreas["ChartAreas1"].AxisX.MajorGrid.LineWidth = 0;
#endregion
this.Chart2.DataSource = _InSchool;
this.Chart2.Series["新增学员总数"].XValueMember = "year";
this.Chart2.Series["新增学员总数"].XValueType = ChartValueType.Int32;
this.Chart2.Series["新增学员总数"].XAxisType = AxisType.Primary;
this.Chart2.Series["新增学员总数"].YValueMembers = "allyear";
this.Chart2.Series["新增学员总数"].YValueType = ChartValueType.Int32;
this.Chart2.Series["新增学员总数"].YAxisType = AxisType.Primary;
this.Chart2.Series["全年在校学员数"].XValueMember = "year";
this.Chart2.Series["全年在校学员数"].XValueType = ChartValueType.Int32;
this.Chart2.Series["全年在校学员数"].XAxisType = AxisType.Primary;
this.Chart2.Series["全年在校学员数"].YValueMembers = "new";
this.Chart2.Series["全年在校学员数"].YValueType = ChartValueType.Int32;
this.Chart2.Series["全年在校学员数"].YAxisType = AxisType.Primary;
}
}
}

 页面代码
页面代码


【推荐】国内首个AI IDE,深度理解中文开发场景,立即下载体验Trae
【推荐】编程新体验,更懂你的AI,立即体验豆包MarsCode编程助手
【推荐】抖音旗下AI助手豆包,你的智能百科全书,全免费不限次数
【推荐】轻量又高性能的 SSH 工具 IShell:AI 加持,快人一步
· .NET Core 中如何实现缓存的预热?
· 从 HTTP 原因短语缺失研究 HTTP/2 和 HTTP/3 的设计差异
· AI与.NET技术实操系列:向量存储与相似性搜索在 .NET 中的实现
· 基于Microsoft.Extensions.AI核心库实现RAG应用
· Linux系列:如何用heaptrack跟踪.NET程序的非托管内存泄露
· TypeScript + Deepseek 打造卜卦网站:技术与玄学的结合
· 阿里巴巴 QwQ-32B真的超越了 DeepSeek R-1吗?
· 【译】Visual Studio 中新的强大生产力特性
· 10年+ .NET Coder 心语 ── 封装的思维:从隐藏、稳定开始理解其本质意义
· 【设计模式】告别冗长if-else语句:使用策略模式优化代码结构