
shell脚本实现ElasticSearch的QPS统计和实时监控
ElasticSearch默认输出INFO级别的日志到日志文件中,但是一次成功的http请求是TRACE级别,要想记录所有的HTTP请求需要在elasticsearch.yml文件中添加logger.org.elasticsearch.http: TRACE配置。
日志文件中的记录形式如图所示:
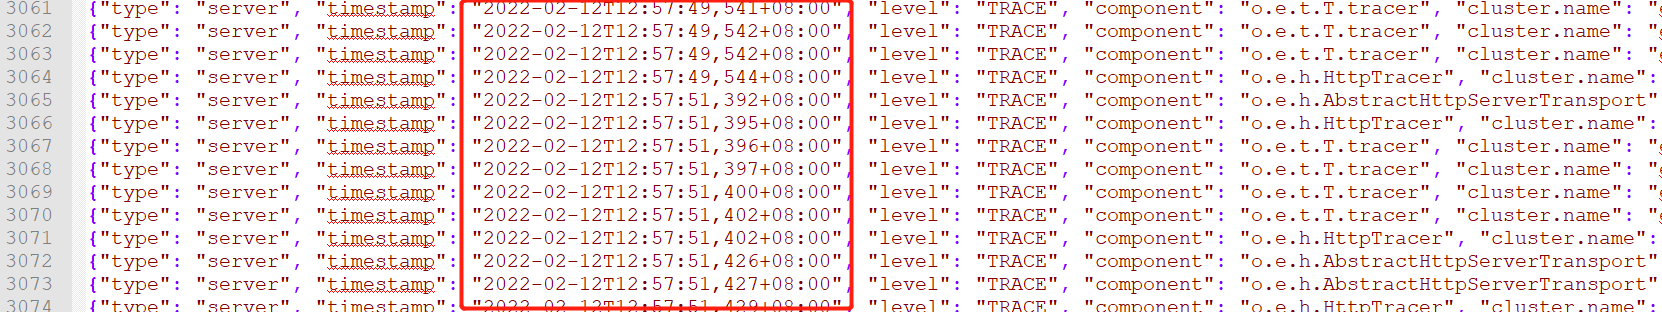
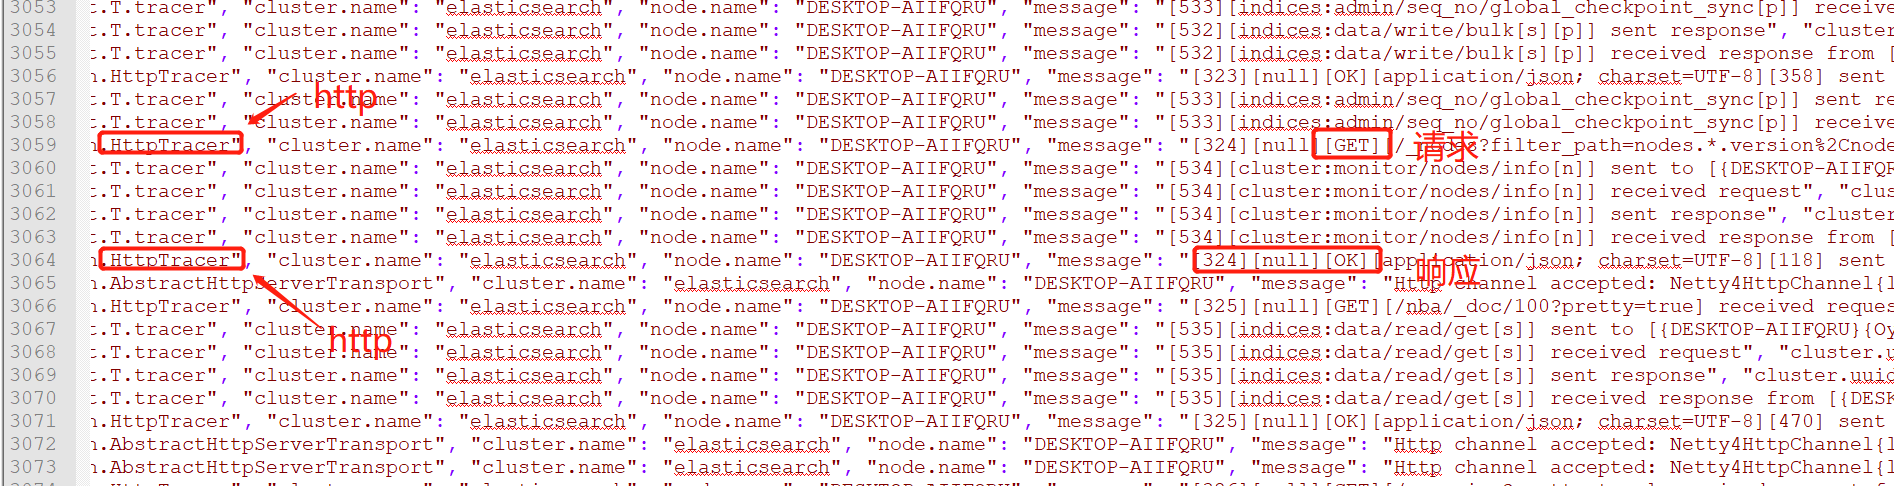
每条记录有时间戳,日志级别,是否为http。如果为http请求,则还有请求的http方法。
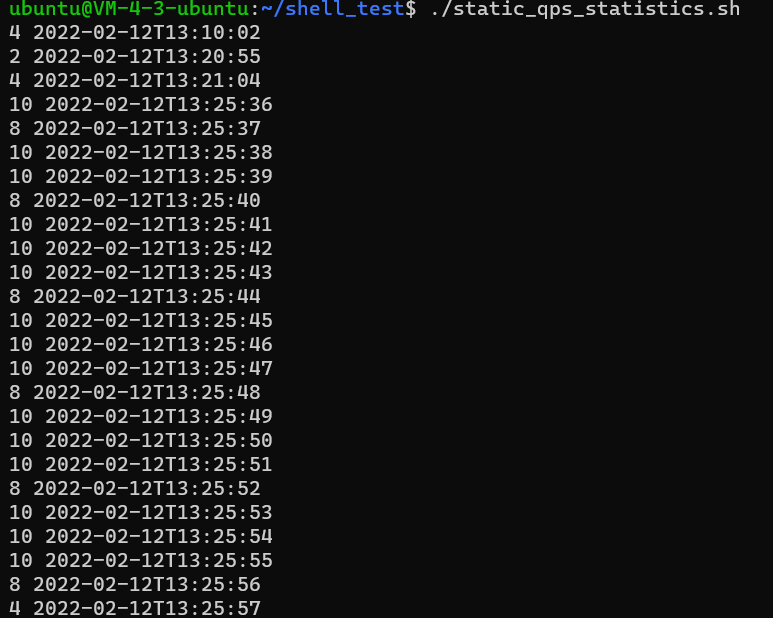
QPS统计
思路:筛选出所有HTTP请求,然后以秒为时间单位统计出每一秒的请求次数。
file_name="docker-cluster_server.json" #日志文件

#筛选出http的记录,然后把http响应过滤掉,只留下请求
grep HttpTracer ${file_name} | grep -E 'GET|POST|PUT|DELETE|HEAD|CONNECT|OPTIONS' > temp_file2.log
#截取出时间部分的文本
awk -F ',' '{print $2}' temp_file2.log | awk -F '"' '{print $4}' > temp_file3.log
#排序并统计每一秒的请求
sort temp_file3.log | uniq -c > result.log
#输出结果
cat result.log | while read line
do
    echo $line
done
#删除中间的临时文件
rm temp_file2.log temp_file3.log result.log
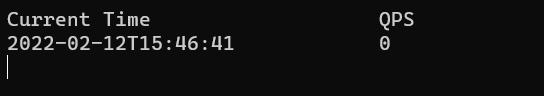
QPS实时监控
思路:获取当前时间(秒级时间),去日志文件查该时间下的HTTP请求数量,用while循环不断刷新结果。
file_name="../logs/docker-cluster_server.json" #日志文件

while :
do
    clear
    current_time=`date "+%Y-%m-%dT%H:%M:%S"` #当前时间
    sleep 1
    grep ${current_time} ${file_name} > temp_file1.log #获取当前时间下的日志记录
    grep HttpTracer temp_file1.log | grep -E 'GET|POST|PUT|DELETE|HEAD|CONNECT|OPTIONS' > temp_file2.log #过滤出HTTP请求,http响应不需要
    awk -F ',' '{print $2}' temp_file2.log | awk -F '"' '{print $4}' > temp_file3.log  #截取出时间部分的文本
    qps=`wc -l < temp_file3.log`
    # 输出
    printf "%-30s %-20s\n" "Current Time" "QPS"
    printf "%-30s %-20s\n" ${current_time} ${qps}
    # 通过输入参数自定义刷新时间间隔
    if [ -n "$1" ]; then
	sleep $1
    else
    	sleep 1
    fi
    rm temp_file1.log temp_file2.log temp_file3.log
done
待解决: 避免使用临时文件来记录中间结果
参考文献:
ElasticSearch日志配置:https://www.cnblogs.com/cocowool/p/elasticsearch-log-config.html
elasticsearch docker 开启日志:https://blog.csdn.net/weixin_42209307/article/details/114261820

 浙公网安备 33010602011771号