echars 三角形图表


 代码如下:

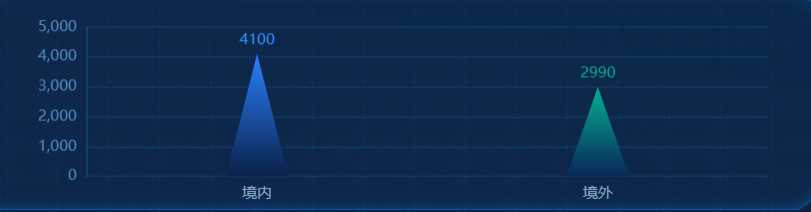
function mychart3() {
    myChart3 = echarts.init(document.getElementById('profitIncome'));
    let echartData = [{
        name: "境内",
        value: 4100,
    },
    {
        name: "境外",
        value: 2990,
    }];
    let xAxisData = echartData.map(v => v.name);
    let yAxisData = echartData.map(v => v.value);
    option = {
        grid: {
            left: '15%',
            top: '20%',
            right: '8%',
            bottom: '15%'
        },
        xAxis: {
            type: 'category',
            data: xAxisData,
            triggerEvent:true,//设置坐标点击事件
            axisTick: {show: false},
            axisLine: {
                show: false,
            },
            axisLabel: {
                color: "#81ACCF",
                fontSize: '80%',
            },
        },
        yAxis: {
            nameTextStyle:{
                color:'#81ACCF',
                fontSize:'60%',
            },
            splitLine: {
                show: true,
                lineStyle: {
                    type: "dotted",
                    color: "#0C4F81"
                }
            },
            axisLabel: {
                color: "#4F88BD",
                fontSize: '60%',
                formatter: '{value}'
            },
            axisLine: { //改变坐标轴的颜色
                show: true,//显示纵坐标
                lineStyle: {
                    color: "#0C4F81"
                },
            },
        },
        color: ['#307fd0'],
        series: [{
            name: 'hill',
            type: 'pictorialBar',
            //位置偏移,距离0刻度的位置
            barCategoryGap: '80%',
            //图形宽度
            barWidth:50,
            //图形形状
            symbol: 'path://M150 50 L130 130 L170 130  Z',
            itemStyle: {
                normal: {
                    color: function(params){
                        var a = params.name.slice(0,2);
                        if(a === '境内'){
                            return new echarts.graphic.LinearGradient(0, 0, 0, 1, [{
                                offset: 0,
                                color: "rgba(43, 128, 255, 1)"
                            },{
                                offset: 1,
                                color: "rgba(8, 33, 73, 1)"
                            }], false)
                        }else if(a === '境外'){
                            return new echarts.graphic.LinearGradient(0, 0, 0, 1, [{
                                offset: 0,
                                color: 'rgba(2, 176, 147, 1)' // 0% 处的颜色
                            }, {
                                offset: 1,
                                color:  'rgba(8, 39, 87, 1)'// 100% 处的颜色
                            }], false)
                        }
                    },
                    label: {
                        show: true,  //开启显示
                        position: 'top',  //在上方显示
                        textStyle: {  //数值样式
                            // color: '#77C8FF',
                            fontSize: '60%'
                        },
                        formatter:function(params){//设置柱状图上文本的颜色不同
                            // console.log(params.dataIndex)
                            if(params.dataIndex %2==0){
                                return '{a|'+ yAxisData[params.dataIndex]+'}'
                            }else{
                                return '{b|'+ yAxisData[params.dataIndex]+'}'
                            }
                        },
                        rich:{
                            a:{
                                color:"#2B8FFF"
                            },
                            b:{
                                color:"#03A88E"
                            },
                        }
                    },
                },
            },
            data: yAxisData,
            z: 10
        }, {
            name: 'glyph',
            type: 'pictorialBar',
            barGap: '0%',
            symbolPosition: 'end',
            symbolSize: 50,
            symbolOffset: [0, '-120%']
        }]
    };
    myChart3.setOption(option);
}


posted @ 2021-06-07 16:20  vaelcy  阅读(696)  评论(0编辑  收藏  举报