ECharts动态获取后台传过来的json数据进行多个折线图的显示,折线的数据由后台传过来
ECharts动态获取后台传过来的json数据进行多个折线图的显示,折线的数据由后台传过来
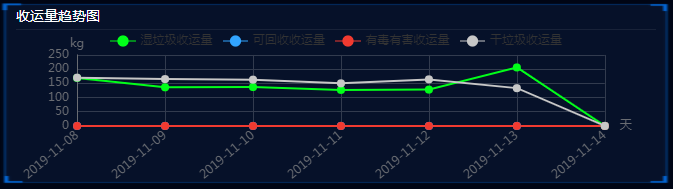
ECharts 多个折线图动态获取json数据
效果图如下:
js部分:
function mychart1(datetime,dateNums1,dateNums2,dateNums3,dateNums4) {
    myChart1 = echarts.init(document.getElementById('main1'));
    option = {
        title: {
            text: '',
            left: 'left',
            top: '4%',
            textStyle: {
                color: '#000000',
                fontSize: 16
            },
        },
        tooltip: {
            trigger: 'item',
            formatter: '{a} <br/>{b} : {c}'
        },
        legend: {
            data:['湿垃圾收运量','可回收收运量','有毒有害收运量','干垃圾收运量']
        },
        xAxis: {
            type: 'category',
            boundaryGap: false,
            name: '天',
            splitLine: {
                show: true, //网格线是否显示
                lineStyle: {
                    color: '#323B4E' // 修改网格线颜色
                }
            },
            axisLine: {
                //                        symbol: ['none', 'arrow'], //箭头
                lineStyle: {
                    color: '#696C72',
                }
            },
            axisTick: { //qu刻度线
                show: false
            },
            axisLabel: { //x轴时间文字显示不全问题
                interval: 0,
                rotate: 40
            },
            data: datetime
        },
        grid: {
            left: '5%',
            right: '8%',
            bottom: '0%',
            top: '16%',
            containLabel: true
        },
        yAxis: {
            type: 'value',
            //            min: 0, //y轴最小值设置
            //            max: 100, //y轴最大值设置
                                name: 'kg',
            nameLocation: 'end',
            nameTextStyle: {
                padding: -10,
            },
            splitLine: {
                show: true, //网格线是否显示
                lineStyle: {
                    color: '#323B4E' // 修改网格线颜色
                }
            },
            axisLine: {
                //                        symbol: ['none', 'arrow'],
                lineStyle: {
                    color: '#696C72' //0c3b71
                }
            },
            axisTick: {
                show: false
            },
        },
        series: [{
            symbol: 'circle',
            symbolSize: 8,
            itemStyle: {
                normal: {
                    color: "#01ff19",
                    lineStyle: {
                        color: "#01ff19",
                    }
                }
            },
            name: '湿垃圾收运量',
            type: 'line',
            data: dateNums1
        },{
            symbol: 'circle',
            symbolSize: 8,
            itemStyle: {
                normal: {
                    color: "#31A4FF",
                    lineStyle: {
                        color: "#31A4FF",
                    }
                }
            },
            name: '可回收收运量',
            type: 'line',
            data: dateNums2
        },{
            symbol: 'circle',
            symbolSize: 8,
            itemStyle: {
                normal: {
                    color: "#F13A30",
                    lineStyle: {
                        color: "#F13A30",
                    }
                }
            },
            name: '有毒有害收运量',
            type: 'line',
            data: dateNums3
        },{
            symbol: 'circle',
            symbolSize: 8,
            itemStyle: {
                normal: {
                    color: "#C7C7C7",
                    lineStyle: {
                        color: "#C7C7C7",
                    }
                }
            },
            name: '干垃圾收运量',
            type: 'line',
            data: dateNums4
        }]
    };
    myChart1.setOption(option);
}


function echarsfun1() {
    var param = {
        "name": houseName
    }
    var paramStr = $.param(param)
    ajaxGet("largeScreenDisplayController.do?todayTrend&" + paramStr, function(data) {
        var data = JSON.parse(data)
        if(data) {
            var data = data.data
            console.log(data)
            var datetime = []; //时间
            var dateNums1 = []; //湿垃圾
            var dateNums2 = []; //可回收
            var dateNums3 = []; //有毒有害
            var dateNums4 = []; //干垃圾
            //湿垃圾
            $.each(data.yfgarWeightMapList, function (index, item) {
          datetime.push(item.times);    //挨个取出类别并填入类别数组
                dateNums1.push(item.yfgarWeight);
            });
            //可回收
            $.each(data.recycleWeightMapList, function (index, item) {
                dateNums2.push(item.recycleWeight);
            });
            //有毒有害
            $.each(data.youduWeightMapList, function (index, item) {
                dateNums3.push(item.youduWeight);
            });
            //干垃圾
            $.each(data.otherWeightMapList, function (index, item) {
                dateNums4.push(item.otherWeight);
            });
            mychart1(datetime,dateNums1,dateNums2,dateNums3,dateNums4)
        }
    })
}
后台传过来的json数据格式
后台传过来的json数据格式
{
 "msg": "获取成功",
 "code": 0,
 "data": {
  "otherWeightMapList": [{
   "times": "2019-11-07",
   "otherWeight": "160"
  }, {
   "times": "2019-11-08",
   "otherWeight": "170"
  }, {
   "times": "2019-11-09",
   "otherWeight": "165"
  }, {
   "times": "2019-11-10",
   "otherWeight": "163"
  }],
  "recycleWeightMapList": [{
   "times": "2019-11-07",
   "recycleWeight": "0"
  }, {
   "times": "2019-11-08",
   "recycleWeight": "0"
  }, {
   "times": "2019-11-09",
   "recycleWeight": "0"
  }, {
   "times": "2019-11-10",
   "recycleWeight": "0"
  }],
  "youduWeightMapList": [{
   "times": "2019-11-07",
   "youduWeight": "0"
  }, {
   "times": "2019-11-08",
   "youduWeight": "0"
  }, {
   "times": "2019-11-09",
   "youduWeight": "0"
  }, {
   "times": "2019-11-10",
   "youduWeight": "0"
  }],
  "yfgarWeightMapList": [{
   "yfgarWeight": "156",
   "times": "2019-11-07"
  }, {
   "yfgarWeight": "169",
   "times": "2019-11-08"
  }, {
   "yfgarWeight": "136",
   "times": "2019-11-09"
  }, {
   "yfgarWeight": "137",
   "times": "2019-11-10"
  }]
 }
}

 浙公网安备 33010602011771号