
学习unigui【24】Echart的使用:多个坐标系
使用echart非常简单,网上有介绍。
主要放一个unihtmlFrame。然后unihtmlframe.text := 'html的代码',就会渲染(初次调用echart的js库要一点稍后)。
unigui本身的chart貌似不能动态生成。
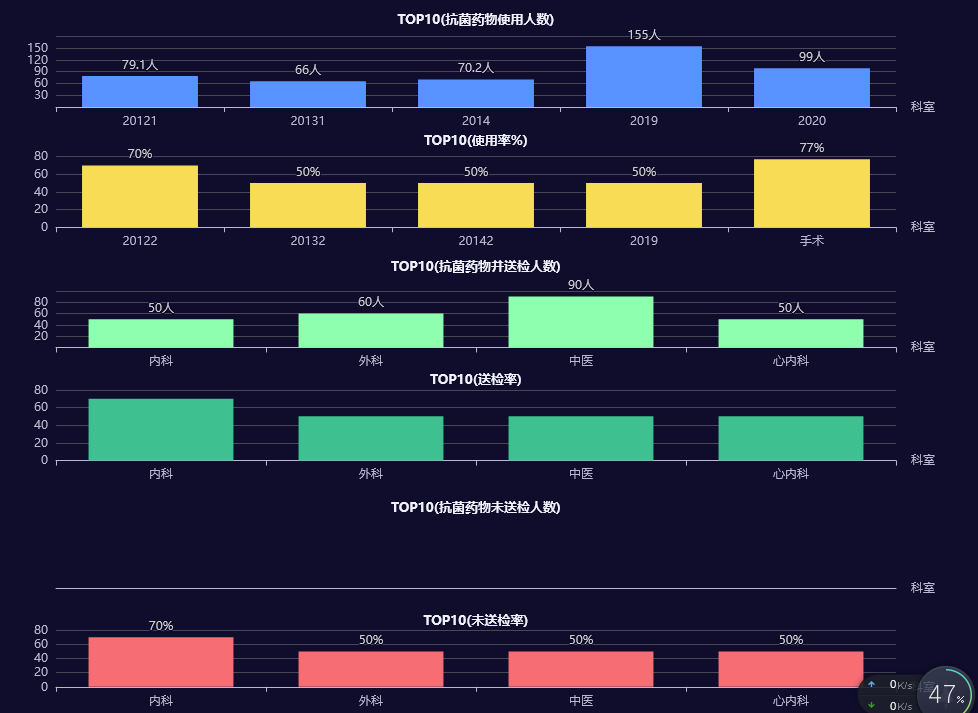
option = {
title: [{
              text: 'TOP10(抗菌药物使用人数)',
              top: '1%',
              left:'center',

              textStyle:{
                 // color:'#d1ecff',
                  fontStyle:'normal',
                  fontWeight:'600',
                  fontFamily:'sans-serif',
              fontSize:13
              }
          },{
              text: "TOP10(使用率%)",
              top:'18.2%',
              left:'center',
              textStyle:{
                  //color:'#ccc',
                  fontStyle:'normal',
                  fontWeight:'600',
                  fontFamily:'sans-serif',
               fontSize:13
              }
          },
          {
              text: "TOP10(抗菌药物并送检人数)",
              top:'36%',
              left:'center',
              textStyle:{
                 // color:'#ccc',
                  fontStyle:'normal',
                  fontWeight:'600',
                  fontFamily:'sans-serif',
               fontSize:13
              }
          },
          {
              text: "TOP10(送检率)",
              top:'52%',
              left:'center',
              textStyle:{
                 // color:'#ccc',
                  fontStyle:'normal',
                  fontWeight:'600',
                  fontFamily:'sans-serif',
               fontSize:13
              }
          },
          {
              text: "TOP10(抗菌药物未送检人数)",
              top:'70%',
              left:'center',
              textStyle:{
                 // color:'#ccc',
                  fontStyle:'normal',
                  fontWeight:'600',
                  fontFamily:'sans-serif',
               fontSize:13
              }
          },
          {
              text: "TOP10(未送检率)",
              top:'86%',
              left:'center',
              textStyle:{
                 // color:'#ccc',
                  fontStyle:'normal',
                  fontWeight:'600',
                  fontFamily:'sans-serif',
               fontSize:13
              }
          },
          ],
  legend: {},
  tooltip: {},
  dataset: {
    source: [
      // ['product', '2012', '2013', '2014', '2019'],
      // ['Product A', 79.1, 66, 70.2, 155,99],
      // ['Product B', 50, 50, 50, 50,88],
      // ['Product c', 70, 50, 50, 50,77]

    ]
  },
  xAxis: [
    { type: 'category', gridIndex: 0,name: '科室',data: ['20121', '20131', '2014','2019','2020']  },
    { type: 'category', gridIndex: 1,name: '科室',data: ['20122', '20132', '20142','2019','手术'] },
    { type: 'category', gridIndex: 2,name: '科室',data: ['内科', '外科', '中医','心内科'] }, // 新增坐标轴,设置其所属网格为新添加的第三个网格
    { type: 'category', gridIndex: 3,name: '科室',data: ['内科', '外科', '中医','心内科'] },
    { type: 'category', gridIndex: 4,name: '科室',data: [] },
    { type: 'category', gridIndex: 5,name: '科室',data: ['内科', '外科', '中医','心内科'] }
  ],
  yAxis: [
    { gridIndex: 0,name:'' },
    { gridIndex: 1,name:'' },
    { gridIndex: 2,name:'' }, // 新增坐标轴,设置其所属网格为新添加的第三个网格
    { gridIndex: 3,name:'' },
    { gridIndex: 4,name:'' },
    { gridIndex: 5,name:'' }
    ],
  grid: [
    {id: 'grid-top-1', top: '5%', height: '10%',title : '报警、处理次数分析统计'},
    {id: 'grid-top-2', top: '22%', height: '10%'},
    {id: 'grid-top-3', top: '41%', height: '8%'},
    {id: 'grid-bottom-1',bottom: '3%', height: '8%'},
    {id: 'grid-bottom-2',bottom: '17%', height: '10%'},
    {id: 'grid-bottom-3',bottom: '35%',  height: '10%'}
  ],
  series: [
    { label:{show:true,position:'top',formatter:function(data){return data.value+'人'}},
    type: 'bar',seriesLayoutBy: 'row', xAxisIndex: 0, yAxisIndex: 0,data:[79.1, 66, 70.2, 155,99] },
    { label:{show:true,position:'top',formatter:function(data){return data.value+'人'}},
    type: 'bar', seriesLayoutBy: 'row', xAxisIndex: 2, yAxisIndex: 2, data:[50, 60, 90, 50,88] },

    { label:{show:true,position:'top',formatter:function(data){return data.value+'%'}},
    type: 'bar', seriesLayoutBy: 'row', xAxisIndex: 1, yAxisIndex: 1,data:[70, 50, 50, 50,77] },

    // 新增系列

    { label:{show:true,position:'top',formatter:function(data){return data.value+'%'}},
      type: 'bar', seriesLayoutBy: 'row', xAxisIndex: 3, yAxisIndex: 3,  data: [70, 50, 50, 50,77] },

    { type: 'bar', seriesLayoutBy: 'row', xAxisIndex: 4, yAxisIndex: 4,  data: [] },

    { type: 'bar', seriesLayoutBy: 'row', xAxisIndex: 5, yAxisIndex: 5,  data: [70, 50, 50, 50,77] },

  ]
};
需要更新数据的话,直接使用占位符替换。然后把代码赋值给uniHTMLFrame.text,立马渲染出来。

 浙公网安备 33010602011771号