
2022年工匠杯赛题
1. 第一题
from random import choice
from numpy import *
import pandas as pd
import matplotlib.pyplot as plt
#1
df = pd.read_csv('stock_prices.tsv', sep='\t')
n1 = choice(df[df['Industry']=='retail']['Symbol'].unique())
n2 = choice(df[df['Industry']=='health']['Symbol'].unique())
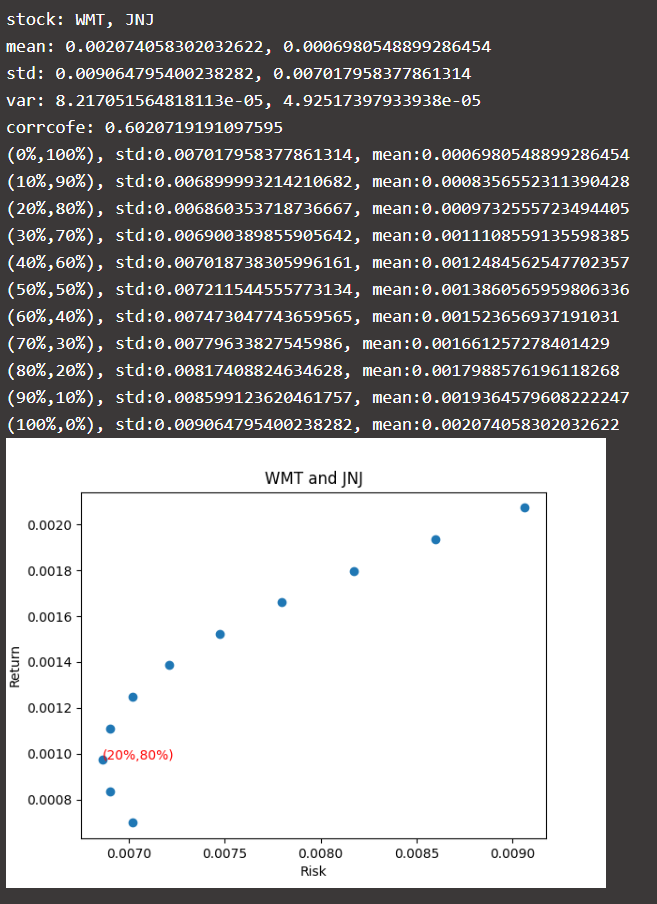
print('stock: {}, {}'.format(n1, n2))
s1 = df[(df['Industry']=='retail') & (df['Symbol']==n1)].sort_values('Date')['Adj Close']
s2 = df[(df['Industry']=='health') & (df['Symbol']==n2)].sort_values('Date')['Adj Close']
log1 = (log(s1)-log(s1.shift(1))).dropna()
log2 = (log(s2)-log(s2.shift(1))).dropna()
print('mean: {}, {}'.format(mean(log1), mean(log2)))
print('std: {}, {}'.format(std(log1), std(log2)))
print('var: {}, {}'.format(var(log1), var(log2)))
print('corrcofe: {}'.format(corrcoef(log1,log2)[0,1]))
#2
l,x,y=[],[],[]
for w in arange(0, 1.1, 0.1):
ary = w*array(log1)+(1-w)*array(log2)
la = '({:.0%},{:.0%})'.format(w,1-w)
st = std(ary)
me= mean(ary)
print('{}, std:{}, mean:{}'.format(la,st,me))
l.append(la)
x.append(st)
y.append(me)
# 3
plt.scatter(x,y)
idx = argmin(x)
plt.text(x[idx],y[idx],l[idx],c='r')
plt.xlabel('Risk')
plt.ylabel('Return')
plt.title('{} and {}'.format(n1,n2))
plt.show()
2. 第二题
import pandas as pd
import matplotlib.pyplot as plt
from sklearn.model_selection import train_test_split
from sklearn.linear_model import LinearRegression, Lasso, Ridge
from sklearn.metrics import mean_squared_error as mse
#1
df = pd.read_csv('loan_amount_by_risk_control_zscore.tsv', sep='\t')
x = df[['ApplicantIncome']]
y = df[['LoanAmount']]
x_train,x_test,y_train,y_test = train_test_split(x, y)
r = LinearRegression().fit(x_train,y_train)
y_p = r.predict(x_test)
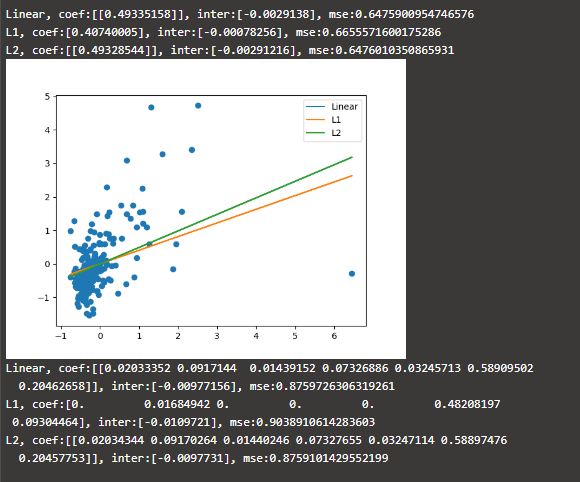
print('Linear, coef:{}, inter:{}, mse:{}'.format(r.coef_, r.intercept_, mse(y_test,y_p)))
#2
r1 = Lasso(alpha=0.1).fit(x_train,y_train)
y_p1 = r1.predict(x_test)
print('L1, coef:{}, inter:{}, mse:{}'.format(r1.coef_, r1.intercept_, mse(y_test,y_p1)))
r2 = Ridge(alpha=0.1).fit(x_train,y_train)
y_p2 = r2.predict(x_test)
print('L2, coef:{}, inter:{}, mse:{}'.format(r2.coef_, r2.intercept_, mse(y_test,y_p2)))
plt.scatter(x_test,y_test)
plt.plot(x_test,y_p,label='Linear')
plt.plot(x_test,y_p1,label='L1')
plt.plot(x_test,y_p2,label='L2')
plt.legend()
plt.show()
#3
x = df[['Gender','Married','Dependents','Education','Self_Employed','ApplicantIncome','CoapplicantIncome']]
y = df[['LoanAmount']]
x_train,x_test,y_train,y_test = train_test_split(x, y)
r = LinearRegression().fit(x_train,y_train)
y_p = r.predict(x_test)
print('Linear, coef:{}, inter:{}, mse:{}'.format(r.coef_, r.intercept_, mse(y_test,y_p)))
r1 = Lasso(alpha=0.1).fit(x_train,y_train)
y_p1 = r1.predict(x_test)
print('L1, coef:{}, inter:{}, mse:{}'.format(r1.coef_, r1.intercept_, mse(y_test,y_p1)))
r2 = Ridge(alpha=0.1).fit(x_train,y_train)
y_p2 = r2.predict(x_test)
print('L2, coef:{}, inter:{}, mse:{}'.format(r2.coef_, r2.intercept_, mse(y_test,y_p2)))
posted on 2022-09-03 16:08 chenxiaoyuan 阅读(100) 评论(1) 收藏 举报

 浙公网安备 33010602011771号