

Color
What Determines the Colors We See
Light - The Electromagnetic Signal
It is the spectral composition, the energy spectral distribution \(L(\lambda)\) of the light that is the signal the eye receives for the brain to process. Sometimes \(L(\lambda)\) may be referred to as the color, but this is to be distinguished from the actual color we perceive from this light.
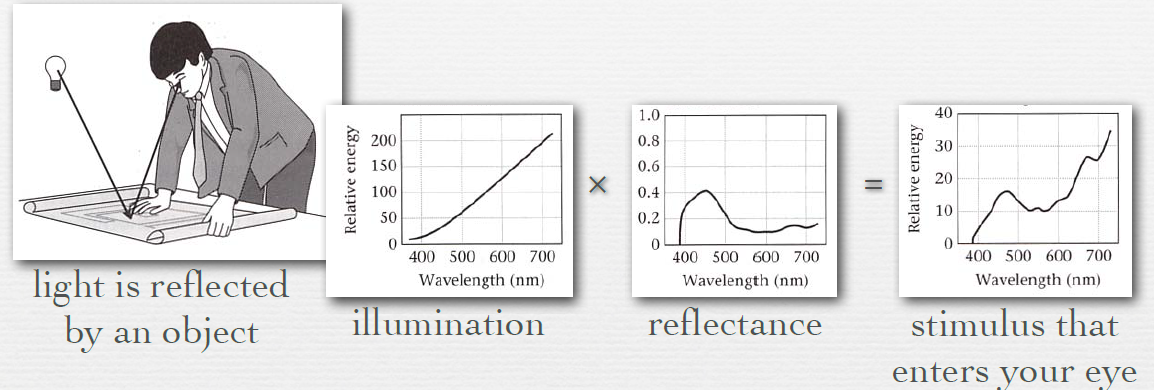
- illumination is multiplied wavelength-by-wavelength by reflectance of object at that wavelength
• cause is absorption by the material
• so the spectrum you see depends on the illumination - transmittance operates the same way
Newton's experiments and contributions (1704):
- Decomposition of white light by a prism into many spectral lights, and reconstruction of a white light from the spectral lights by a second prism; A spectral light can not be further decomposed.
- A spinning round plate with sections painted in different colors would look white;
- Realization that perception of color is caused by the spectral composition of the light.
SPD
These radiometric quantities are each described by their spectral power distribution (SPD)—a distribution function of wavelength that describes the amount of light at each wavelength. A plot giving the amount of light of each wavelength present in a light beam is called its spectral power distribution (SPD), or spectrum for short.
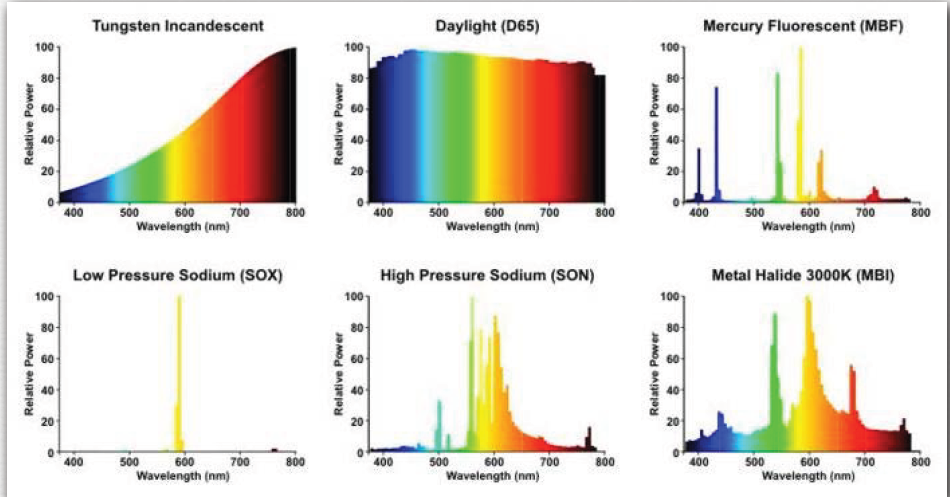 不同物质的SPD (Spectral power distrbution)
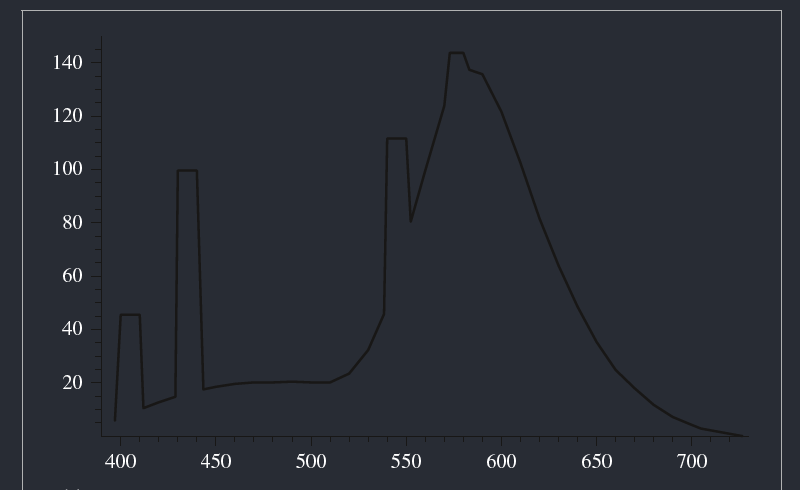
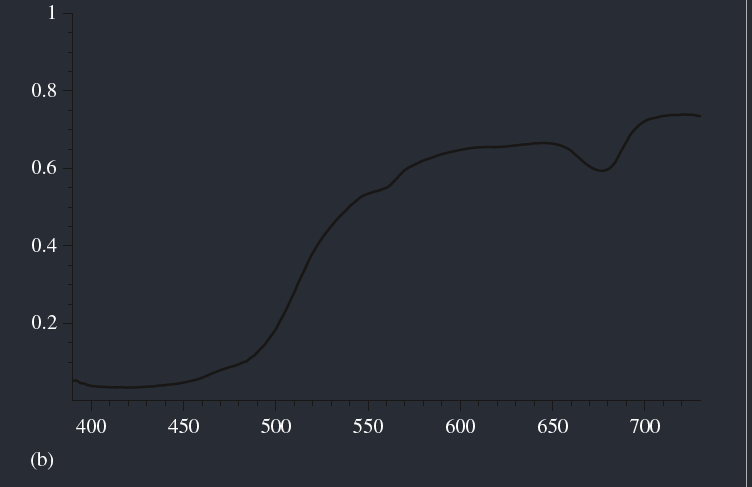
Figure shows graphs of the spectral distribution of emission from a fluorescent light and the spectral distribution of the reflectance of lemon skin. (a) Spectral power distributions of a fluorescent light and (b) the reflectance of lemon skin. Wavelengths around 400 nm are bluish colors, greens and yellows are in the middle range of wavelengths, and reds have wavelengths around 700 nm.
A general framework for investigating these issues can be developed based on the problem of finding good basis functions to represent SPDs. The idea behind basis functions is to map the infinite-dimensional space of possible SPD functions to a low-dimensional space of coefficients $c_{i} \in R $.
Many different basis functions have been investigated for spectral representation in computer
graphics; the . In this chapter, we’ll introduce two representations that can be used for spectra in pbrt: RGBSpectrum, which follows the typical computer graphics practice of representing SPDs with coefficients representing a mixture of red, green, and blue colors, and SampledSpectrum, which represents the SPD as a set of point samples over a range of wavelengths.
color response in animals and humans
Trichromats
| Math | Img |
|---|---|
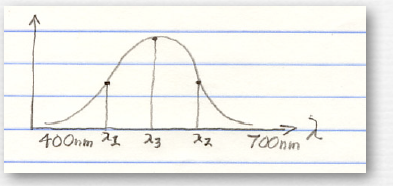 |
organisms having only one kind of retinal receptor cannot distinguish changes in intensity from changes in wavelength, hence they have no color discrimination. |
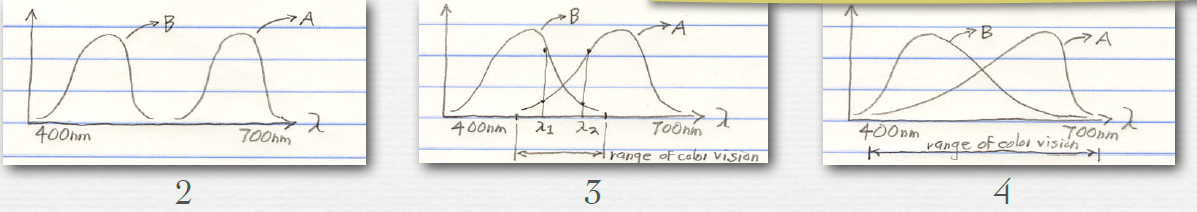 |
2.this organism can discrimate a response in the range of wavelengths covered by A versus by B, but cannot discriminate within those ranges ;3.this organism has color discrimination over the range of wavelengths shown 4.this organism has a larger range of color vision |
 |
5.humans can discrimate wavelengths from 400nm to 700nm,we can also discriminate mixtures of wavelengths that dichromats cannot |
retinal level
At the retinal level, our response to light is linear
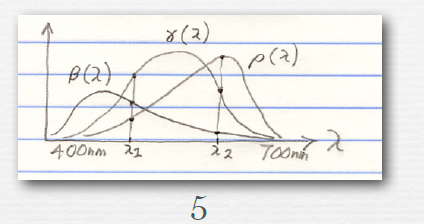
- If the response to a unit stimulus at \(\lambda_{1}\) is (\(\rho_{1}\), \(\gamma_{1}\), \(\beta_{1}\)), and to a unit stimulus at \(\lambda_{2}\) is (\(\rho_{2}\), \(\gamma_{2}\), \(\beta_{2}\)), then the response to a
superposition of stimuli \(\lambda_{1}\) and \(\lambda_{2}\) is (\(\rho_{1} + \rho_{2}\), \(\gamma_{1} + \gamma_{2}\), \(\beta_{1}+ \beta_{2}\)) - The response to n units of a stimulus at \(\lambda_{1}\) is (\(n\rho_{1}\), \(n\gamma_{1}\), \(n\beta_{1}\))
- A system that obeys superposition (a) and scaling (b) is linear
Sensitivity functions
There are two types of photoreceptor cells called rods and cones.
- Rods are very sensitive to light and can respond to just a few photons.
- Cones need significantly brighter light.
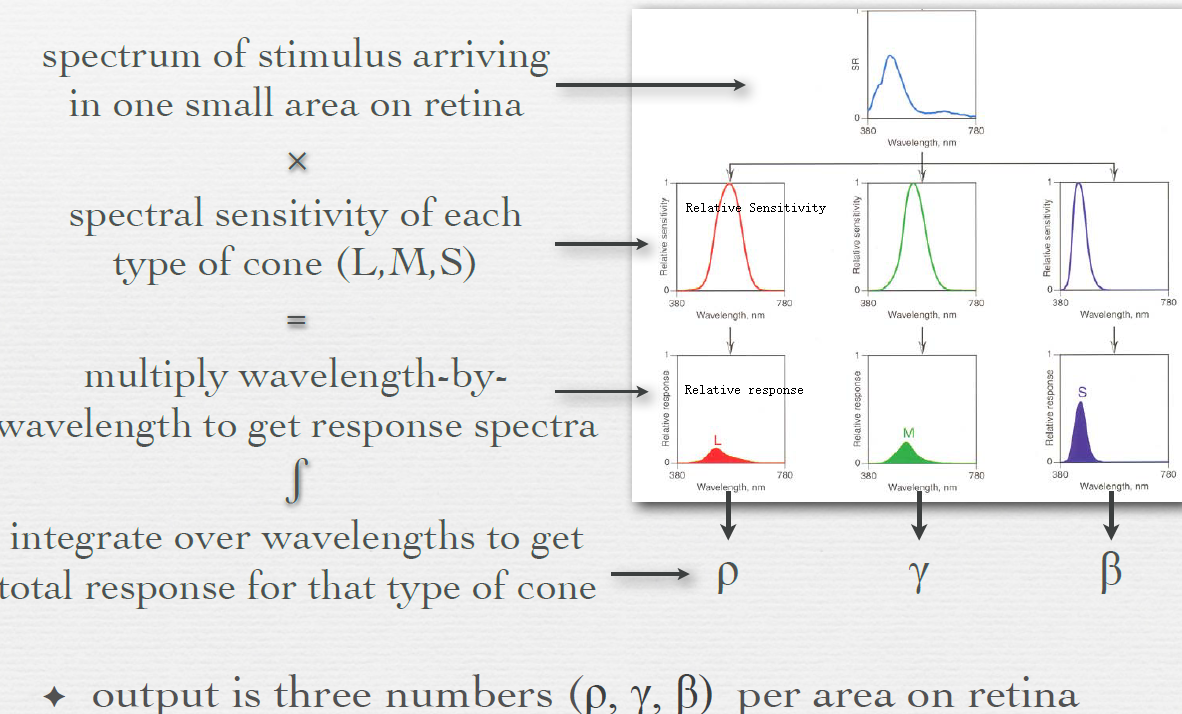
There are three types of cone cells (called the S type, M type, and L type) with different sensitivities, responding to short, medium, and long wavelengths. Color vision is the result of these three types of cone cells.
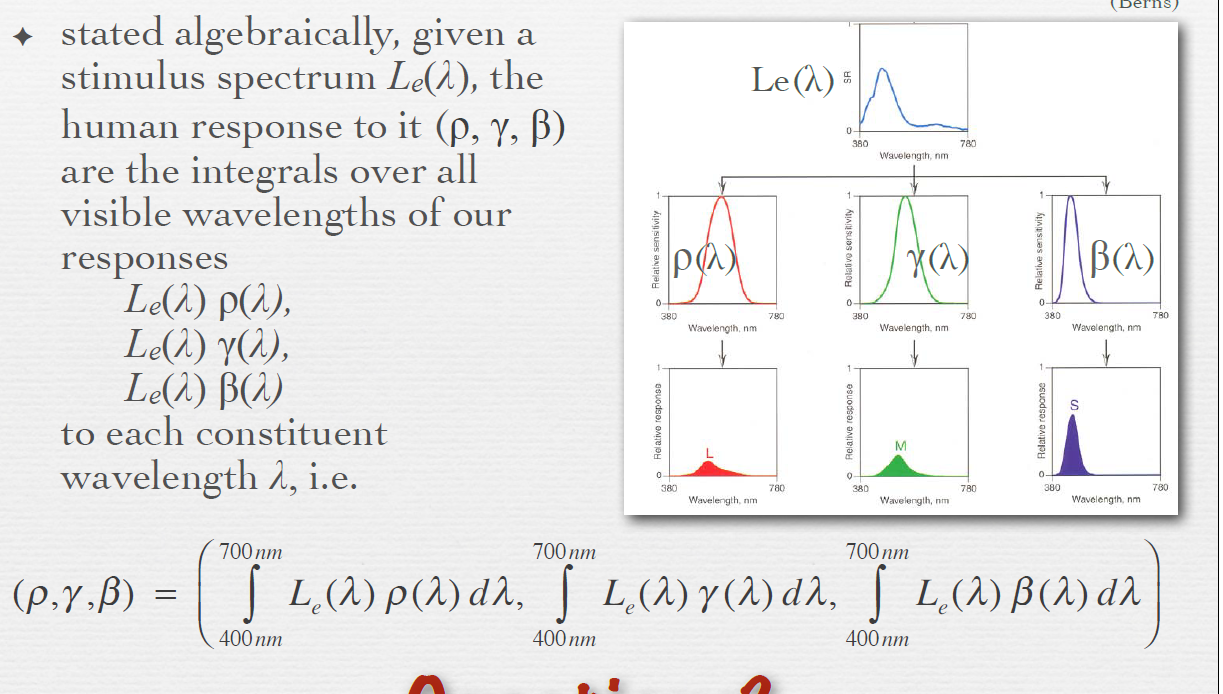
The physical intensity measurements of the electromagnetic energy distribution is related to the perceptual brightness and color by the scotopic (dim light mediated by the rods) and the photopic (bright light mediated by the cones) sensitivity or luminosity functions \(S(\lambda)\). Specifically, the magnitude of the response of a photoreceptor (the firing rate) is determined by how much light is, or more specifically, how many photons are, absorbed by the photopigment of the photoreceptors. The more light a receptor catches, the stronger its response will be, and the more sensitive the receptor becomes. This property of the photoreceptors can be represented by its photon capture rate (number of photons absorbed per unit time), or its sensitivity, denoted by \(S(\lambda)\) as a function of wavelength \(\lambda\). The sensitivity functions of the three types of cone cells can be denoted by \(S_i(\lambda)\;\;\;(i=1,2,3)\) which peak approximately at 560 nm, 530 nm and 430 nm respectively, as shown.
Absorption of light in the cones of the human retina.
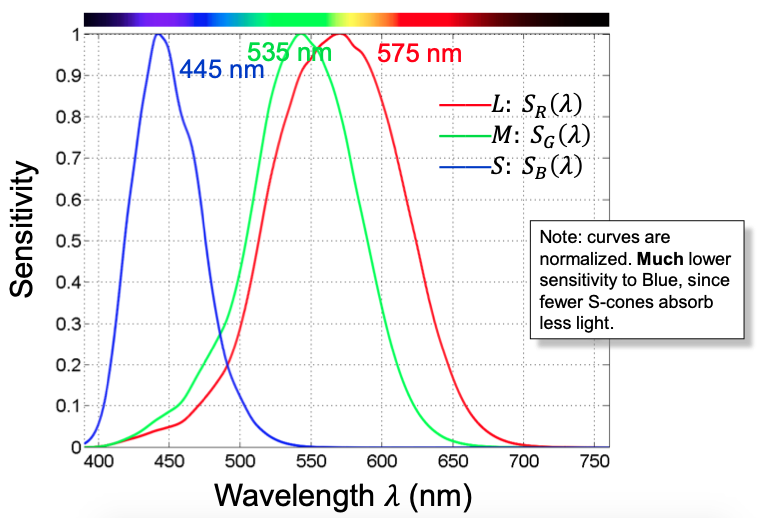
🚗 注意此处的\(S_{R}(\lambda)\),这里的\(S\)在后面会使用到这个符号,其代表的意思。个人猜测应该是左边那个 Sensitivity.
If the light received by the retina is \(L(\lambda)\), then the response of a photoreceptor is proportional to the total number of photons absorbed, which can be obtained by
上面式子是代表一个retina接受到的光。
Three-receptor model for color perception
(Sensitivity functions)
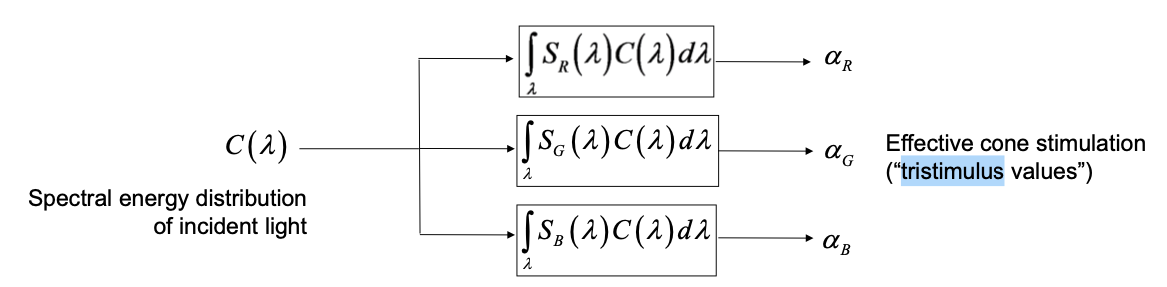
左侧入射光线能量分布(可以使用\(L(\lambda)\)表示),中间,右侧三色。图片中的\(C(\lambda)\)相当于\(L(\lambda)\).
Human response to an arbitrary stimulus
Color Matching and Trichromatic Theory
This theory emerged over the eighteenth century which basically states that any color \(L(\lambda)\) can be reproduced by mixing appropriate amounts of three primary colors with energy distributions \(P_j(\lambda),\;\;(j=1,2,3)\) provided the wavelengths are far enough apart. For example, red, green, and blue. As we will see later, ``far enough apart'' means mathematically the spectral energy distributions of the three colors are linearly independent.
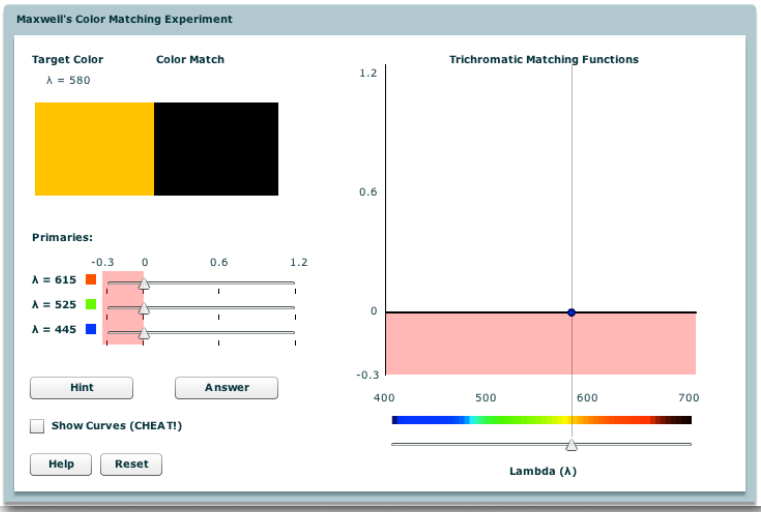
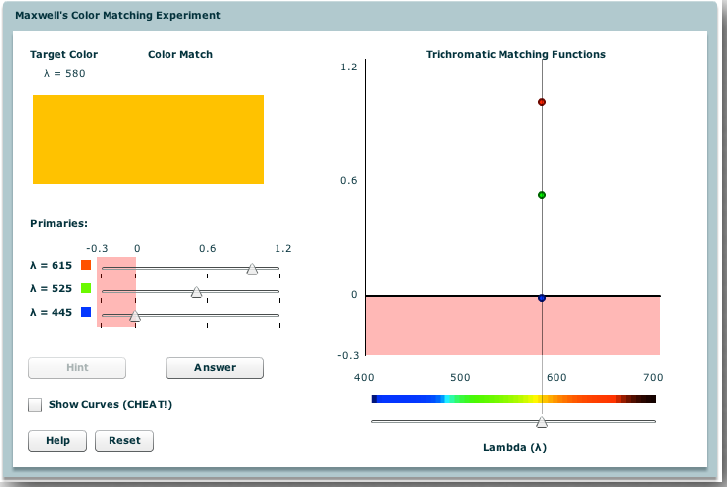
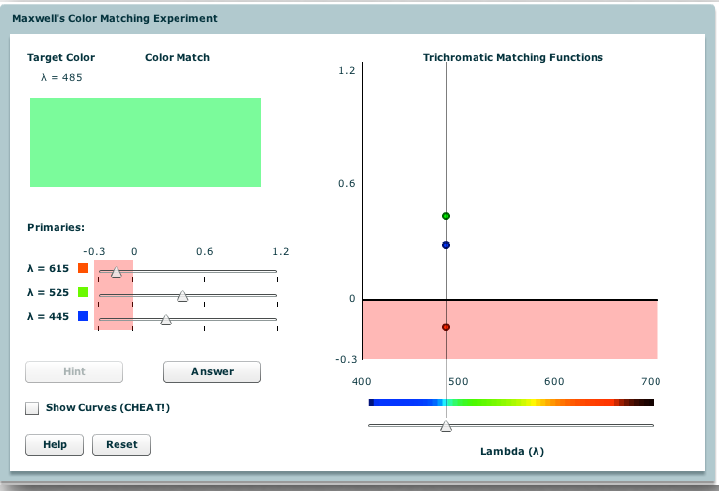
The Color Matching Experiment
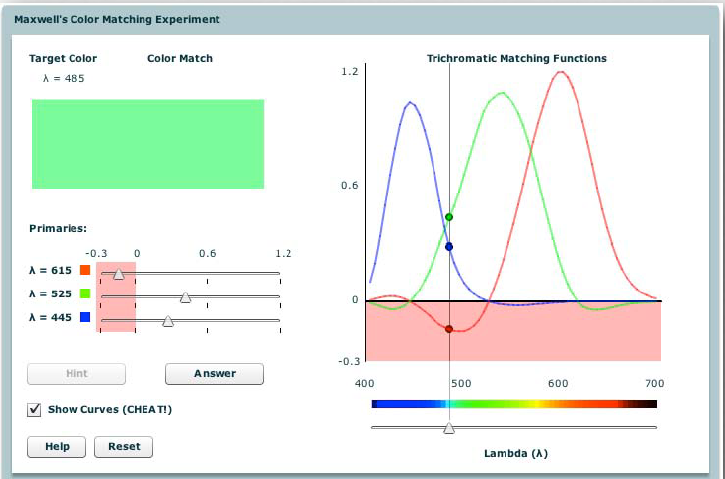
The goal of an additive color matching experiment is to superimpose appropriate amounts of the three primaries \(P_j\;\;\;(j=1,2,3)\) so that the resulting color \(L'\) is perceived the same as a given color \(L\). This can be actually carried out by three projectors that project the three primary colors with adjustable intensities on a screen. For a given choice of three primaries, one can record the amount of each primary required to visually match each color . This record can be plotted as three curves, shown above in the graph labeled "trichromatic matching functions". Unfortunately, as Maxwell discovered it is not possible using three pure-wavelength primaries to successfully match every color.
This process is symbolically represented by
$ [L]\equiv [L'] = A_1(L) [P_1] + A_2(L) [P_2] + A_3(L) [ P_3]$
This is not a mathematical equation in the normal sense, as the symbols used here have special meanings:
Anything inside a pair of brackets (e.g., \([L]\) or \([P_j]\)) is a color (an arbitrarily given color or a primary color) of certain energy spectral distribution;
\(A_j(L)\) is a scaler coefficients representing the amount of a primary color \(P_j\) needed to match the given color \(L\);
The symbol \(+\) represents the actual mixing of the colors by projecting them on the same screen.
The symbol \(\equiv\) means the color on the left-hand side is equivalent to that on the right-hand side in the sense that they are perceived by the human eye as the same color. (But this does not mean that the two energy distributions are necessarily the same, as discussed later.)
As we are usually concerned with the proportions of the color mixing but not the absolute intensities, the color matching process can be normalized by using a reference white color \(W\). The amount of primary \(P_j\) needed to match \(W\), represented by \(A_j(W)\), is used to normalize the intensity \(A_j(L)\) for matching \(L\):
$ T_j(L)=\frac{A_j(L)}{A_j(W)} (j=1,2,3) $
The \(T_j(L)\)'s are called the tristimulus values.
Maxwell’s color matching experiment
| Img | In |
|---|---|
 |
|
 |
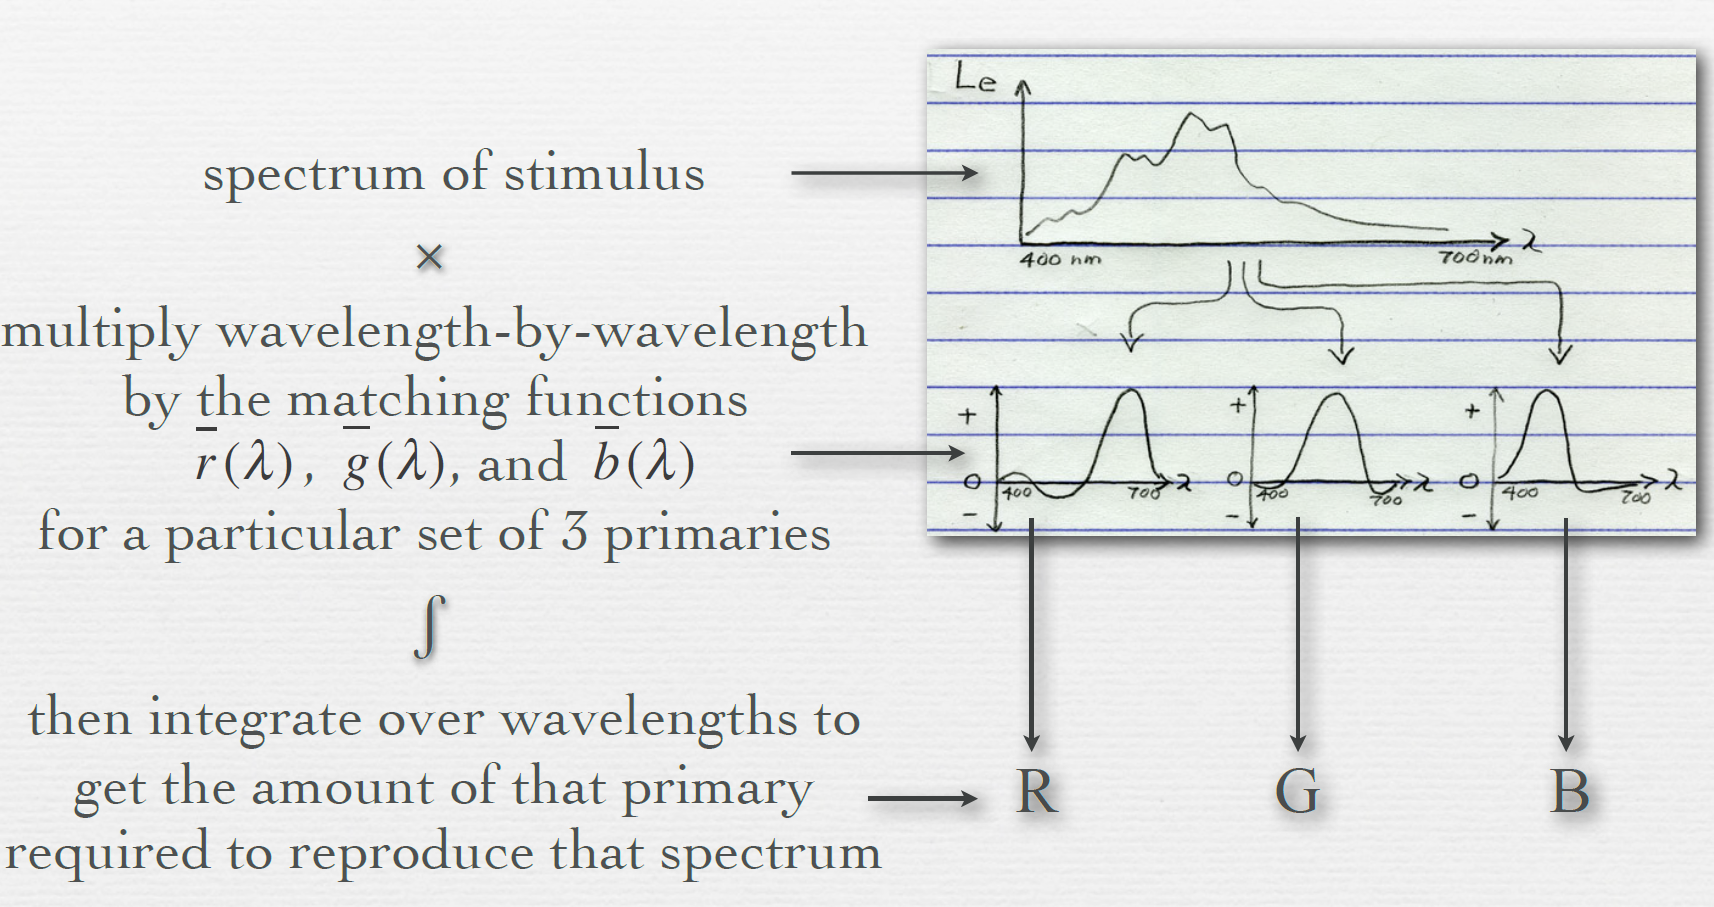
given a stimulus wavelength, the amount of each primary required to match it is given by three numbers \(( \overline{r}, \overline{g},\overline{b})\) |
 |
some stimuli cannot be matched unless first desaturated by adding some of one primary to it before matching; the amount added is denoted by negative values of \(\overline{r},\overline{g}\) or \(\overline{b}\) |
 |
the sequence of \(( \overline{r}, \overline{g},\overline{b})\) values, some negative, required to match the locus of spectral colors across all \(\lambda\), form the trichromatic matching functions \(\overline{r}(\lambda)\) ,\(\overline{g}(\lambda)\) ,\(\overline{b}(\lambda)\) and for a particular set of 3 primaries. |
Trichromatic Theory Revisited
Theory of Color Matching
Since normal humans have three cone receptor systems, we're called trichromats.
The visual system and the color system are described by
- The Visual System: The three types of photoreceptors with sensitivities \(S_i(\lambda),\;\;(i=1,2,3)\);
- The Color System: The three primaries with
energy spectral distributions\(P_j(\lambda),\;\;(j=1,2,3)\) together with the reference white \(W(\lambda)\).
We want to match a given color \(L(\lambda)\) with another color produced by mixing the three primaries
with proper weights or intensities \(A_j(L),\;\ (j=1,2,3)\).
Since color matching now means specifically that the three types of photoreceptors have the same responses to the two colors, we must require
The three equations above can now be rewritten to obtain the color matching equations:
其中 $a_{ij} = \int S_i(\lambda)P_j(\lambda)d\lambda $
关注上面的式子哦,后面会用到哦。
Solving this set of three simultaneous equations, we get the three coefficients \(A_j(L),\;\;(i=1,2,3)\), the weights for mixing the three primaries to produce color
which will be perceived the same as the given color \(L(\lambda)\):
Calibration with a Reference White
The absolute magnitudes of the weights \(A_j(L)\) is directly affected by the intensity of the given color \(L(\lambda)\). To calibrate various intensities, we normalize \(A_i(L)\)'s by comparing them against a reference white light source \(W(\lambda)\).
As discussed before, we define the tristimulus values of a given color \(L\) as
\(T_j(L)=\frac{A_j(L)}{A_j(W)} \qquad \qquad \qquad (j=1,2,3)\)
where \(A_j(W)\)'s are the weights for the three primaries to match the reference white \(W(\lambda)\). \(A_j(W)\)'s can be obtained by solving the matching equations for the reference white:
\(\sum_{j=1}^3 a_{ij} A_j(W) = \int S_i(\lambda) W(\lambda) d\lambda \;\;\;(i=1,2,3)\)
In particular, the tristimulus values for the reference white itself is always 1:
Now the color matching equations for an arbitrary color \(L(\lambda)\) become
Solving these equations, we can get \(T_j(L),\;\;(j=1,2,3)\) for matching any given color \(L(\lambda)\).
Spectral matching curves
If the color to be matched is a spectral color of a single wavelength \(\lambda'\) with unit energy:
the matching equations become
Solving these three simultaneous equations we can get the tristimulus values \(T_j(\lambda')\;\;\;(i=1,2,3)\) for the given spectral color \(\delta(\lambda-\lambda')\). As functions of wavelength \(\lambda\), these \(T_j(\lambda)\)'s are called the spectral matching curves representing amount of each primary needed to match a flat spectral distribution.
The spectral matching curves can also be used to obtain tristimulus values \(T_j(L)\) for any given color \(L(\lambda)\). To see this, we substitute
\(S_i(\lambda)=\sum_{j=1}^3 A_j(W) T_j(\lambda) a_{ij}\) into the color matching equations to get
As this equation holds for all three types of cells (i=1,2,3), we see that
$ T_j(L)=\int L(\lambda)T_j(\lambda) d\lambda;;;;(j=1,2,3)
$
the tristimulus values for matching any color \(L(\lambda)\) can be easily obtained from the spectral matching curves \(T_j(\lambda)\).
The Color Space
Representing Color in a 3D Space
Based on the tristimulus theory, any given color \(L(\lambda)\) can be matched by mixing proper amounts of three primaries:
\(L(\lambda) \equiv \sum_{j=1}^3 A_j(L) [P_j(\lambda)]\)
Because the intensities of incoherent lights add linearly, i.e., mixing colors $L_1=\sum_j A_j(L_1) P_j(\lambda) $ and $L_2=\sum_j A_j(L_2) P_j(\lambda) $ results a new color which is the linear combination (weighted sum) of the two colors
\(L_1+L_2=\sum_{j=1}^3 [A_j(L_1)+A_j(L_2)] P_j(\lambda)\)
posted on 2024-05-02 13:44 Ultraman_X 阅读(4) 评论(0) 编辑 收藏 举报

