
微信小程序之使用ecarts---详细步骤
由于第一次接触ecarts,而这次的需求又是在小程序上整个ecarts报表,所以踩了不少坑,下面做个简单记录。
首先,下载echarts微信版 地址:https://github.com/ecomfe/echarts-for-weixin
下载之后是这样的如下图所示:
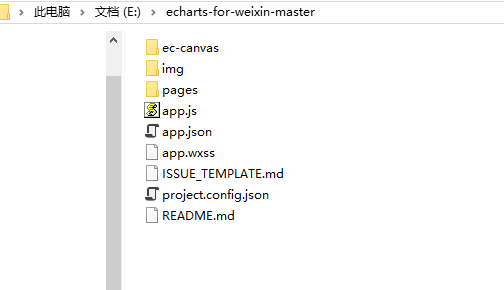
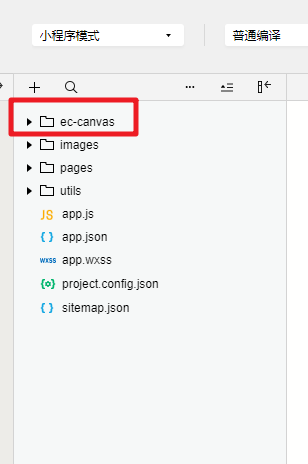
将下载好的文件中 ec-canvas目录 放在小程序项目目录中即可。如下图所示:
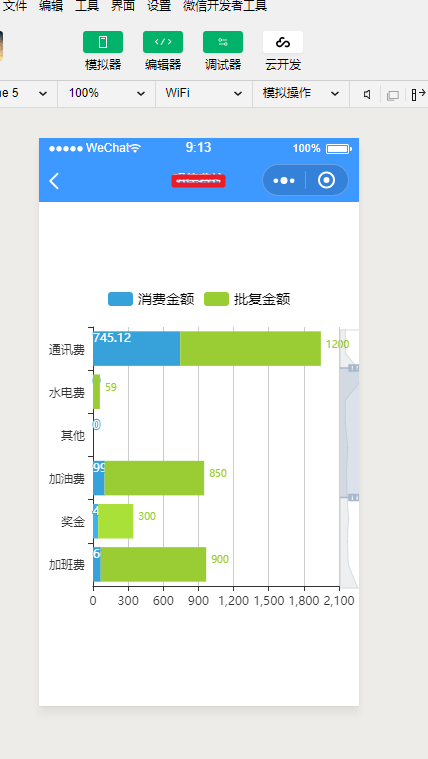
然后开始搭建页面结构,我做的效果图如下:
1.wxml代码:
<view class="container">
<ec-canvas id="mychart-dom-bar" canvas-id="mychart-bar" ec="{{ ec }}"></ec-canvas>
</view>
2.wxss代码:
ec-canvas {
width: 100%;
height: 100%;
}
/* 解决搬运代码之后页面变成空白 */
.container {
position: absolute;
top: 0;
bottom: 0;
left: 0;
right: 0;
display: flex;
flex-direction: column;
align-items: center;
justify-content: space-between;
box-sizing: border-box;
}
.picker-pos{
margin-top: -130rpx;
margin-left: 150rpx;
color: blueviolet
}
3.json代码:
{
"usingComponents": {
"ec-canvas": "../../ec-canvas/ec-canvas"
}
}
4.js代码:
import * as echarts from '../../ec-canvas/echarts';
let App = getApp();
var proname = [];//费用项名称
var curvalue_sum = [];//当月总金额
var audvalue = [];//批复金额
let chart = null;
Page({
data: {
ec: {
onInit: function (canvas, width, height) {
//初始化echarts元素,绑定到全局变量,方便更改数据
chart = echarts.init(canvas, null, {
width: width,
height: height
});
canvas.setChart(chart);
return chart;
}
}
},
//调取费控统计接口
otherCostReport: function () {
var that = this;
wx.showLoading({
title: '加载中',
});
wx.request({
url: App.globalData.PubUrl + "/Api/OtherCost/OtherCostReport?conn=" + App.globalData.conn,
data: {
"platform": App.globalData.conn,
"Code": wx.getStorageSync('Code'),
"UserCode": wx.getStorageSync('userCode'),
"ck": wx.getStorageSync('ck'),
"time": wx.getStorageSync('cdata')
},
header: {
'content-type': 'application/json'
},
method: 'POST',
success(res) {
if (res.data.Code == 1 && res.data.WsCode == 1) {
let oc_list = res.data.Data.oc_list;
oc_list.map(ele => {
proname.push(ele.proname);
curvalue_sum.push(ele.curvalue_sum);
audvalue.push(ele.audvalue);
})
// 绘制图表
chart.setOption({
color: ['#37a2da', '#9acd34'],
tooltip: {
trigger: 'axis',
axisPointer: { // 坐标轴指示器,坐标轴触发有效
type: 'shadow' // 默认为直线,可选为:'line' | 'shadow'
}
},
legend: {
textStyle: { //图例文字的样式
color: '#000',
fontSize: 14
},
data: ['消费金额', '批复金额']
},
grid: {
left: 10,
right: 20,
bottom: 15,
top: 40,
containLabel: true
},
toolbox: {
show: true,
},
calculable: true,
//X轴数值
xAxis: [
{
type: 'value'
}
],
yAxis: [
//Y轴数据
{
type: 'category',
data: proname
}
],
//给图表设置滚轮
dataZoom: [
{
type: 'slider',
show: true,
yAxisIndex: [0],
left: '94%',
fontSize: 12,
start: 0, //数据窗口范围的起始百分比
end: 50
},
{
type: 'inside',
yAxisIndex: [0],
fontSize: 14,
start: 0,
end: 50
}
],
series: [
{
name: '消费金额',
type: 'bar',
stack: '总量',
itemStyle: {
normal: {
label: { show: true, position: 'insidetop', fontSize: 12,rich: {} }
}
},
data: curvalue_sum
},
{
name: '批复金额',
type: 'bar',
stack: '总量',
itemStyle: {
normal: {
label: { show: true, position: 'right',formatter: function (p) { return p.value > 0 ? (p.value + '\n') : ''; }, fontSize: 10,rich: {}}
} },
data: audvalue
}
]
},true)
//解决页面二次渲染重复数据问题
proname = [];//费用项名称
curvalue_sum = [];//当月总金额
audvalue = [];//批复金额
}
wx.hideLoading();
},
fail(res) {
setTimeout(function () {
wx.hideLoading();
}, 2000);
}
})
},
/**
* 生命周期函数--监听页面加载
*/
onLoad: function (options) {
},
/**
* 生命周期函数--监听页面初次渲染完成
*/
onReady() {
setTimeout(this.otherCostReport, 500);
}
});
到这一步就完成了,我是通过调用后台接口获取的动态数据然后进行图表渲染;

 浙公网安备 33010602011771号