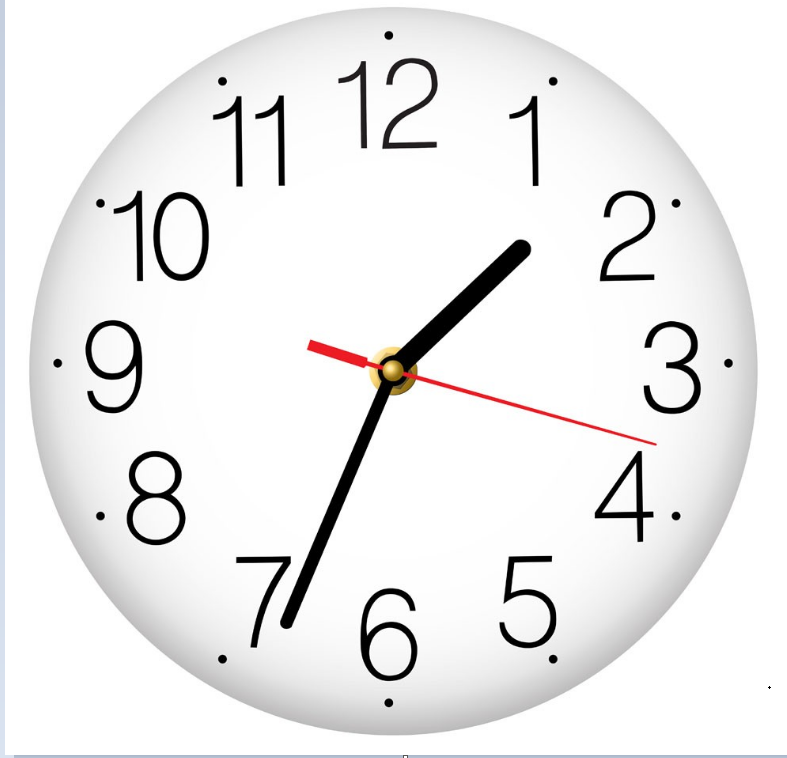
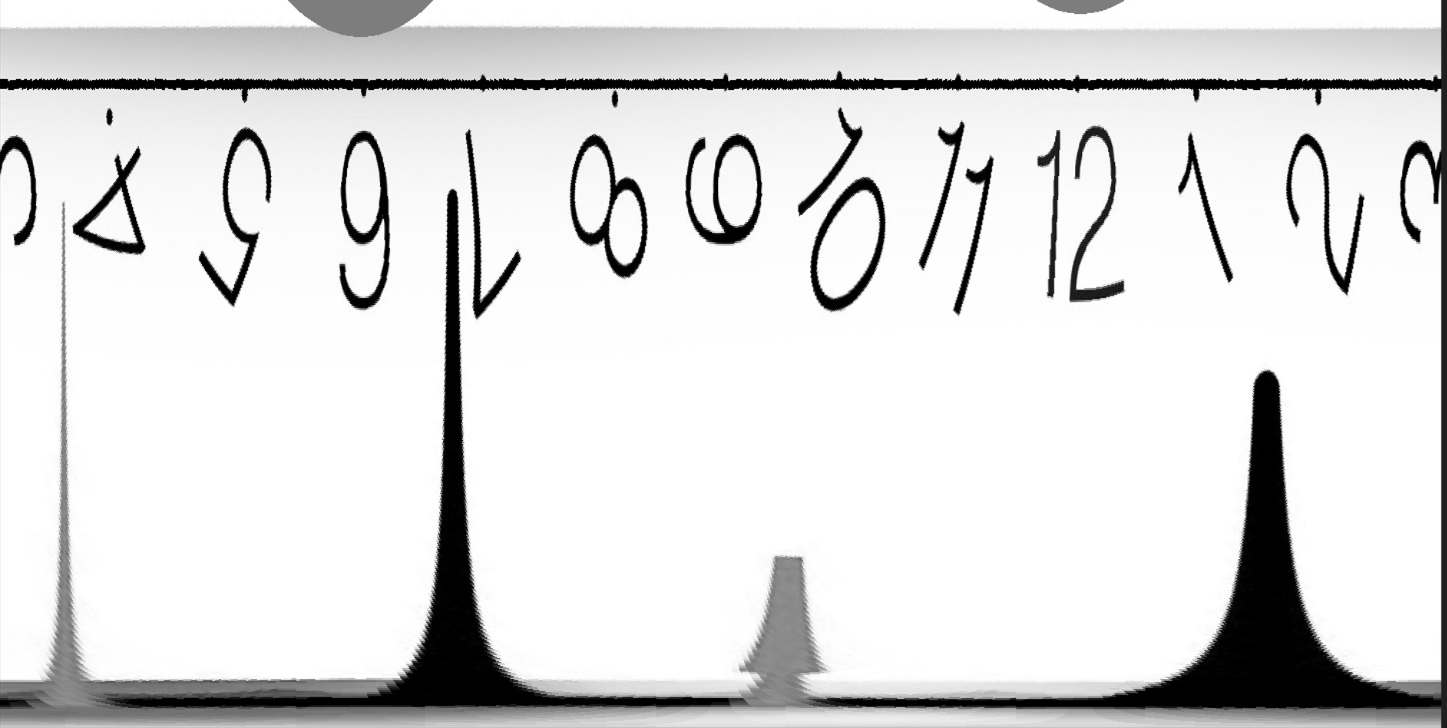
python opencv极坐标变换效果


import math
import numpy as np
import cv2


def print_hi(str):
    print('hi,'+str)


def print_3(str):
    print('hi3,'+str)


def polar2(I, center, r, theta=(0, 360), rstep=0.52, thetastep=360.0/(180*8)):
#def polar2(I, center, r, theta=(0, 360), rstep=0.5, thetastep=1.0/4):
    """
    最近邻插值方法
    """
    cx, cy = center

    minr, maxr = r
    mintheta, maxtheta = theta
    h = int((maxr-minr)/rstep)+1
    w = int((maxtheta-mintheta)/thetastep)+1
    O33 = 125*np.ones((h, w), I.dtype)
    #cv2.imshow('i',O33)
    # 极坐标变换
    r = np.linspace(minr, maxr, h)  # 生成等差数列,minr起始,maxr终止,生成h个
    r = np.tile(r, (w, 1))
    r = np.transpose(r)#转置
    theta = np.linspace(mintheta, maxtheta, w)
    theta = np.tile(theta, (h, 1))
    x1, y1 = cv2.polarToCart(r, theta, angleInDegrees=True)  # 默认是角度表示,也可以幅度表示
    # 最近邻插值
    for i in range(h):
        for j in range(w):
            px = int(round(x1[i][j])+cx) #近邻
            py = int(round(y1[i][j])+cy) #近邻
            if ((px >= 0 and px <= w-1) and (py >= 0 and py <= h-1)):
                O33[i][j] = I[py][px]
    return O33


if __name__ == "__main__":
    print_hi('极坐标')
    print('坐标11,13以0,0为中心极坐标转换')
    r = math.sqrt(math.pow(11, 2)+math.pow(13, 2))
    theta = math.atan2(13, 11)/math.pi*180
    print('r and theta value:', r, theta)

    print('坐标11,13以3,5为中心极坐标转换')
    r2 = math.sqrt(math.pow(11-3, 2)+math.pow(13-5, 2))
    theta2 = math.atan2(13-5, 11-3)/math.pi*180
    print('r2 and theta2 value:', r2, theta2)

    '''
    举例:计算:
    (0,0)、(1,0)、(2,0)、(0,1)、(1,1)、(2,1)、
    (0,2)、(1,2)、(2,2)这9个点以(1,1)为中心进行的极坐标变换。首先将坐
    标原点移动到(1,1)处,按照平移仿射矩阵计算出这9个点平移后的新坐标值,然后利
    用函数cartToPolar进行极坐标变换
    x的第1位,是第一个坐标x的值,
    y的第1位,是第一个坐标y的值,
    '''

    x = np.array([[0, 1, 2], [0, 1, 2], [0, 1, 2]], np.float64)-1
    y = np.array([[0, 0, 0], [1, 1, 1], [2, 2, 2]], np.float64)-1
    r, theta = cv2.cartToPolar(x, y, angleInDegrees=True)
    print('r:\n', r, '\ntheta:\n', theta)

    '''
    举例:已知极坐标系θor中的(30,10)、(31,10)、(30,11)、(31,11),
    其中θ是以角度表示的,问笛卡儿坐标系xoy中的哪四个坐标以(-12,15)为中心经过极
    坐标变换后得到这四个坐标

    '''
    # 将极坐标转换为笛卡儿坐标
    print("")
    angle = np.array([[30, 31], [30, 31]], np.float32)
    r = np.array([[10, 10], [11, 11]], np.float32)
    x, y = cv2.polarToCart(r, angle, angleInDegrees=True)
    print_3('scott')
    x += -12
    y += 15
    print('x:', x)
    print('y:', y)
    '''
    x: [[-3.3397446 -3.4283257]
     [-2.4737196 -2.5711575]]
    y: [[20.       20.150383]
     [20.5      20.66542 ]]
    '''
    a_1 = np.array([[1, 2], [3, 4]])
    b_1 = np.tile(a_1, (2, 3))  # 2行3列,6个(1,2,3,4)
    print(b_1)
    I = cv2.imread(r'clock2.png', cv2.IMREAD_GRAYSCALE)
    h, w = I.shape[:2]
    cx, cy = 388, 371  # 极坐标中心,图像圆的中心
    cv2.circle(I, (int(cx), int(cy)), 335, (0, 0, 0), 3) #画一个圆
    #cv2.circle(I, (int(cx), int(cy)), 386-137, (0, 0, 0), 3) #画一个圆

    O33 = polar2(I, (cx, cy), (0, 380))  # 距离的最小,最大半径
    #O33 = polar2(I, (cx, cy), (386-200, 390-23))  # 距离的最小,最大半径386-137
   # O33 = cv2.flip(O, 0)  # 第一个参数是欧(O),不是零(0),写错了就没有结果显示了
    O33 = cv2.flip(O33, 0)  #  ==0绕X轴翻转
    cv2.imwrite('jizuobiao.jpg',O33) #只能创建英文文件名
   # O33 = cv2.flip(O33, 1)  # >0绕Y轴翻转
   # O33 = cv2.flip(O33, -1)  # <0:先绕X轴翻转,再绕Y轴翻转
    print('显示原图')
    #cv2.imshow('I', I)
    print('显示输出')
    cv2.imshow('O33', O33)
    cv2.waitKey(0)
    cv2.destroyAllWindows()
欢迎讨论,相互学习。
cdtxw@foxmail.com


 浙公网安备 33010602011771号