随机森林分类(Random Forest Classification)
其实,之前就接触过随机森林,但仅仅是用来做分类和回归。最近,因为要实现一个idea,想到用随机森林做ensemble learning才具体的来看其理论知识。随机森林主要是用到决策树的理论,也就是用决策树来对特征进行选择。而在特征选择的过程中用到的是熵的概念,其主要实现算法有ID3和C4.5.下面我们先来看看决策树。
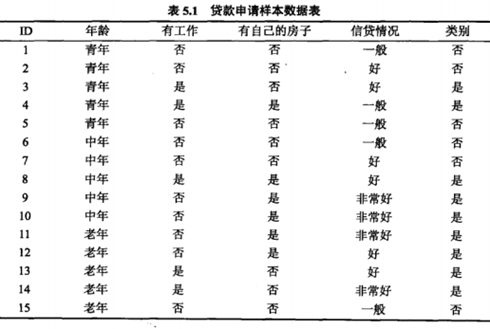
下面我们用一个例子具体的来说明
我们要选取一个最好的特征来判断是否贷款,上面给出了年龄,工作,房子,信贷四种特征。如果一种特征具有更好的分类能力,或者说,按照这一特征将训练数据集分割成子集,使得各个子集是当前条件下最好的分类,我们就应该选择这个特征。对于这个问题,直观上是否有房子应该是最好的特征。但这也仅仅是从直观上判断,具体上来讲哪个特征最好了,这里我们引入一个概念-信息增益。
假设X是一个取值无限的离散随机变量,其概率分布为:
由于熵只依赖X的分布,而与X的取值无关。所以,我们又把熵定义为:
![]()
假设我们有两个随机变量x,y(generally,X denote the feature vectors,and Y denote labels)。其联合概率分布为:
这里,假如给定一个X,要我们准确的判断其所属类别,也就是要准确的判断Y。很自然的,我们需要求解给定X下的条件熵:
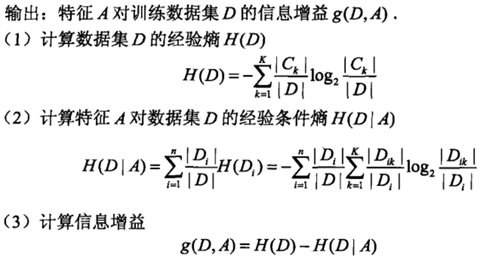
假设,特征A 对训练集D的信息增益为![]() ,定义为集合D 的经验熵H(D)与特征A给定条件下D的经验熵H(D|A)之差,那么我们定义信息增益如下:
,定义为集合D 的经验熵H(D)与特征A给定条件下D的经验熵H(D|A)之差,那么我们定义信息增益如下:
一般的,我们把熵H(Y)与条件熵H(Y|X)只差定义为互信息,决策树中的信息增益就是训练数据集中的类与特征的互信息。下面给出计算信息增益的方法:
如果我们以信息增益为划分训练数据集的特征,存在于选择取值较多的特征的问题。这里我们使用信息增益比(information gain ratio),可以对这一问题进行校正。这是特征选择的另一准则。
下面来介绍一下ID3算法,该算法的核心就是不断的利用信息增益准则选择特征,最终达到分类的目的。
C4.5算法其实就是在ID3算法上做了一点的改动,把特征选择的方法改为用信息增益比来计算,而不用ID3中的计算信息增益的方法。其算法流程和ID3差不多,这里就不介绍了。下面来简单的谈一下决策树的剪枝问题,由于决策树是严格的按照一定的规则进行计算,过多的考虑了训练样本的正确性,所以这导致其容易过拟合。所以这里引入剪枝的概念,通过优化损失函数,减少模型的复杂性。具体算法过程可以看课本P-66~P-67页。
下面我给出C4.5的matlab代码,改代码转自http://blog.csdn.net/ice110956/article/details/10049149。
1: function D = C4_5(train_features, train_targets, inc_node,test_features)
2: %http://blog.csdn.net/ice110956/article/details/10049149
3: % 1.train_features,为训练集; train_targets,为训练集标签;
4: % inc_node为防止过拟合参数,表示样本数小于一定阈值结束递归,可设置为5-10;test_features为测试集。
5: % 2.取消离散变量,上面说了,是因为我不知道如何处理Miss value的问题,至于影响,应该就是连贪心也算不上了吧,应该是一个理论上还过得去的处理方法。
6: % 3.图怎么画?介绍几个画图软件:http://www.cnblogs.com/damonlan/archive/2012/03/29/2410301.html
7: % 决策树扩展篇:http://blog.csdn.net/ice110956/article/details/29175215
8:
9: [Ni, M] = size(train_features); %输入向量为NI*M的矩阵,其中M表示训练样本个数,Ni为特征维数维数
10: inc_node = inc_node*M/100;
11:
12: disp('Building tree')
13: tree = make_tree(train_features, train_targets, inc_node);
14:
15: %Make the decision region according to the tree %根据产生的数产生决策域
16: disp('Building decision surface using the tree')
17: [n,m]=size(test_features);
18: targets = use_tree(test_features, 1:m, tree, unique(train_targets)); %target里包含了对应的测试样本分类所得的类别数
19:
20: D = targets;
21: %END
22:
23: function targets = use_tree(features, indices, tree, Uc) %target里包含了对应的测试样本分类所得的类别
24:
25:
26: targets = zeros(1, size(features,2)); %1*M的向量
27:
28: if (tree.dim == 0)
29: %Reached the end of the tree
30: targets(indices) = tree.child;
31: return %child里面包含了类别信息,indeces包含了测试样本中当前测试的样本索引
32: end
33:
34:
35: dim = tree.dim; %当前节点的特征参数
36: dims= 1:size(features,1); %dims为1-特征维数的向量
37:
38: %Discrete feature
39: in = indices(find(features(dim, indices) <= tree.split_loc)); %in为左子树在原矩阵的index
40: targets = targets + use_tree(features(dims, :), in, tree.child_1, Uc);
41:
42: in = indices(find(features(dim, indices) > tree.split_loc)); %in为右子树在原矩阵的index
43: targets = targets + use_tree(features(dims, :), in, tree.child_2, Uc);
44: return
45:
46:
47: function tree = make_tree(features, targets, inc_node)
48:
49: [Ni, L] = size(features);
50: Uc = unique(targets); %UC表示类别数
51: tree.dim = 0; %树的维度为0
52: %tree.child(1:maxNbin) = zeros(1,maxNbin);
53:
54: if isempty(features), %如果特征为空,退出
55: return
56: end
57:
58: %When to stop: If the dimension is one or the number of examples is small
59: if ((inc_node > L) | (L == 1) | (length(Uc) == 1)), %剩余训练集只剩一个,或太小,小于inc_node,或只剩一类,退出
60: H = hist(targets, length(Uc)); %返回类别数的直方图
61: [m, largest] = max(H); %更大的一类,m为大的值,即个数,largest为位置,即类别的位置
62: tree.child = Uc(largest); %直接返回其中更大的一类作为其类别
63: return
64: end
65:
66: %Compute the node's I
67: %计算现有的信息量(经验熵)
68: for i = 1:length(Uc),
69: Pnode(i) = length(find(targets == Uc(i))) / L;
70: end
71: Inode = -sum(Pnode.*log(Pnode)/log(2));
72:
73: %For each dimension, compute the gain ratio impurity
74: %This is done separately for discrete and continuous features
75: delta_Ib = zeros(1, Ni);
76: S=[];
77: for i = 1:Ni,
78: data = features(i,:);
79: temp=unique(data);
80: P = zeros(length(Uc), 2);
81:
82: %Sort the features
83: [sorted_data, indices] = sort(data);
84: sorted_targets = targets(indices);
85: %结果为排序后的特征和类别
86: %Calculate the information for each possible split
87: I = zeros(1, L-1);
88:
89: for j = 1:L-1,
90: for k =1:length(Uc),
91: P(k,1) = length(find(sorted_targets(1:j) == Uc(k))); %p(1,1):小于第j个样本的b的个数,p(1,2):大于第j个样本的b的个数。
92: P(k,2) = length(find(sorted_targets(j+1:end) == Uc(k))); %p(2,1):小于第j个样本的g的个数,p(1,2):大于第j个样本的g的个数。
93: end
94: Ps = sum(P)/L; %两个子树的权重
95: temp1=[P(:,1)];
96: temp2=[P(:,2)];
97: fo=[Info(temp1),Info(temp2)];
98: %info = sum(-P.*log(eps+P)/log(2)); %两个子树的I
99: I(j) = Inode - sum(fo.*Ps);%信息增益
100: end
101: [delta_Ib(i), s] = max(I);
102: S=[S,s];
103:
104: end
105:
106: %Find the dimension minimizing delta_Ib
107: %找到最大的划分方法
108: [m, dim] = max(delta_Ib); %第dim维特征最好,最大信息增益为m
109:
110: dims = 1:Ni;
111: tree.dim = dim;
112:
113: %Split along the 'dim' dimension
114: %分裂树
115: %Continuous feature
116: [sorted_data, indices] = sort(features(dim,:));
117: %tree.split_loc = split_loc(dim);
118: %disp(tree.split_loc);
119: S(dim)
120: indices1=indices(1:S(dim))
121: indices2=indices(S(dim)+1:end)
122: tree.split_loc=sorted_data(S(dim))
123: tree.child_1 = make_tree(features(dims, indices1), targets(indices1), inc_node);
124: tree.child_2 = make_tree(features(dims, indices2), targets(indices2), inc_node);
125: %D = C4_5_new(train_features, train_targets, inc_node);
其实代码不难,下面我给出我的理解。
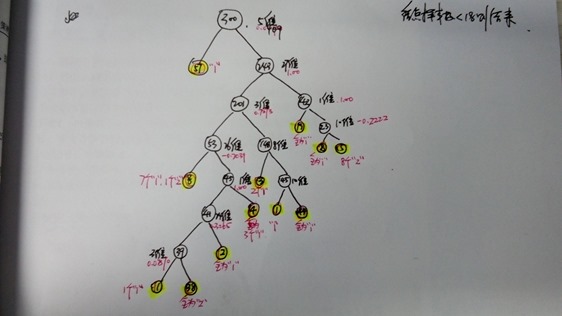
Here we split the data into two sets,with 300 training samples and 51 testing samples,each data is a 34-dimensional vector. Here, each dimension can be regarded as a variable,with respect to a kind of “feature”.
在这个决策树中,对每个节点我们计算它的信息增益比,如果信息增益比小于某个阈值。或者,节点包含的样本数小于18(自己设定),则结束递归。从上图中可以看出,从根节点出发(这个节点包含300个样本),第5维特征最好,所以用这个特征进行划分。得到左子树(57个样本全为“1”),右子树(包含243个样本)。所以左子树结束递归,接着计算右子树的特征,第27维特征最好。一直循环….
最后我们得到这样的一个决策树,除了叶节点,中间节点都包含一个最佳分类的特征,和这个特征对应的特征值。每个叶节点包含一定数量的样本,叶节点的类别规定为多数样本对应的类别。得到了这样的一个决策树后,我们就可以对测试样本进行分类了。使用中间节点记录的特征对测试样本进行划分,直到测试样本划分到每个叶节点中。叶节点中样本的类别就是该测试样本的类别了。


