使用ELK+Filebeat的聚合日志的实践
一、前言
近期在实践微服务下,如何实现日志的聚合与可视化的功能。当微服务模块的增多,使用文本记录系统的日志,在遇到问题时对日志进行查找和定位都是比较困难,所以借鉴当前比较流行的日志聚合框架ELK+Filebeat完成该功能。该日志聚合的各组件实现原理暂不深入了解,先安装各个组件,然后配置各组件的配置文件和参数信息,运行组件,完成日志的聚合和可视化查看。在完成上述步骤的过程中,因没有具体学习,所以踩坑比较多,所以记录在使用过程中踩过的坑。
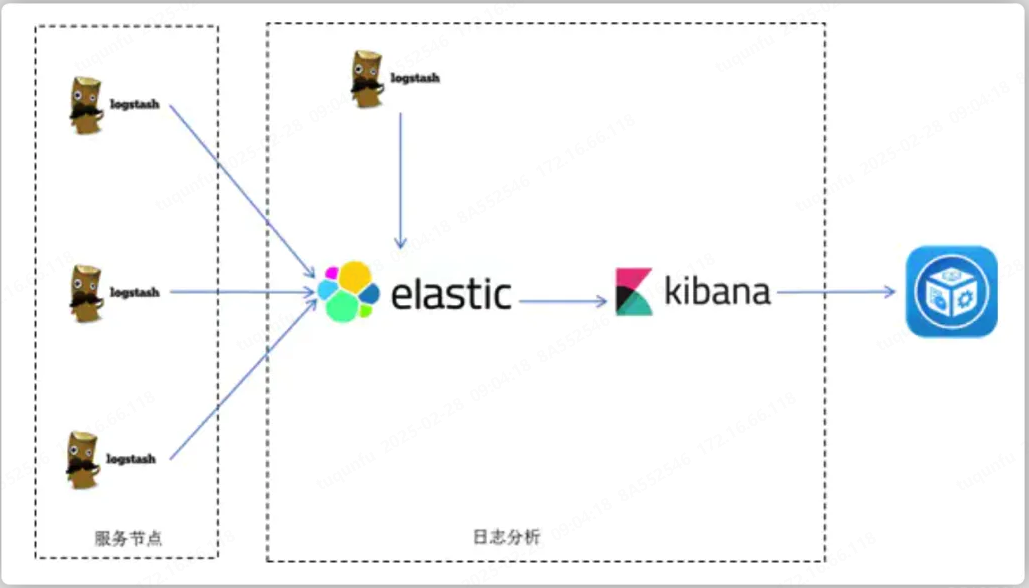
ELK是代指Elasticsearch、Logstash、Kibana三个开源框架缩写。Elasticsearch是开源分布式搜索引擎,提供存储、分析、搜索功能。特点:分布式、基于reasful风格、支持海量高并发的准实时搜索场景、稳定、可靠、快速、使用方便等,主要作用于接收搜集的海量结构化日志数据,并提供给kibana查询分析,全文搜索,结构化搜索以及分析;Logstash是开源日志搜集、分析、过滤框架,支持多种数据输入输出方式,主要作用于收集日志,对日志进行过滤形成结构化数据,并转发到elasticsearch中;Kibana开源日志报表系统,对elasticsearch以及logstash有良好的web页面支持,主要作用于对elasticsearch提供的数据进行分析展示。
ELK的演化,ELK在使用的过程中,根据实际业务和性能的要求不断地演化,ELK(Elasticsearch、Logstash、Kibana)=>ELK+各种Beats,=>ELK+Beats+中间件进行缓存(Redis和Kafka)。
1、ELK的模式是提供了一个集中式、独立的、搜集管理各个服务和服务器上的日志信息,集中管理,并提供良好的UI界面进行数据展示,处理分析,基于企业的负责应用和多样的日志信息,不易于归档和监控的需求下产生的。
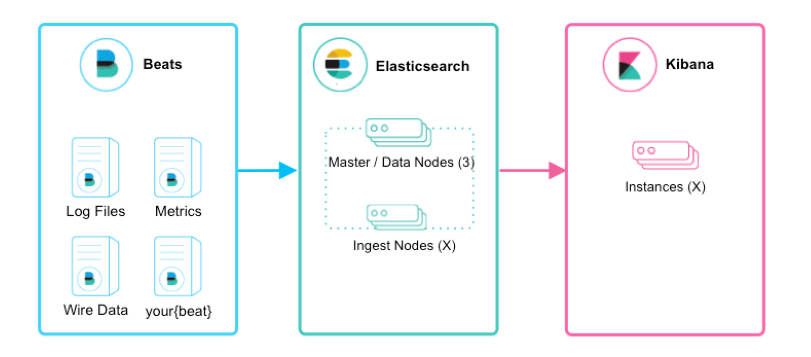
2、ELK+各种Beats则是Logstash要部署运行在各个服务主机上,消耗大量的服务器资源,所以基于ELK的框架引入了轻量级日志采集框架Beats,Beats主要有Packetbeat(用于搜集网络流量数据)、Heartbeat(用于运行时间监控)、Filebeat(用于搜集文件数据)、Winlogbeat(用于搜集winodws事件数据)、Metricbeat(用于指标数据)、Auditbeat(用于审计数据)等。
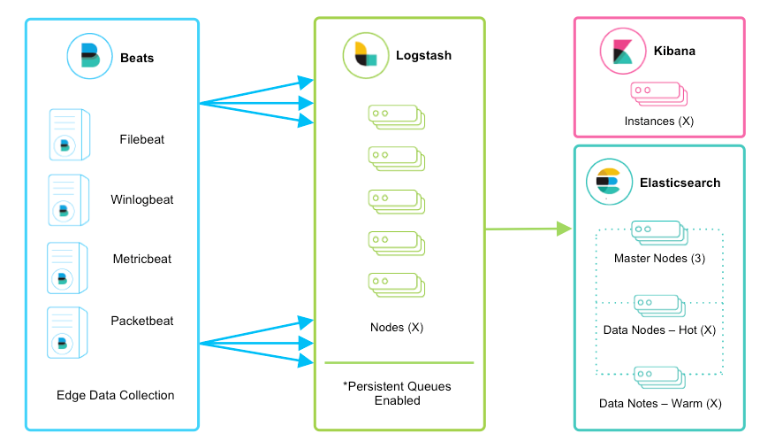
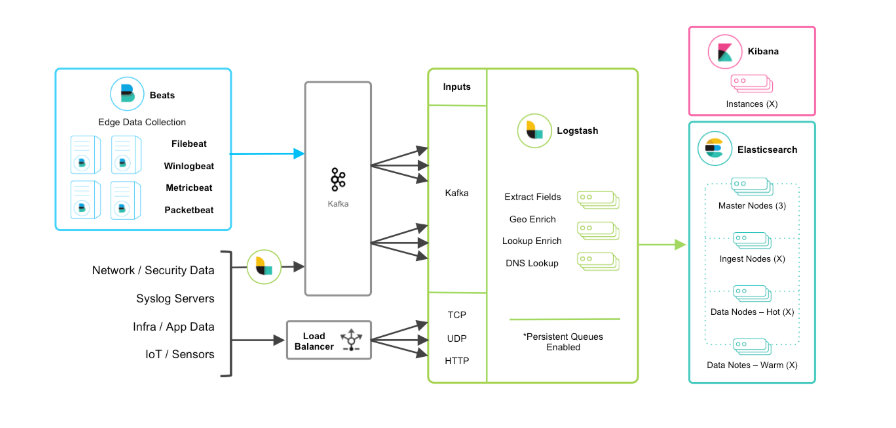
3、ELK+Beats+中间件进行缓存(Redis和Kafka)则是基于通过各个logs汇集Logstash,而独立或者集群的Logstash无法满足高并发下日志,所以可以添加中间件进行日志缓存处理,中间件则可以选择Redis或者Kafka等。
二、实践
第一步:安装各个组件,可以通过下载安装包解压安装,使用在线下载安装,或者Docker方式便捷的创建各个组件。在安装组件的时候必须注意版本的一致性,否则在组件连接的时候出现各种莫名的错误信息!!
- wget https://artifacts.elastic.co/downloads/beats/filebeat/filebeat-7.17.0-linux-x86_64.tar.gz
- tar -xzf filebeat-7.17.0-linux-x86_64.tar.gz
第二步:在完成安装各个组件,对各个组件进行配置文件的修改,如logstash.conf、filebeat.yml等。在配置文件中设置IP、Port、采集日志的文件位置、采集方式等内容,必须注意在配置过程中确保文件格式的正确、没有错误,否则无法运行各个组件,可以通过查看错误日志找出问题。

###################### Filebeat Configuration Example #########################

# This file is an example configuration file highlighting only the most common
# options. The filebeat.reference.yml file from the same directory contains all the
# supported options with more comments. You can use it as a reference.
#
# You can find the full configuration reference here:
# https://www.elastic.co/guide/en/beats/filebeat/index.html

# For more available modules and options, please see the filebeat.reference.yml sample
# configuration file.

# ============================== Filebeat inputs ===============================

filebeat.inputs:

# Each - is an input. Most options can be set at the input level, so
# you can use different inputs for various configurations.
# Below are the input specific configurations.

# filestream is an input for collecting log messages from files.
- type: log

  # Unique ID among all inputs, an ID is required.
  id: xxx

  # Change to true to enable this input configuration.
  enabled: true

  # Paths that should be crawled and fetched. Glob based paths.
  paths:
    - /home/xxx/logs/*.log
    #- c:\programdata\elasticsearch\logs\*
  multiline:
     pattern: '^\s*(\d{4}|\d{2})\-(\d{2}|[a-zA-Z]{3})\-(\d{2}|\d{4})'   # 指定匹配的表达式
     negate: true                                                         # 是否匹配到
     match: after                                                         # 合并到上一行的末尾
     max_lines: 1000                                                    # 最大的行数
     timeout: 30s                                                        # 如果在规定的时候没有新的日志事件就不等待后面的日志
  # Exclude lines. A list of regular expressions to match. It drops the lines that are
  # matching any regular expression from the list.
  #exclude_lines: ['^DBG']

  # Include lines. A list of regular expressions to match. It exports the lines that are
  # matching any regular expression from the list.
  #include_lines: ['^ERR', '^WARN']

  # Exclude files. A list of regular expressions to match. Filebeat drops the files that
  # are matching any regular expression from the list. By default, no files are dropped.
  #prospector.scanner.exclude_files: ['.gz$']

  # Optional additional fields. These fields can be freely picked
  # to add additional information to the crawled log files for filtering
  fields:
    application: gs-xxx  # 自定义字段,提供给 Logstash 用于区分日志来源
  fields_under_root: true  # 开启自定义字段
  parsers:
    - multiline:
        type: pattern
        pattern: '^\s*(\d{4}|\d{2})\-(\d{2}|[a-zA-Z]{3})\-(\d{2}|\d{4})'
        match: after
        negate: true
        max_lines: 1000
        timeout: 30s

# ============================== Filebeat modules ==============================

filebeat.config.modules:
  # Glob pattern for configuration loading
  path: ${path.config}/modules.d/*.yml

  # Set to true to enable config reloading
  reload.enabled: true

  # Period on which files under path should be checked for changes
  #reload.period: 10s

# ======================= Elasticsearch template setting =======================

setup.template.settings:
  index.number_of_shards: 1
  index.codec: best_compression
  #_source.enabled: false


# ================================== General ===================================

# The name of the shipper that publishes the network data. It can be used to group
# all the transactions sent by a single shipper in the web interface.
#name:

# The tags of the shipper are included in their own field with each
# transaction published.
#tags: ["service-X", "web-tier"]
tags: ["gs-xxx"]

# Optional fields that you can specify to add additional information to the
# output.
#fields:
#  env: staging

# ================================= Dashboards =================================
# These settings control loading the sample dashboards to the Kibana index. Loading
# the dashboards is disabled by default and can be enabled either by setting the
# options here or by using the `setup` command.
#setup.dashboards.enabled: false

# The URL from where to download the dashboards archive. By default this URL
# has a value which is computed based on the Beat name and version. For released
# versions, this URL points to the dashboard archive on the artifacts.elastic.co
# website.
#setup.dashboards.url:

# =================================== Kibana ===================================

# Starting with Beats version 6.0.0, the dashboards are loaded via the Kibana API.
# This requires a Kibana endpoint configuration.
setup.kibana:

  # Kibana Host
  # Scheme and port can be left out and will be set to the default (http and 5601)
  # In case you specify and additional path, the scheme is required: http://localhost:5601/path
  # IPv6 addresses should always be defined as: https://[2001:db8::1]:5601
  #host: "localhost:5601"

  # Kibana Space ID
  # ID of the Kibana Space into which the dashboards should be loaded. By default,
  # the Default Space will be used.
  #space.id:

# =============================== Elastic Cloud ================================

# These settings simplify using Filebeat with the Elastic Cloud (https://cloud.elastic.co/).

# The cloud.id setting overwrites the `output.elasticsearch.hosts` and
# `setup.kibana.host` options.
# You can find the `cloud.id` in the Elastic Cloud web UI.
#cloud.id:

# The cloud.auth setting overwrites the `output.elasticsearch.username` and
# `output.elasticsearch.password` settings. The format is `<user>:<pass>`.
#cloud.auth:

# ================================== Outputs ===================================

# Configure what output to use when sending the data collected by the beat.

# ---------------------------- Elasticsearch Output ----------------------------
#output.elasticsearch:
  # Array of hosts to connect to.
  #hosts: ["127.0.0.0:9200"]

  # Protocol - either `http` (default) or `https`.
  #protocol: "https"

  # Authentication credentials - either API key or username/password.
  #api_key: "id:api_key"
  #username: "elastic"
  #password: "changeme"

# ------------------------------ Logstash Output -------------------------------
output.logstash:
  # The Logstash hosts
  hosts: ["127.0.0.1:5044"]
  fields:
    application: gs-mes  # 自定义字段,提供给 Logstash 用于区分日志来源

  # Optional SSL. By default is off.
  # List of root certificates for HTTPS server verifications
  #ssl.certificate_authorities: ["/etc/pki/root/ca.pem"]

  # Certificate for SSL client authentication
  #ssl.certificate: "/etc/pki/client/cert.pem"

  # Client Certificate Key
  #ssl.key: "/etc/pki/client/cert.key"

# ================================= Processors =================================
processors:
  - add_host_metadata:
      when.not.contains.tags: forwarded
  - add_cloud_metadata: ~
  - add_docker_metadata: ~
  - add_kubernetes_metadata: ~

# ================================== Logging ===================================

# Sets log level. The default log level is info.
# Available log levels are: error, warning, info, debug
#logging.level: debug

# At debug level, you can selectively enable logging only for some components.
# To enable all selectors use ["*"]. Examples of other selectors are "beat",
# "publisher", "service".
#logging.selectors: ["*"]

# ============================= X-Pack Monitoring ==============================
# Filebeat can export internal metrics to a central Elasticsearch monitoring
# cluster.  This requires xpack monitoring to be enabled in Elasticsearch.  The
# reporting is disabled by default.

# Set to true to enable the monitoring reporter.
#monitoring.enabled: false

# Sets the UUID of the Elasticsearch cluster under which monitoring data for this
# Filebeat instance will appear in the Stack Monitoring UI. If output.elasticsearch
# is enabled, the UUID is derived from the Elasticsearch cluster referenced by output.elasticsearch.
#monitoring.cluster_uuid:

# Uncomment to send the metrics to Elasticsearch. Most settings from the
# Elasticsearch output are accepted here as well.
# Note that the settings should point to your Elasticsearch *monitoring* cluster.
# Any setting that is not set is automatically inherited from the Elasticsearch
# output configuration, so if you have the Elasticsearch output configured such
# that it is pointing to your Elasticsearch monitoring cluster, you can simply
# uncomment the following line.
#monitoring.elasticsearch:

# ============================== Instrumentation ===============================

# Instrumentation support for the filebeat.
#instrumentation:
    # Set to true to enable instrumentation of filebeat.
    #enabled: false

    # Environment in which filebeat is running on (eg: staging, production, etc.)
    #environment: ""

    # APM Server hosts to report instrumentation results to.
    #hosts:
    #  - http://localhost:8200

    # API Key for the APM Server(s).
    # If api_key is set then secret_token will be ignored.
    #api_key:

    # Secret token for the APM Server(s).
    #secret_token:


# ================================= Migration ==================================

# This allows to enable 6.7 migration aliases
#migration.6_to_7.enabled: true
# Sample Logstash configuration for creating a simple
# Beats -> Logstash -> Elasticsearch pipeline.

input {
  beats {
    add_field => {"beatType" => "gs-xxx"}
    port => 5044
  }
  beats {
    add_field => {"beatType" => "gs-xxx"}
    port => "5043"
  }
}

filter {
grok {
   match => {
      "message" => "%{TIMESTAMP_ISO8601:createTime}%{SPACE}\[%{DATA:threadName}\]%{SPACE}%{LOGLEVEL:LEVEL}%{SPACE}%{JAVACLASS:javaClass}#(?<methodName>[a-zA-Z_]+):%{INT:linenumber}%{SPACE}-%{GREEDYDATA:msg}"
    }
 }
mutate {
   remove_field => ["log","tags", "input", "agent", "host", "ecs", "@version"]
 }
}
output {

if [beatType] == "gs-xxx" {
    elasticsearch {
      hosts => ["127.0.0.1:9200"]
      index => "gs-mes-%{+YYYY.MM.dd}"
    }
  }
  if [beatType] == "gs-xxx" {
    elasticsearch {
      hosts => ["127.0.0.1:9200"]
      index => "gs-wms-%{+YYYY.MM.dd}"
    }
  }

  #elasticsearch {
    #hosts => ["127.0.0.1:9200"]
    #index => "%{[index_name]}"
    #user => "elastic"
    #password => "changeme"
  #}
}
Filebeat.yml和Logstash.config文件,通过配置ELK三者的IP、PORT完成关联,实现日志的采集收集、过滤处理、存储分析、可视化呈现的过程。在配置过程中注意一些配置项的格式比如multiline多行处理的参数设置、Logstash Output的IP和格式问题(是否空格)、tags和fields的设置;在Logstash中关键input、filter、 output的配置是否正确、比如filter中各种过滤的插件是否安装(bin/logstash-plugin list)等。所以主要工作还是安装完成之后对各个组件的配置文件、配置项、参数的设置达到预期效果。
第三步:运行各个组件,然后联调各个组件是否关联,主要通过修改配置项、运行命令运行程序,检查日志是否采集成功。下述主要包括各个组件的运行和检查命令,环境是CentOS,其命令运行都基于已经安装软件的BIN文件或者程序所在目录中执行。
./logstash-plugin list   #获取插件列表,检查过滤等各种插件是否安装
./logstash -f /home/admin/logstash-7.17.5/config/logstash.conf #运行程序
./logstash -e 'input { stdin {} } output { { stdout {} } }' #验证程序是否运行,在控制台输入输出

sudo ./filebeat -e -c filebeat.yml #指定配置文件运行程序
firewall-cmd --zone=public --add-port=5044/tcp --permanent #防火墙开启端口
firewall-cmd --reload #重启
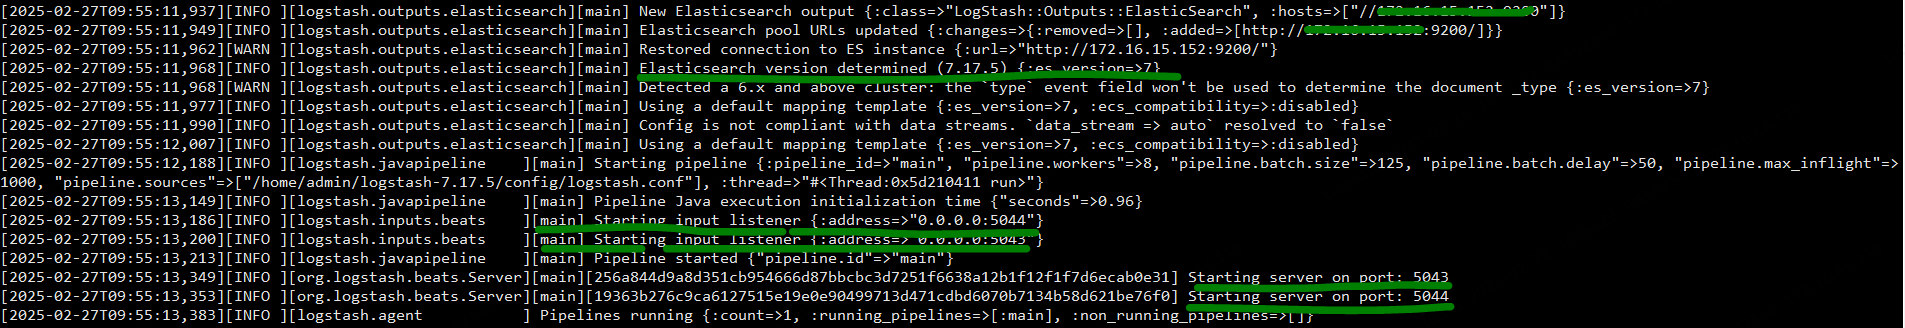
第四步:查看各个组件运行输出的日志信息,检查是否运行成功,关联成功了。

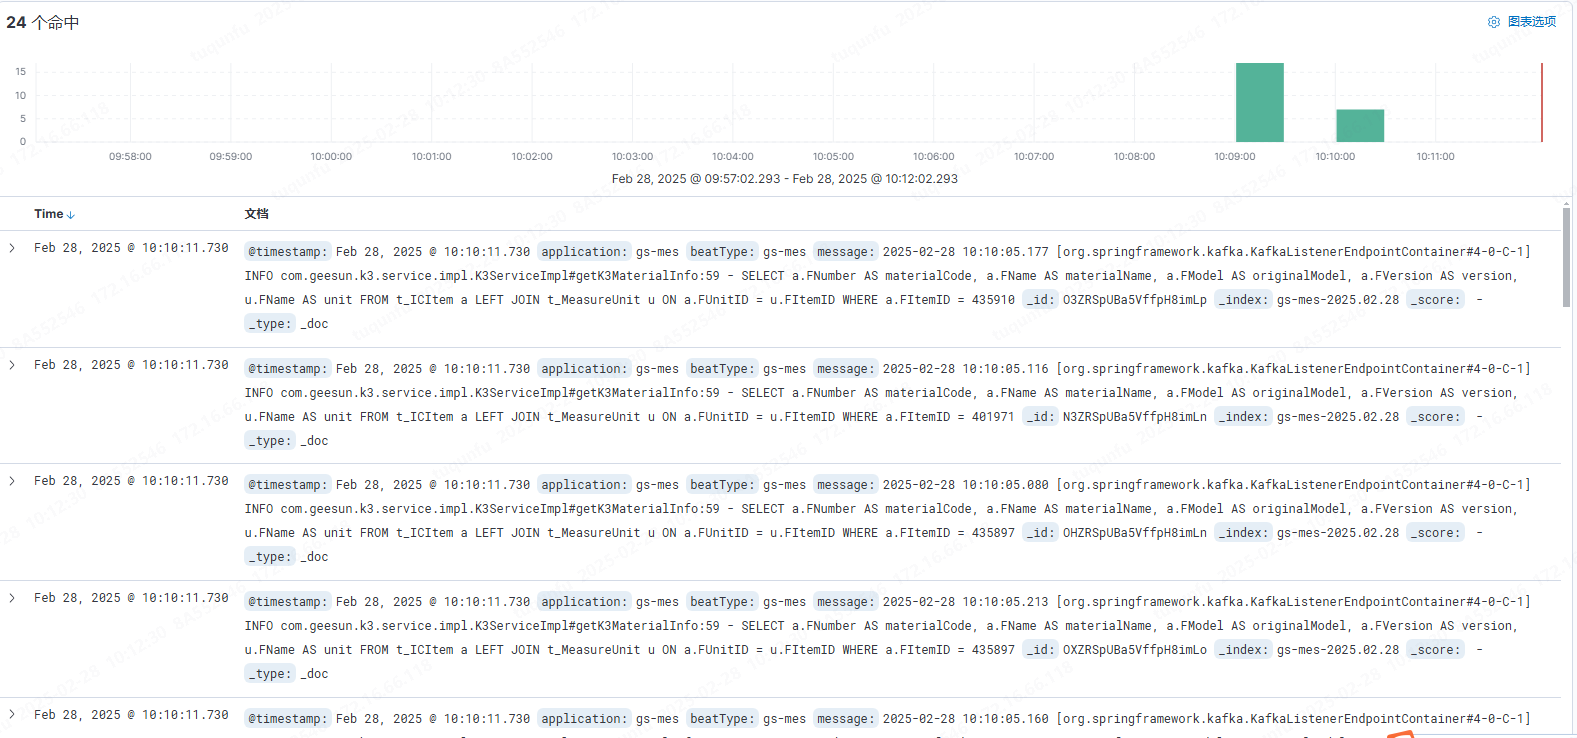
第五步:在可视化中依据采集的数据,创建索引模式,然后在数据查询看板中,通过创建索引查看数据,筛选数据。
第六步、在centos环境中将上述两个组件设置成系统服务(后台服务)和自动重启,在systemd文件夹中创建service文件,执行相关服务加载、启动命令。
[Unit]
Description=Logstash
Documentation=https://www.elastic.co/guide/en/logstash/current/index.html
Wants=network-online.target
After=network-online.target

[Service]
ExecStart=/home/admin/logstash-7.17.5/bin/logstash -f /home/admin/logstash-7.17.5/config/logstash.conf
Restart=always
User=root

[Install]
WantedBy=multi-user.target
注意:服务重启失败的原因查找:systemctl执行脚本时需要知道脚本的解释器;目标目录的执行权限不够(sudo);要执行的脚本编码格式不正确;定义的workingdirectory路径有问题。如果上述原因都排除则查看由于SELinux 开启安全模式(SELinux 主要作用就是最大限度地减小系统中服务进程可访问的资源)导致不能设置开机自启动service。
[root@SHD-SVR-V3 bin]# getenforce   #查看selinux状态
Enforcing

[root@SHD-SVR-V3 bin]# setenforce 0  #临时关闭selinux

[root@SHD-SVR-V3 bin]# getenforce
Permissive


[root@SHD-SVR-V3 bin]# vi /etc/selinux/config

SELINUX=enforcing 修改为  SELINUX=disabled
#重启服务器生效
三、总结
在搭建ELK的过程中,主要遇到困难包括①各个组件版本不一致导致的关联不上;②配置文件的格式或者配置项错误导致的运行问题;③各组件PORT没有在防火墙开启的通讯问题;④配置项不生效的问题(没有开启生效或者插件未安装);⑤采集数据格式问题,没有使用过滤器或者数据结构化处理导致;上述问题都是在实践过程中遇到坑。一般的搭建ELK,采集日志的过程比较简单,要达到深入的使用或者预期的目标则待研究各个组件的原理性的内容。总之,ELK的日志采集、处理、分析、可视化的功能强大待深入的研究和实践。没有不好使用的工具,只是没有研究到位。


【推荐】国内首个AI IDE,深度理解中文开发场景,立即下载体验Trae
【推荐】编程新体验,更懂你的AI,立即体验豆包MarsCode编程助手
【推荐】抖音旗下AI助手豆包,你的智能百科全书,全免费不限次数
【推荐】轻量又高性能的 SSH 工具 IShell:AI 加持,快人一步
· 【自荐】一款简洁、开源的在线白板工具 Drawnix
· 没有Manus邀请码?试试免邀请码的MGX或者开源的OpenManus吧
· 无需6万激活码!GitHub神秘组织3小时极速复刻Manus,手把手教你使用OpenManus搭建本
· C#/.NET/.NET Core优秀项目和框架2025年2月简报
· DeepSeek在M芯片Mac上本地化部署