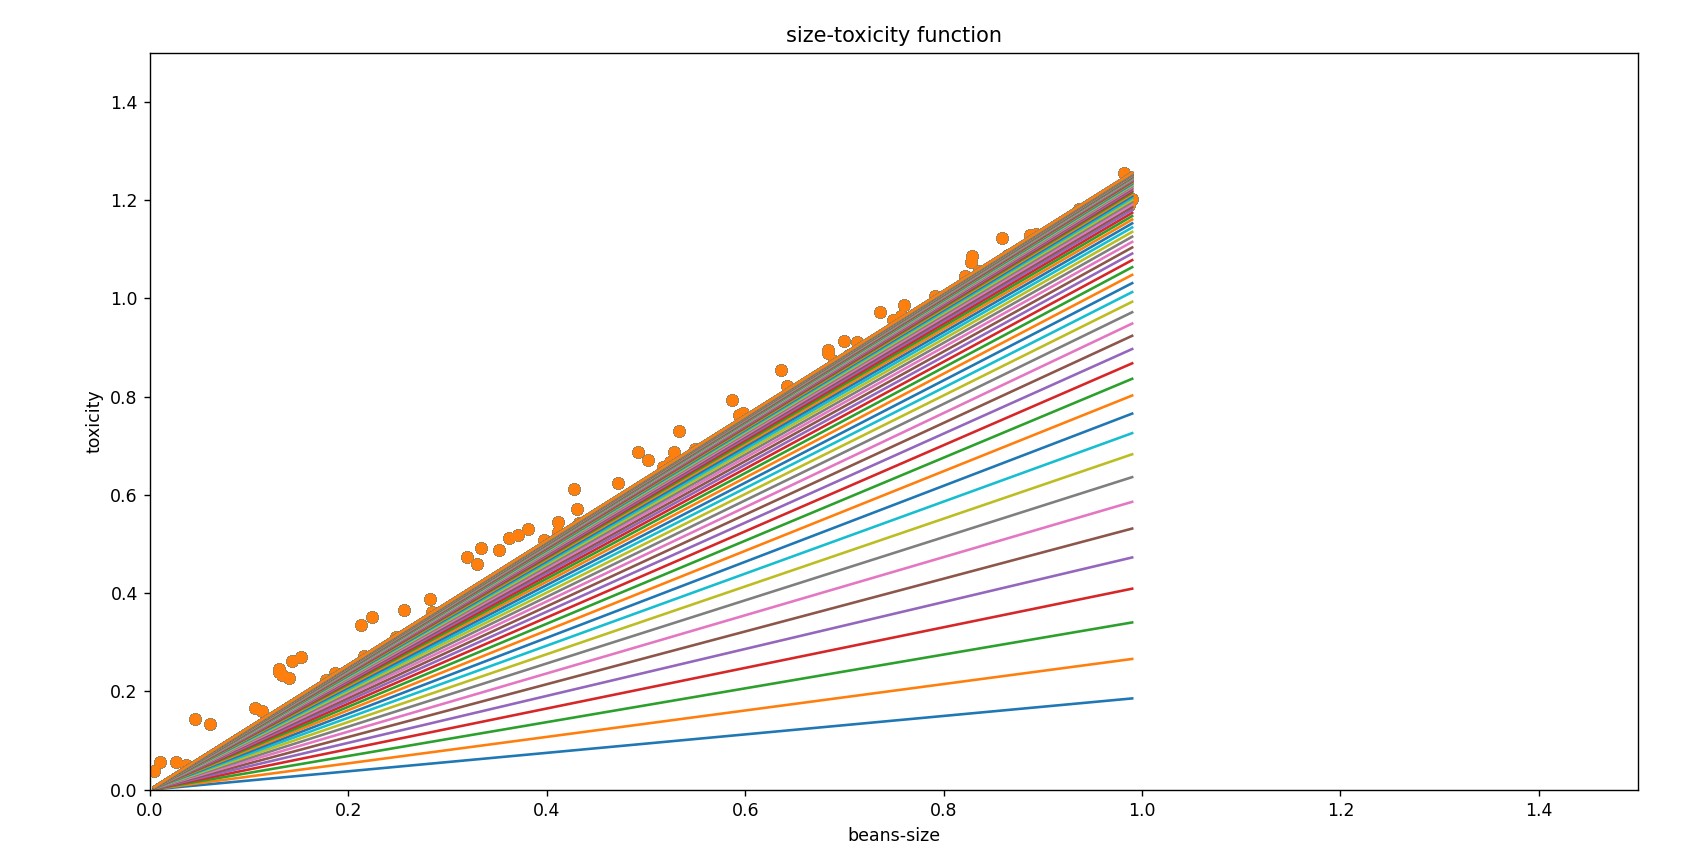
w,b梯度下降算法,一维曲线拟合

w,b 梯度下降算法
# author: Roy.G
import dataset
import numpy as np
import matplotlib.pyplot as plt
from mpl_toolkits.mplot3d import Axes3D as a3d
xs,ys=dataset.get_beans(100)

'''
w,b 图形展示
plt.scatter(xs, ys)
plt.title("size-toxicity function")
plt.xlabel("beans-size")
plt.ylabel("toxicity")
plt.xlim(0,1.5)
plt.ylim(0, 1.5)
w=0.1
b=0.1
y_pre=w*xs+b
plt.plot(xs,y_pre)
plt.show()
m=100
ws=np.arange(-1,2,0.01)
bs=np.arange(-2,2,0.01)

fg=plt.figure()
ax=a3d(fg)
for b in bs:
    es = []
    for w in ws:
        y_pre=w*xs+b
        e=np.sum((ys-y_pre)**2)*(1/m)
        es.append(e)
    ax.plot(ws,es,b,zdir='y')
    ax.set_zlim(2)
    ax.set_xlim(2)
    ax.set_ylim(2)
plt.show()
'''
# w,b梯度下降
b=0.1
w=0.1
for i in range(500):
    for i in range(100):
        x=xs[i]
        y=ys[i]
        dw=2*(x**2)*w+2*x*b-2*x*y
        db=2*b+2*w*x-2*y
        alpha=0.01
        w=w-alpha*dw
        b = b - alpha * db
        y_pre = w * xs + b
    plt.clf()
    plt.scatter(xs, ys)
    plt.title("size-toxicity function")
    plt.xlabel("beans-size")
    plt.ylabel("toxicity")
    plt.xlim(0,1.5)
    plt.ylim(0,1.5)
    plt.plot(xs,y_pre)
    plt.pause(0.001)


