


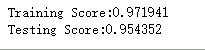
import numpy as np
import matplotlib.pyplot as plt

from sklearn import neighbors, datasets
from sklearn.model_selection import train_test_split

def create_regression_data(n):
    '''
    创建回归模型使用的数据集
    '''
    X =5 * np.random.rand(n, 1)
    y = np.sin(X).ravel()
    # 每隔 5 个样本就在样本的值上添加噪音
    y[::5] += 1 * (0.5 - np.random.rand(int(n/5)))
    # 进行简单拆分,测试集大小占 1/4
    return train_test_split(X, y,test_size=0.25,random_state=0)

#KNN回归KNeighborsRegressor模型
def test_KNeighborsRegressor(*data):
    X_train,X_test,y_train,y_test=data
    regr=neighbors.KNeighborsRegressor()
    regr.fit(X_train,y_train)
    print("Training Score:%f"%regr.score(X_train,y_train))
    print("Testing Score:%f"%regr.score(X_test,y_test))

#获取回归模型的数据集
X_train,X_test,y_train,y_test=create_regression_data(1000)
# 调用 test_KNeighborsRegressor
test_KNeighborsRegressor(X_train,X_test,y_train,y_test)
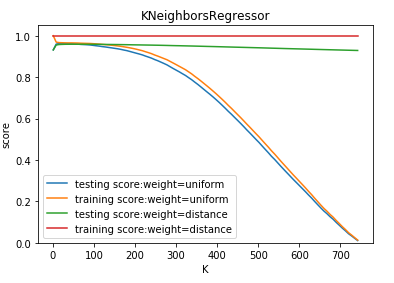
def test_KNeighborsRegressor_k_w(*data):
    '''
    测试 KNeighborsRegressor 中 n_neighbors 和 weights 参数的影响
    '''
    X_train,X_test,y_train,y_test=data
    Ks=np.linspace(1,y_train.size,num=100,endpoint=False,dtype='int')
    weights=['uniform','distance']

    fig=plt.figure()
    ax=fig.add_subplot(1,1,1)
    ### 绘制不同 weights 下, 预测得分随 n_neighbors 的曲线
    for weight in weights:
        training_scores=[]
        testing_scores=[]
        for K in Ks:
            regr=neighbors.KNeighborsRegressor(weights=weight,n_neighbors=K)
            regr.fit(X_train,y_train)
            testing_scores.append(regr.score(X_test,y_test))
            training_scores.append(regr.score(X_train,y_train))
        ax.plot(Ks,testing_scores,label="testing score:weight=%s"%weight)
        ax.plot(Ks,training_scores,label="training score:weight=%s"%weight)
    ax.legend(loc='best')
    ax.set_xlabel("K")
    ax.set_ylabel("score")
    ax.set_ylim(0,1.05)
    ax.set_title("KNeighborsRegressor")
    plt.show()

# 调用 test_KNeighborsRegressor_k_w
test_KNeighborsRegressor_k_w(X_train,X_test,y_train,y_test)
def test_KNeighborsRegressor_k_p(*data):
    '''
    测试 KNeighborsRegressor 中 n_neighbors 和 p 参数的影响
    '''
    X_train,X_test,y_train,y_test=data
    Ks=np.linspace(1,y_train.size,endpoint=False,dtype='int')
    Ps=[1,2,10]

    fig=plt.figure()
    ax=fig.add_subplot(1,1,1)
    ### 绘制不同 p 下, 预测得分随 n_neighbors 的曲线
    for P in Ps:
        training_scores=[]
        testing_scores=[]
        for K in Ks:
            regr=neighbors.KNeighborsRegressor(p=P,n_neighbors=K)
            regr.fit(X_train,y_train)
            testing_scores.append(regr.score(X_test,y_test))
            training_scores.append(regr.score(X_train,y_train))
        ax.plot(Ks,testing_scores,label="testing score:p=%d"%P)
        ax.plot(Ks,training_scores,label="training score:p=%d"%P)
    ax.legend(loc='best')
    ax.set_xlabel("K")
    ax.set_ylabel("score")
    ax.set_ylim(0,1.05)
    ax.set_title("KNeighborsRegressor")
    plt.show()

# 调用 test_KNeighborsRegressor_k_p
test_KNeighborsRegressor_k_p(X_train,X_test,y_train,y_test)


【推荐】编程新体验,更懂你的AI,立即体验豆包MarsCode编程助手
【推荐】凌霞软件回馈社区,博客园 & 1Panel & Halo 联合会员上线
【推荐】抖音旗下AI助手豆包,你的智能百科全书,全免费不限次数
【推荐】博客园社区专享云产品让利特惠,阿里云新客6.5折上折
【推荐】轻量又高性能的 SSH 工具 IShell:AI 加持,快人一步