
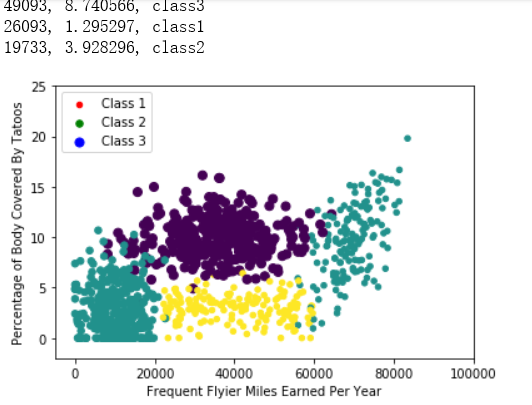
import matplotlib
import numpy as np
import matplotlib.pyplot as plt
from matplotlib.patches import Rectangle


n = 1000 #number of points to create
xcord = np.zeros((n))
ycord = np.zeros((n))
markers =[]
colors =[]
fw = open('D:\\LearningResource\\machinelearninginaction\\Ch02\\EXTRAS\\testSet.txt','w')

for i in range(n):
    [r0,r1] = np.random.standard_normal(2)
    myClass = np.random.uniform(0,1)
    if (myClass <= 0.16):
        fFlyer = np.random.uniform(22000, 60000)
        tats = 3 + 1.6*r1
        markers.append(20)
        colors.append(2.1)
        classLabel = 1 #'didntLike'
        print(("%d, %f, class1") % (fFlyer, tats))
    elif ((myClass > 0.16) and (myClass <= 0.33)):
        fFlyer = 6000*r0 + 70000
        tats = 10 + 3*r1 + 2*r0
        markers.append(20)
        colors.append(1.1)
        classLabel = 1 #'didntLike'
        print(("%d, %f, class1") % (fFlyer, tats))
    elif ((myClass > 0.33) and (myClass <= 0.66)):
        fFlyer = 5000*r0 + 10000
        tats = 3 + 2.8*r1
        markers.append(30)
        colors.append(1.1)
        classLabel = 2 #'smallDoses'
        print(("%d, %f, class2") % (fFlyer, tats))
    else:
        fFlyer = 10000*r0 + 35000
        tats = 10 + 2.0*r1
        markers.append(50)
        colors.append(0.1)
        classLabel = 3 #'largeDoses'
        print(("%d, %f, class3") % (fFlyer, tats))
    if (tats < 0):
        tats =0
    if (fFlyer < 0):
        fFlyer =0
    xcord[i] = fFlyer
    ycord[i]=tats
    fw.write("%d\t%f\t%f\t%d\n" % (fFlyer, tats, np.random.uniform(0.0, 1.7), classLabel))

fw.close()

fig = plt.figure()
ax = fig.add_subplot(111)
ax.scatter(xcord,ycord, c=colors, s=markers)
type1 = ax.scatter([-10], [-10], s=20, c='red')
type2 = ax.scatter([-10], [-15], s=30, c='green')
type3 = ax.scatter([-10], [-20], s=50, c='blue')
ax.legend([type1, type2, type3], ["Class 1", "Class 2", "Class 3"], loc=2)
ax.axis([-5000,100000,-2,25])
plt.xlabel('Frequent Flyier Miles Earned Per Year')
plt.ylabel('Percentage of Body Covered By Tatoos')
plt.show()

...................................................
import numpy as np
import matplotlib
import matplotlib.pyplot as plt
from matplotlib.patches import Rectangle


n = 1000 #number of points to create
xcord1 = []; ycord1 = []
xcord2 = []; ycord2 = []
xcord3 = []; ycord3 = []
markers =[]
colors =[]
fw = open('D:\\LearningResource\\machinelearninginaction\\Ch02\\EXTRAS\\testSet.txt','w')

for i in range(n):
    [r0,r1] = np.random.standard_normal(2)
    myClass = np.random.uniform(0,1)
    if (myClass <= 0.16):
        fFlyer = np.random.uniform(22000, 60000)
        tats = 3 + 1.6*r1
        markers.append(20)
        colors.append(2.1)
        classLabel = 1 #'didntLike'
        xcord1.append(fFlyer)
        ycord1.append(tats)
    elif ((myClass > 0.16) and (myClass <= 0.33)):
        fFlyer = 6000*r0 + 70000
        tats = 10 + 3*r1 + 2*r0
        markers.append(20)
        colors.append(1.1)
        classLabel = 1 #'didntLike'
        if (tats < 0):
            tats =0
        if (fFlyer < 0):
            fFlyer =0
        xcord1.append(fFlyer)
        ycord1.append(tats)
    elif ((myClass > 0.33) and (myClass <= 0.66)):
        fFlyer = 5000*r0 + 10000
        tats = 3 + 2.8*r1
        markers.append(30)
        colors.append(1.1)
        classLabel = 2 #'smallDoses'
        if (tats < 0):
            tats =0
        if (fFlyer < 0):
            fFlyer =0
        xcord2.append(fFlyer)
        ycord2.append(tats)
    else:
        fFlyer = 10000*r0 + 35000
        tats = 10 + 2.0*r1
        markers.append(50)
        colors.append(0.1)
        classLabel = 3 #'largeDoses'
        if (tats < 0): tats =0
        if (fFlyer < 0): fFlyer =0
        xcord3.append(fFlyer)
        ycord3.append(tats)
        fw.write("%d\t%f\t%f\t%d\n" % (fFlyer, tats, np.random.uniform(0.0, 1.7), classLabel))

fw.close()
fig = plt.figure()
ax = fig.add_subplot(111)
# ax.scatter(xcord,ycord, c=colors, s=markers)
type1 = ax.scatter(xcord1, ycord1, s=20, c='red')
type2 = ax.scatter(xcord2, ycord2, s=30, c='green')
type3 = ax.scatter(xcord3, ycord3, s=50, c='blue')
ax.legend([type1, type2, type3], ["Did Not Like", "Liked in Small Doses", "Liked in Large Doses"], loc=2)
ax.axis([-5000,100000,-2,25])
plt.xlabel('Frequent Flyier Miles Earned Per Year')
plt.ylabel('Percentage of Time Spent Playing Video Games')
plt.show()

import numpy as np
import matplotlib
import matplotlib.pyplot as plt

def file2matrix(filename):
    fr = open(filename)
    returnMat = []
    classLabelVector = []                       #prepare labels return
    for line in fr.readlines():
        line = line.strip()
        listFromLine = line.split('\t')
        returnMat.append([float(listFromLine[0]),float(listFromLine[1]),float(listFromLine[2])])
        classLabelVector.append(int(listFromLine[-1]))
    return np.array(returnMat),np.array(classLabelVector)

fig = plt.figure()
ax = fig.add_subplot(111)
datingDataMat,datingLabels = file2matrix('D:\\LearningResource\\machinelearninginaction\\Ch02\\datingTestSet2.txt')
#ax.scatter(datingDataMat[:,1], datingDataMat[:,2])
ax.scatter(datingDataMat[:,1], datingDataMat[:,2], 15.0*np.array(datingLabels), 15.0*np.array(datingLabels))
ax.axis([-2,25,-0.2,2.0])
plt.xlabel('Percentage of Time Spent Playing Video Games')
plt.ylabel('Liters of Ice Cream Consumed Per Week')
plt.show()

