通过matlab验证基于TCN的路面等级分类
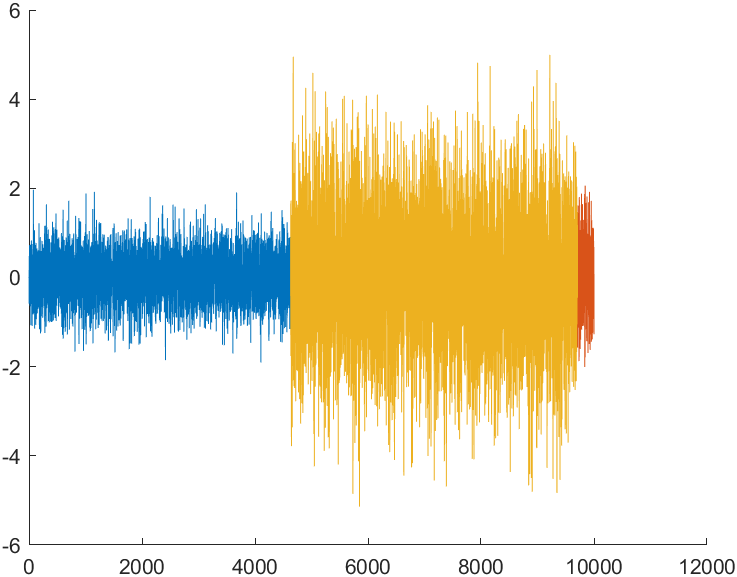
运行simulink仿真模型得到簧下质量加速度(暂未加入弹性路面)
- 得到的数据如图所示:
训练TCN模型
clc
clear
%% 加载数据
load X_train
load Y_train
load X_test
load Y_test
len=length(Y_train);
for i=1:len
Y_train{i} = categorical(Y_train{i},[0,1,2,3],{'A','B','C','D'});
end
len=length(Y_test);
for i=1:len
Y_test{i} = categorical(Y_test{i},[0,1,2,3],{'A','B','C','D'});
end
X=X_train{1}(1,:);
classes = categories(Y_train{1});
%% 查看数据
figure
for j = 1:numel(classes)
label = classes(j);
idx = find(Y_train{1} == label);
hold on
plot(idx,X(idx))
end
hold off
xlabel("Time Step")
ylabel("Acceleration")
title("Training Sequence 1, Feature 1")
legend(classes,'Location','northwest')
%% 建立模型
numObservations = numel(X_train);
classes = categories(Y_test{1});
numClasses = numel(classes);
numFeatures = size(X_train{1},1);
numFilters = 64;
filterSize = 5;
dropoutFactor = 0.005;
numBlocks = 4;
numFilters = 64;
layer = sequenceInputLayer(numFeatures,Normalization="rescale-symmetric",Name="input");
lgraph = layerGraph(layer);
outputName = layer.Name;
for i = 1:numBlocks
dilationFactor = 2^(i-1);
layers = [
convolution1dLayer(filterSize,numFilters,DilationFactor=dilationFactor,Padding="causal",Name="conv1_"+i)
layerNormalizationLayer
spatialDropoutLayer(dropoutFactor)
convolution1dLayer(filterSize,numFilters,DilationFactor=dilationFactor,Padding="causal")
layerNormalizationLayer
reluLayer
spatialDropoutLayer(dropoutFactor)
additionLayer(2,Name="add_"+i)];
% Add and connect layers.
lgraph = addLayers(lgraph,layers);
lgraph = connectLayers(lgraph,outputName,"conv1_"+i);
% Skip connection.
if i == 1
% Include convolution in first skip connection.
layer = convolution1dLayer(1,numFilters,Name="convSkip");
lgraph = addLayers(lgraph,layer);
lgraph = connectLayers(lgraph,outputName,"convSkip");
lgraph = connectLayers(lgraph,"convSkip","add_" + i + "/in2");
else
lgraph = connectLayers(lgraph,outputName,"add_" + i + "/in2");
end
% Update layer output name.
outputName = "add_" + i;
end
layers = [
fullyConnectedLayer(numClasses,Name="fc")
softmaxLayer
classificationLayer];
lgraph = addLayers(lgraph,layers);
lgraph = connectLayers(lgraph,outputName,"fc");
%%
figure
plot(lgraph)
title("Temporal Convolutional Network")
%% 模型初始设置
options = trainingOptions("adam", ...
'ExecutionEnvironment','gpu', ...
MaxEpochs = 60, ...
miniBatchSize = 1, ...
InitialLearnRate = 0.001,...
LearnRateSchedule="piecewise",...
LearnRateDropPeriod = 30,...
LearnRateDropFactor = 0.1,...
Plots="training-progress", ...
Verbose=0);
[net, info] = trainNetwork(X_train,Y_train,lgraph,options);
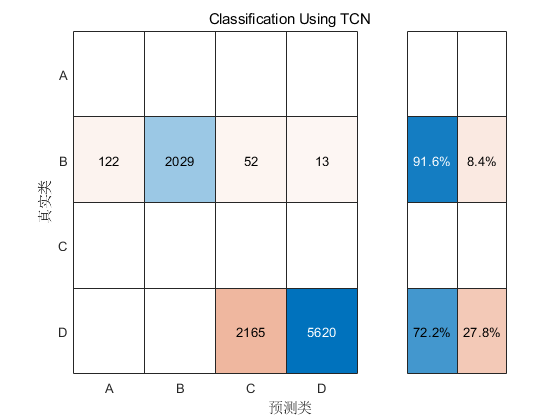
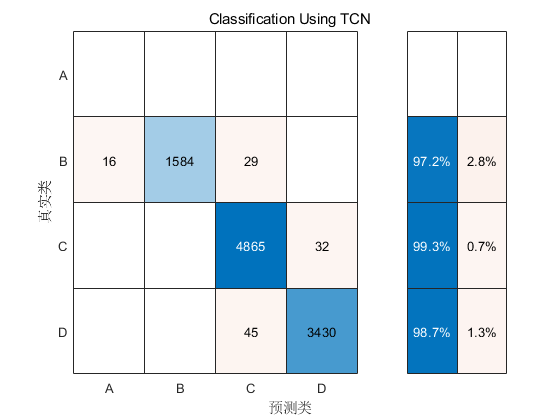
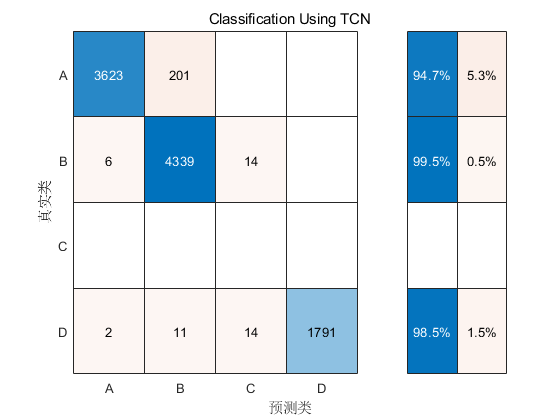
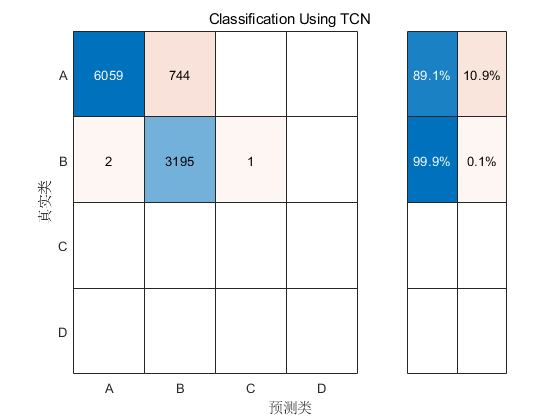
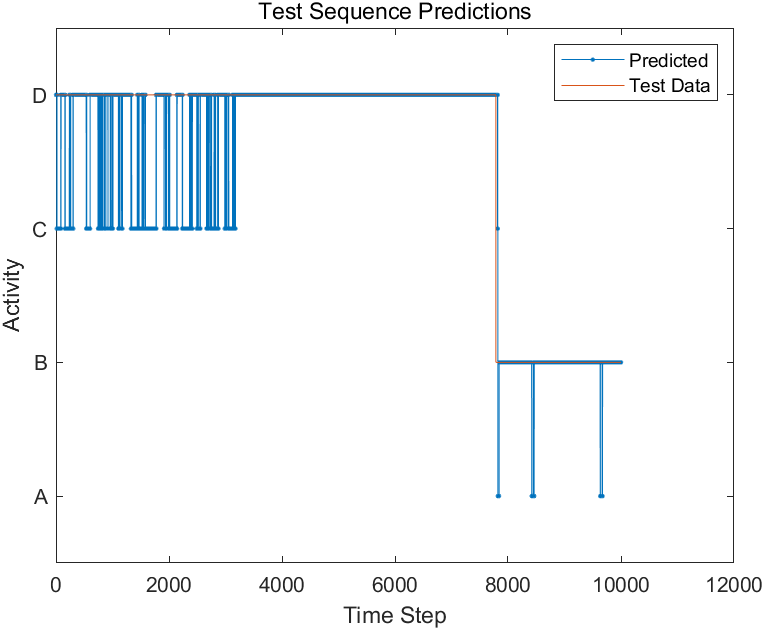
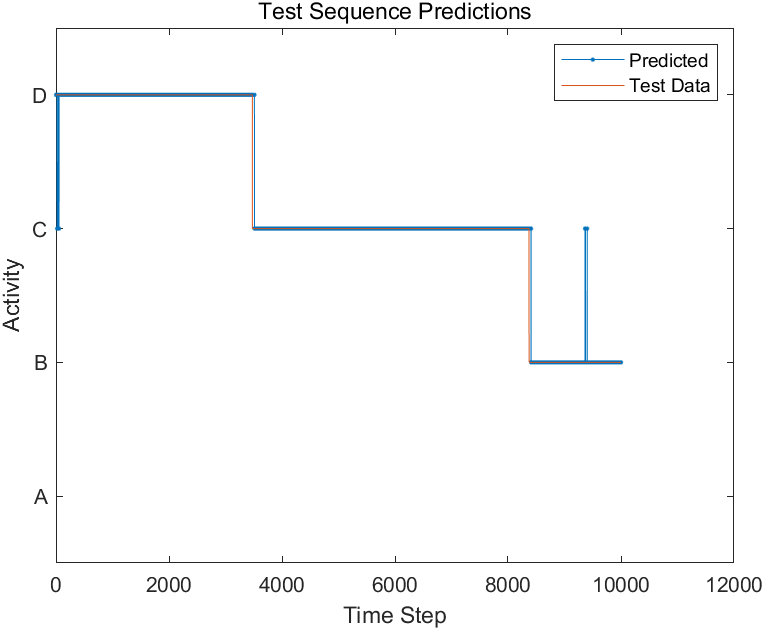
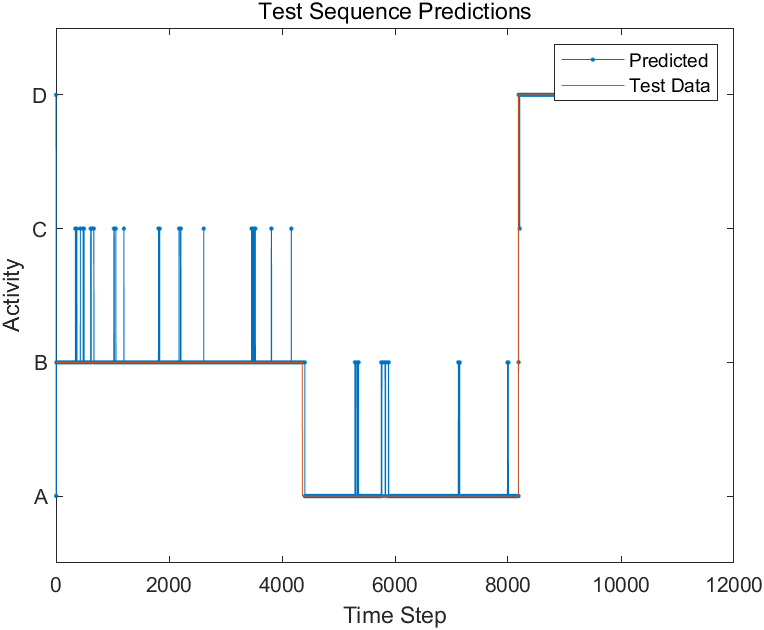
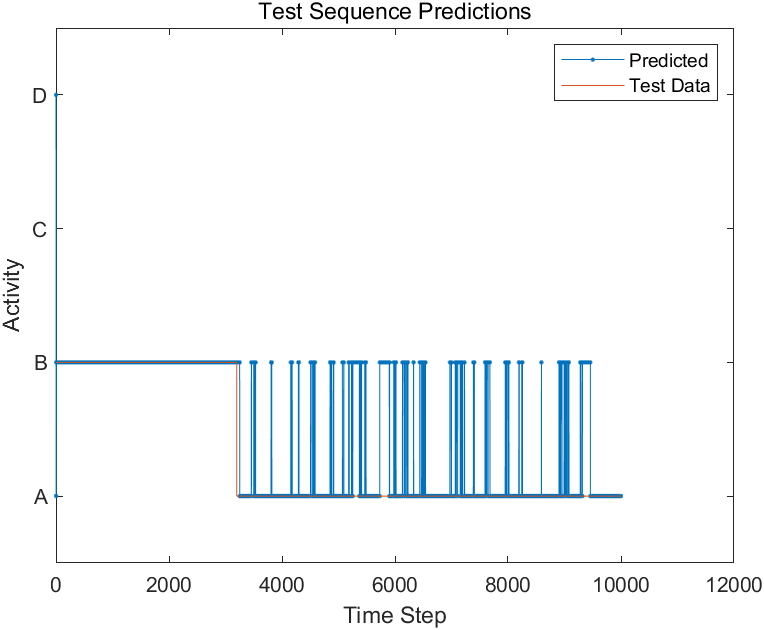
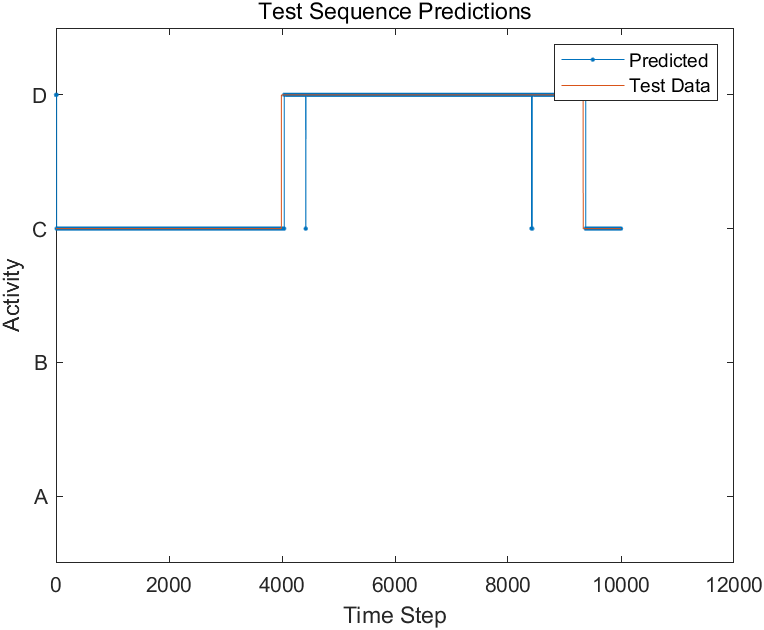
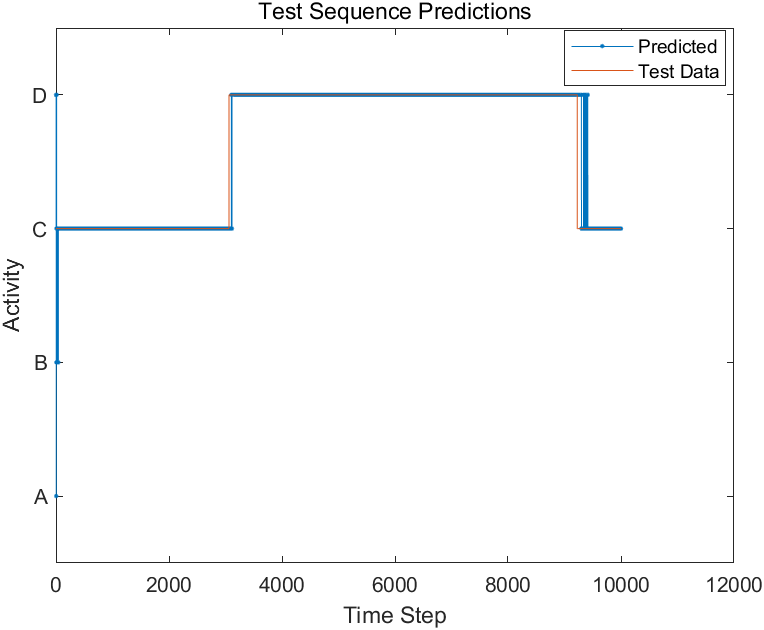
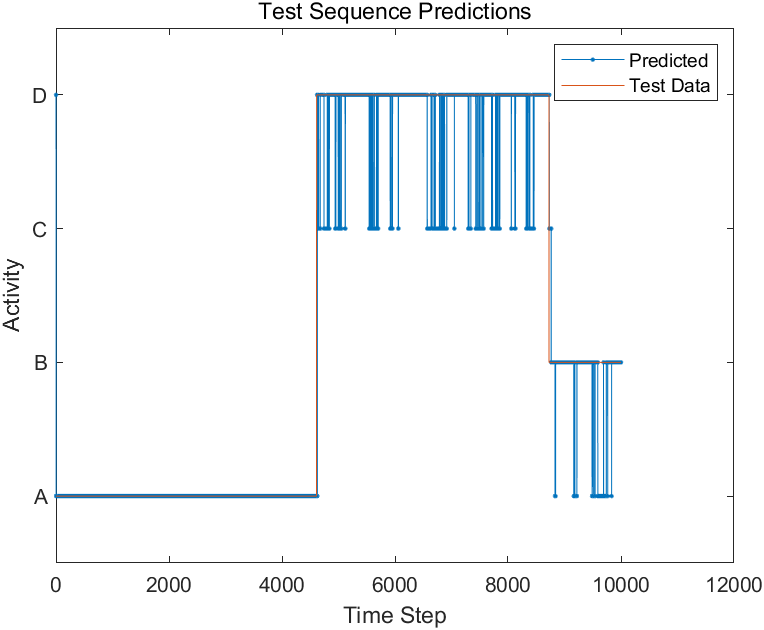
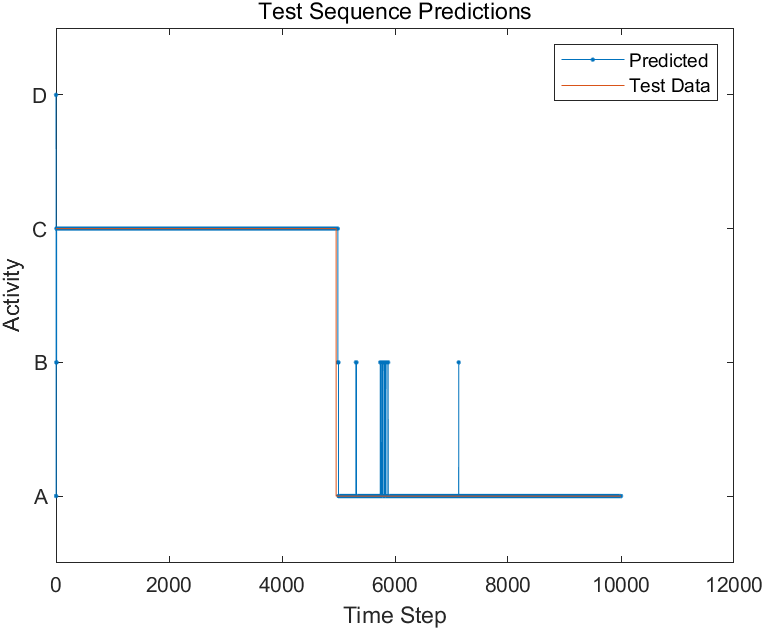
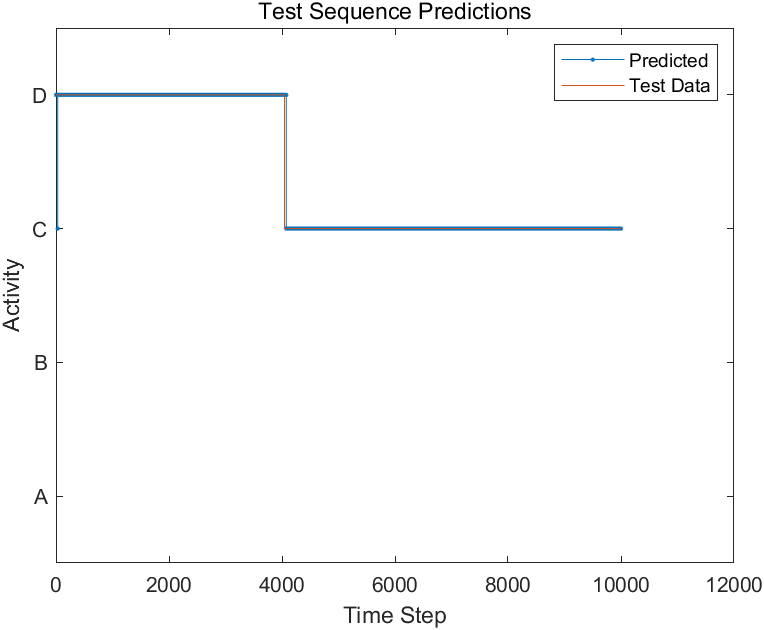
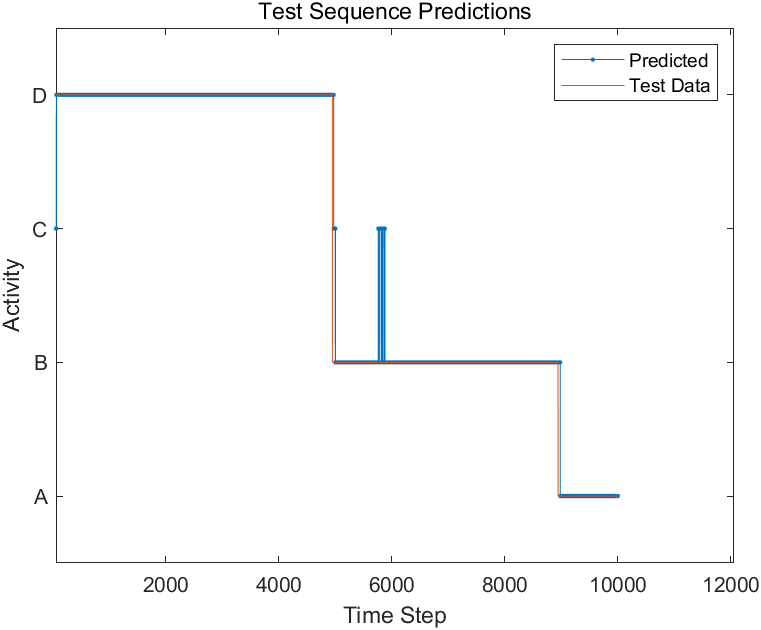
%% 测试及结果可视化
YPred = classify(net,X_test);
for i =1:len
figure (i)
plot(YPred{i},".-")
hold on
plot(Y_test{i})
hold off
xlabel("Time Step")
ylabel("Activity")
legend(["Predicted" "Test Data"],Location="northeast")
title("Test Sequence Predictions")
end
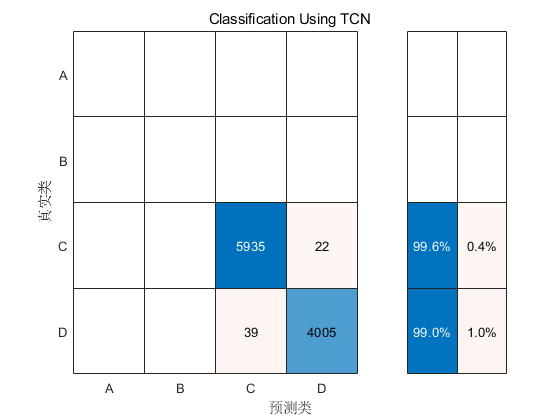
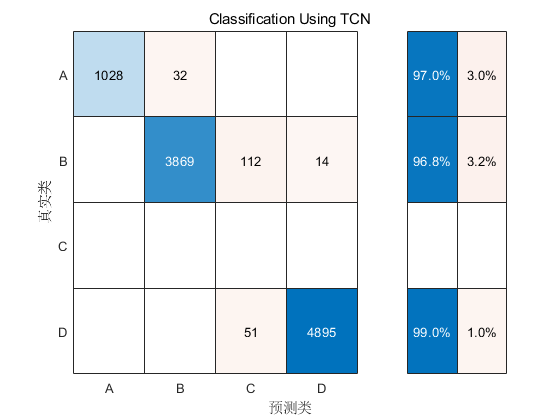
for i = 1:len
acc(i) = sum(YPred{i} == Y_test{i})./numel(Y_test{i});
figure (i)
cm=confusionchart(Y_test{i},YPred{i});
cm.Title = 'Classification Using TCN';
cm.RowSummary = 'row-normalized';
end
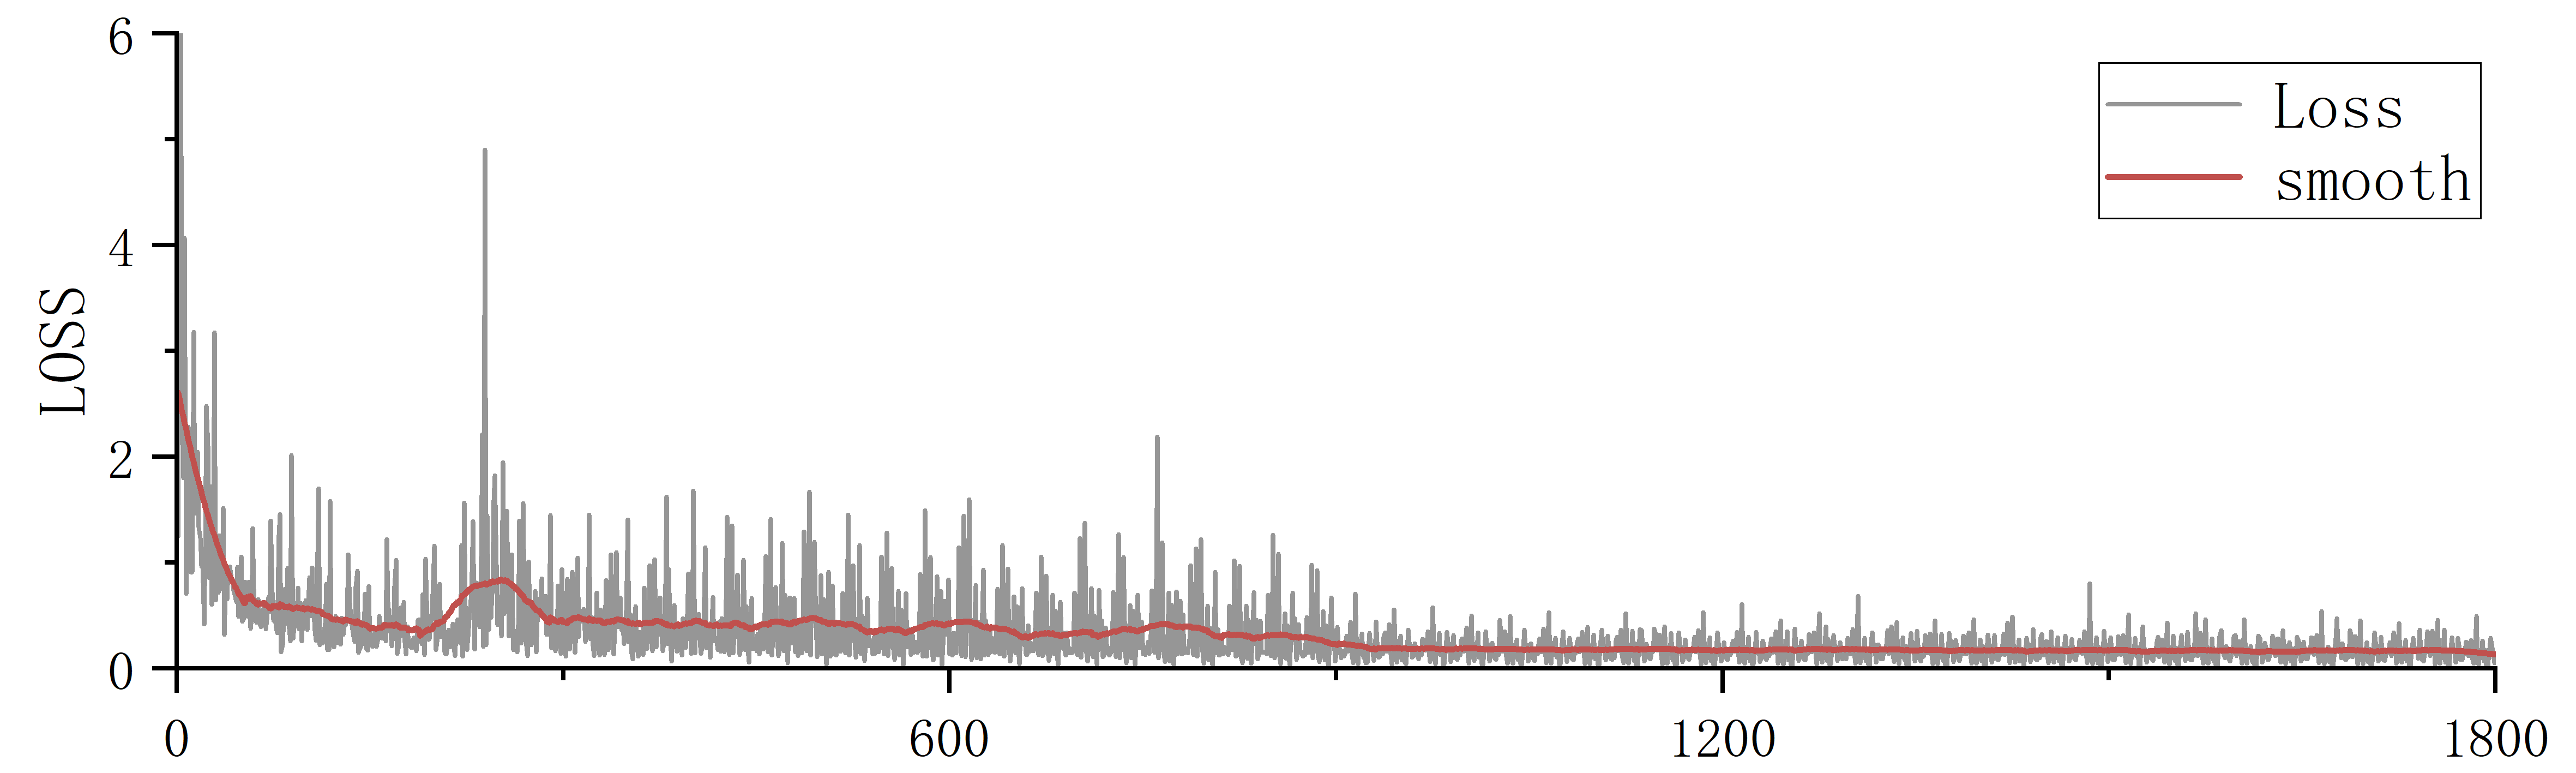
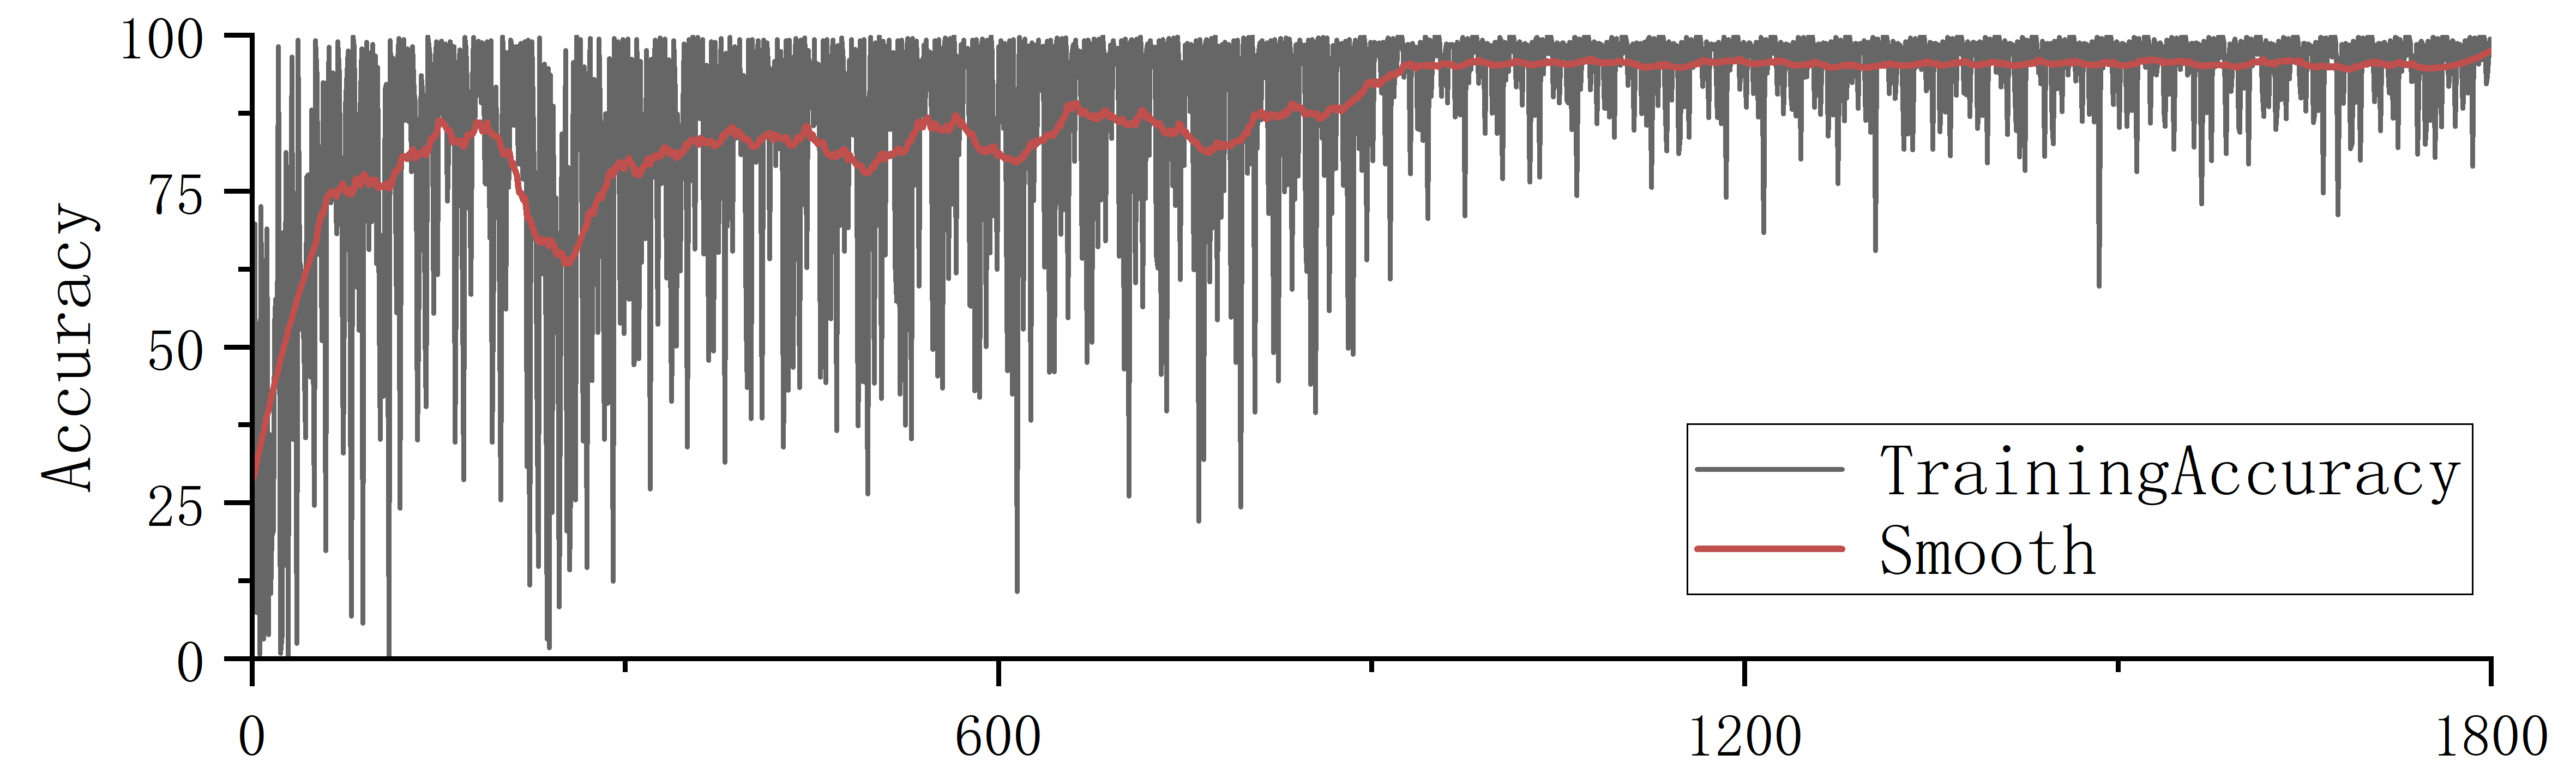
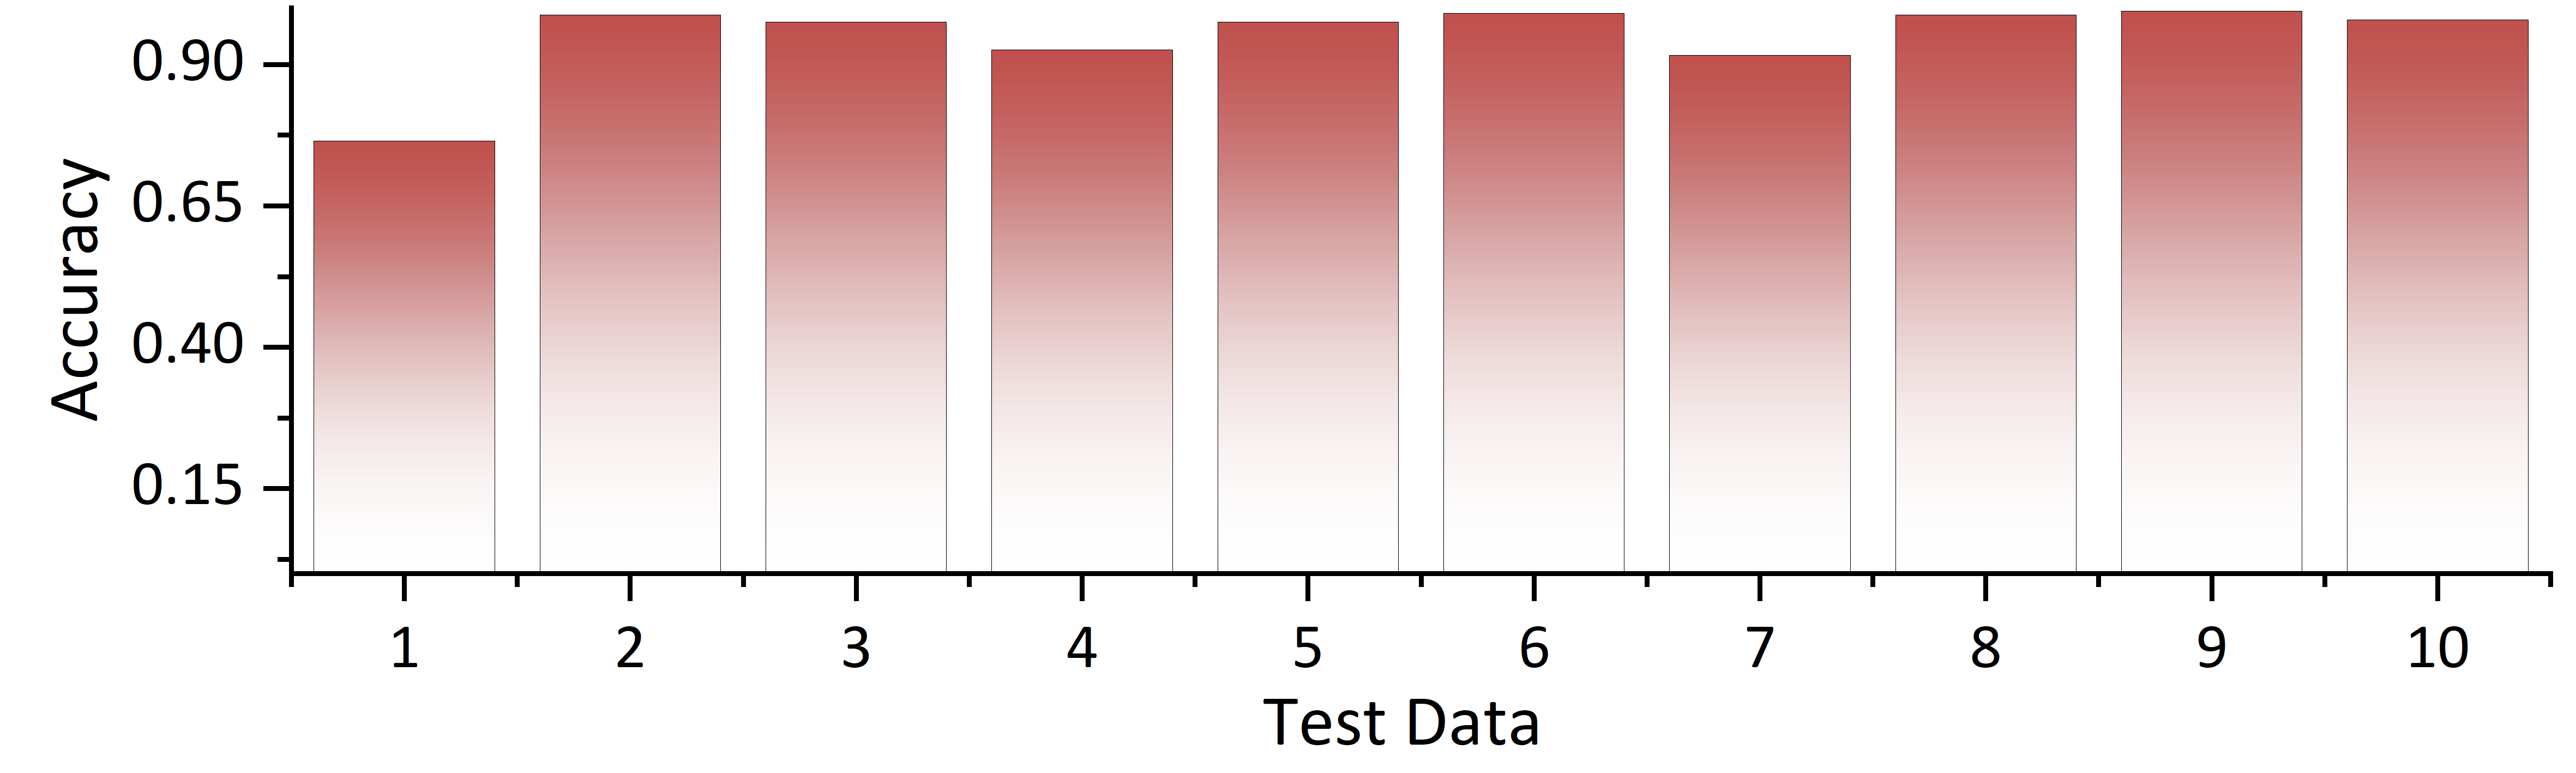
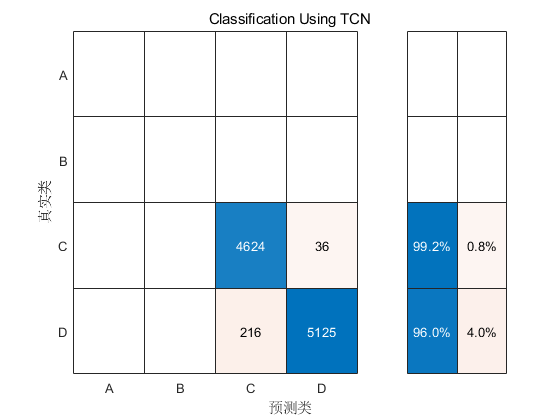
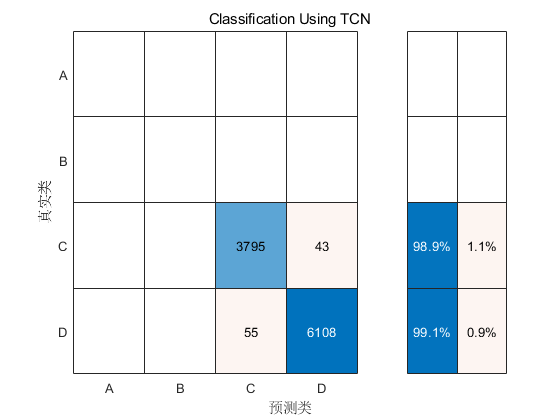
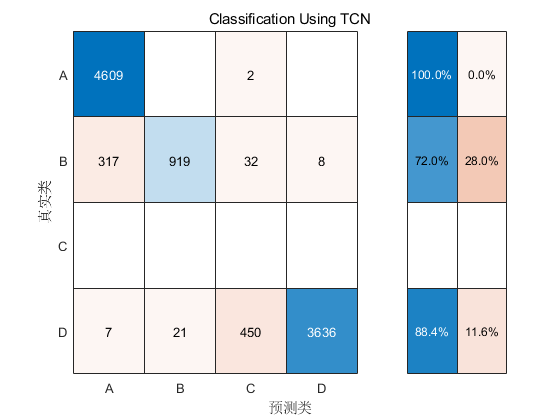
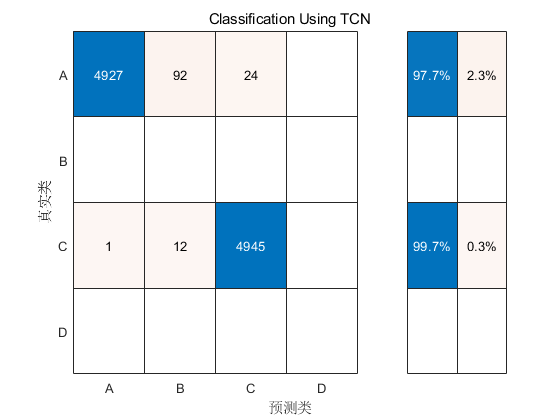
结果
- 训练损失函数图
- 训练准确率图
- 不同组数据测试准确率图
- 不同组测试数据分类矩阵图
- 不同组测试数据分类图
补充实验数据,优化代码
加载pcap数据
clc;
clear;
% load pcap_data
filename= 'D:\leidashuji\0608\pacp_data\01.pcap';
veloReader = velodyneFileReader(filename,"VLP16");
ptCloud_original=readFrame(veloReader,50);
坐标转换
%% Coordinate transformation
thetax = 25*pi/180;%
thetay =0*pi/180;
thetaz = 0;
rotx = [1 0 0; ...
      0 cos(thetax) -sin(thetax); ...
      0 sin(thetax)  cos(thetax)];
rotz=[cos(thetaz)  sin(thetaz) 0; ...
      -sin(thetaz) cos(thetaz) 0; ...
               0          0  1];
roty=[cos(thetay) 0 sin(thetay);
          0      1     0;
    -sin(thetay) 0 cos(thetay)];
trans = [0, 0, 0];
tform = rigid3d(roty*rotx*rotz,trans);
ptcloud_trans=pctransform(ptCloud_original,tform);
兴趣区域提取
for i=1:16
    ptcloud_id{i} = pointCloud(ptcloud_trans.Location(i,:,:));
    roi = [-0.8 0.8 0.2 3.5 -1 0];
    indices = findPointsInROI(ptcloud_id{i},roi);
    ptcloud_id{i} = select(ptcloud_id{i},indices);
    figure (1)
    pcshow(ptcloud_id{i})
    hold on
end
hold off
平滑
%% Smoothing
N=1;
num_pt=31;                             % Local area range of lowess
for i=1:16
    len = length(ptcloud_id{i}.Location);
    if  len>100
      ptcloud_pinghua{N} = ptcloud_id{1,i};
      ptcloud_smoothing{N} = Lowess_gaijin(ptcloud_pinghua{N}.Location,num_pt);
      ptcloud_smoothing{N} = pointCloud(ptcloud_smoothing{N});
      figure (2)
      pcshow(ptcloud_smoothing{N})
      hold on
      N=N+1;
    end
end
hold off
斜率计算
len = length(ptcloud_smoothing);
for i = 1:len
    len_1=length(ptcloud_smoothing{i}.Location);
    len_2=fix(len_1/4);
    for j=1:len_2-1
        z_piniun_1{i}(j)=(ptcloud_smoothing{i}.Location(4*j-3,3)+...
        ptcloud_smoothing{i}.Location(4*j-2,3)+...
        ptcloud_smoothing{i}.Location(4*j-1,3)+ptcloud_smoothing{i}.Location(4*j,3))/4;
        x_piniun_1{i}(j)=(ptcloud_smoothing{i}.Location(4*j-3,1)+...
        ptcloud_smoothing{i}.Location(4*j-2,1)+...
        ptcloud_smoothing{i}.Location(4*j-1,1)+ptcloud_smoothing{i}.Location(4*j,1))/4;
        z_piniun_2{i}(j)=(ptcloud_smoothing{i}.Location(4*(j+1)-3,3)+...
        ptcloud_smoothing{i}.Location(4*(j+1)-2,3)+...
        ptcloud_smoothing{i}.Location(4*(j+1)-1,3)+ptcloud_smoothing{i}.Location(4*(j+1),3))/4;
        x_piniun_2{i}(j)=(ptcloud_smoothing{i}.Location(4*(j+1)-3,1)+...
        ptcloud_smoothing{i}.Location(4*(j+1)-2,1)+...
        ptcloud_smoothing{i}.Location(4*(j+1)-1,1)+ptcloud_smoothing{i}.Location(4*(j+1),1))/4;
        xita{i}(j)=(z_piniun_2{i}(1,j)-z_piniun_1{i}(1,j))/...
        (x_piniun_2{i}(1,j)-x_piniun_1{i}(1,j));
    end
    len_3 = length(ptcloud_smoothing{i}.Location);
    len_4 = fix(len_3/4);
    x_min = ptcloud_smoothing{i}.XLimits(1);
    x_max = ptcloud_smoothing{i}.XLimits(2);
    t{i}=x_min:(x_max-x_min)/(len_4-2):x_max;
    xita_chazhi{i} = interp1(t{i},xita{i},ptcloud_smoothing{i}.Location(:,1));
    xita_figure{i}(:,1) = ptcloud_smoothing{i}.Location(:,1);
    xita_figure{i}(:,2) = i*ones(len_3,1);
    xita_figure{i}(:,3) = xita_chazhi{i};
end
figure(3)
for i = 1:len
plot3(xita_figure{i}(:,1),xita_figure{i}(:,2),xita_figure{i}(:,3))
hold on
end
hold off
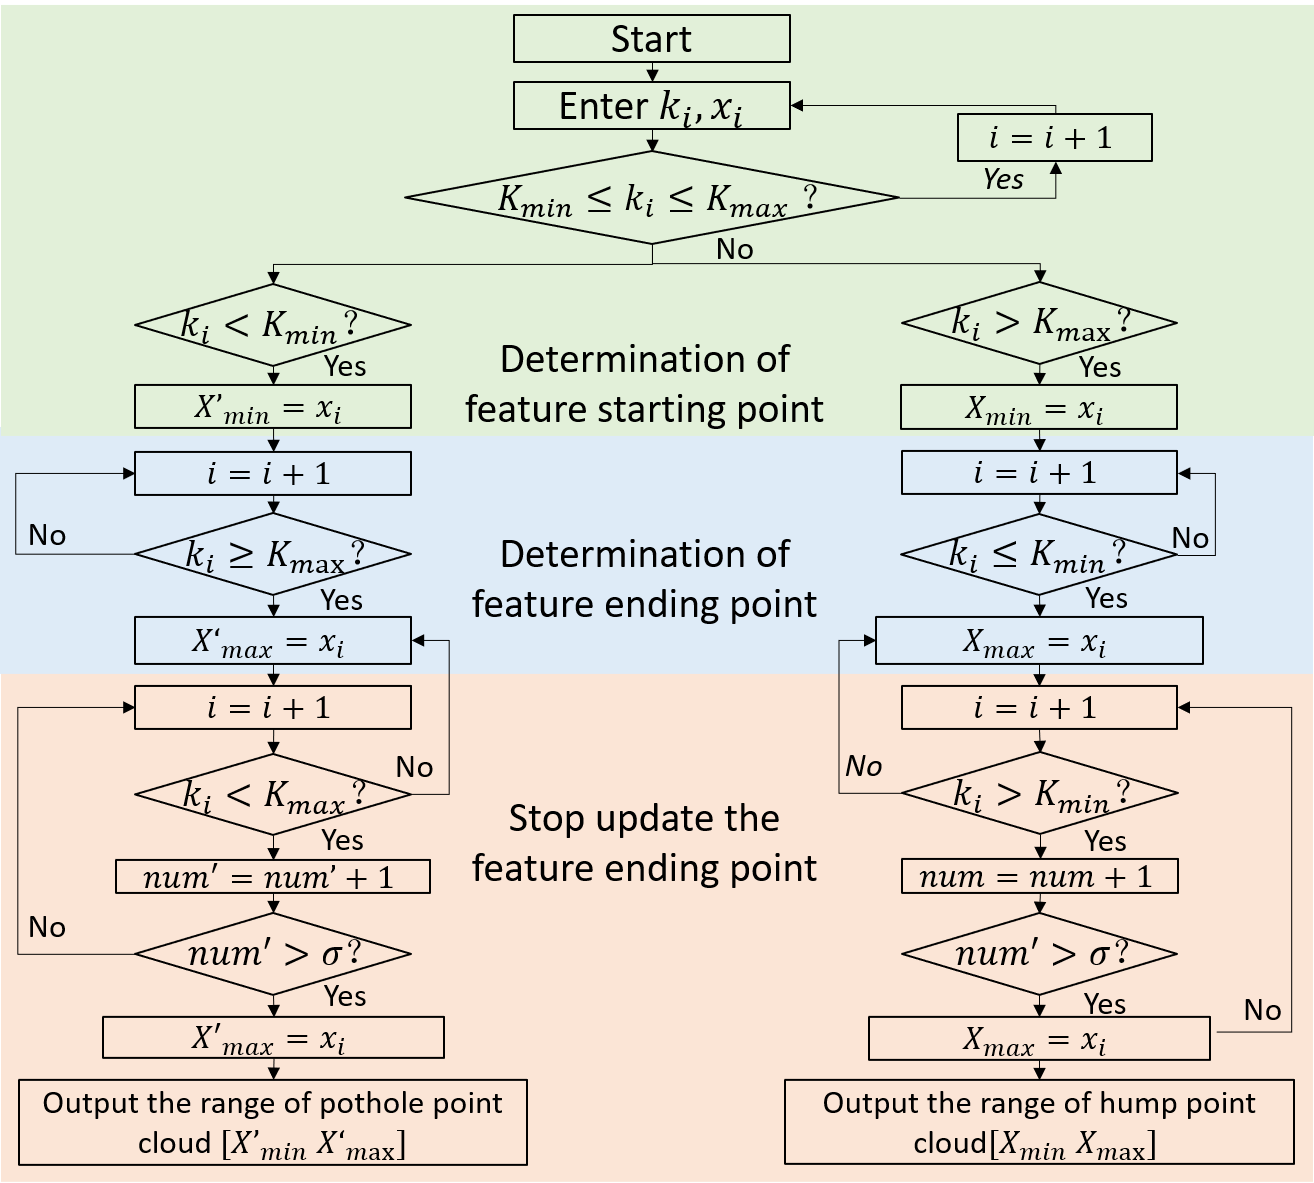
斜率阈值分割算法
%% Division of the slope
xieyv_max_1 = 0.1;
xieyv_min_1 = -0.1;
xieyv_max_2 = 0.1;
xieyv_min_2 = -0.1;
info_1 = zeros(11,16);
info_2 = zeros(11,16);
dta = 1;
[Xmin_1,Xmax_1,Xmin_2,Xmax_2] = ...    slop_seg(xieyv_max_1,xieyv_min_1,xieyv_max_2,xieyv_min_2,xita_chazhi,ptcloud_smoothing,info_1,info_2,dta);
%Xmin_1,Xmax_1为凸起范围,Xmin_2,Xmax_2为凹坑范围
slop_seg函数
function [outputArg1,outputArg2,outputArg3,outputArg4] = slop_seg(xieyv_max_1,xieyv_min_1,xieyv_max_2,xieyv_min_2,xita_chazhi,ptcloud_smoothing,info_1,info_2,dta)
len = length(xita_chazhi);
Xmin_1 = zeros(10,16);
Xmax_1 = zeros(10,16);
Xmin_2 = zeros(10,16);
Xmax_2 = zeros(10,16);
for n = 1:10
for i = 1:len
    len_1 = length(xita_chazhi{i});
    num = 0;
    %%%%%%%%%%%%%%%%%%%%%%%%%%%%%%%%%%%%%%%%%%%%%%%
    if n == 1 || info_1(n+1,i)>info_1(n,i)
    for j =info_1(n+1,i)+1:len_1
    if xita_chazhi{i}(j)>xieyv_max_1
       Xmin_1(n,i) = ptcloud_smoothing{i}.Location(j,1);
       for k = j+1:len_1
           if xita_chazhi{i}(k)<=xieyv_min_1
           for m = k+1:len_1
               if xita_chazhi{i}(m)>xieyv_min_1
               num = num+1;
               end
               if num >dta
               Xmax_1(n,i) = ptcloud_smoothing{i}.Location(m,1);
               info_1(n+2,i) = m;
               break
               end
           end
           end
           if num >dta
           break
           end
       end
    end
    if num >dta
           break
    end
    end
    end
   %%%%%%%%%%%%%%%%%%%%%%%%%%%%%%%%%%%%%%%%%%%%%%%
    if n == 1 || info_2(n+1,i)>info_2(n,i)
    for j =info_2(n+1,i)+1:len_1
    num = 0;
    if xita_chazhi{i}(j)<xieyv_min_2
       Xmin_2(n,i) = ptcloud_smoothing{i}.Location(j,1);
       for k = j+1:len_1
           if xita_chazhi{i}(k)>=xieyv_max_2
           for m = k+1:len_1
               if xita_chazhi{i}(m)<xieyv_max_2
               num = num+1;
               end
               if num >dta
               Xmax_2(n,i) = ptcloud_smoothing{i}.Location(m,1);
               info_2(n+2,i) = m;
               break
               end
           end
           end
       if num >dta
          break
       end
       end
    end
    if num >dta
       break
    end
    end
end
end
end
%%%%%%%%%%%%%%%%%%%%%%%%%%%%%%%%%%%%%%%%%%%%%%%%%%%%%%%%%%%%%%%%%%
outputArg1 = Xmin_1;
outputArg2 = Xmax_1;
outputArg3 = Xmin_2;
outputArg4 = Xmax_2;
end
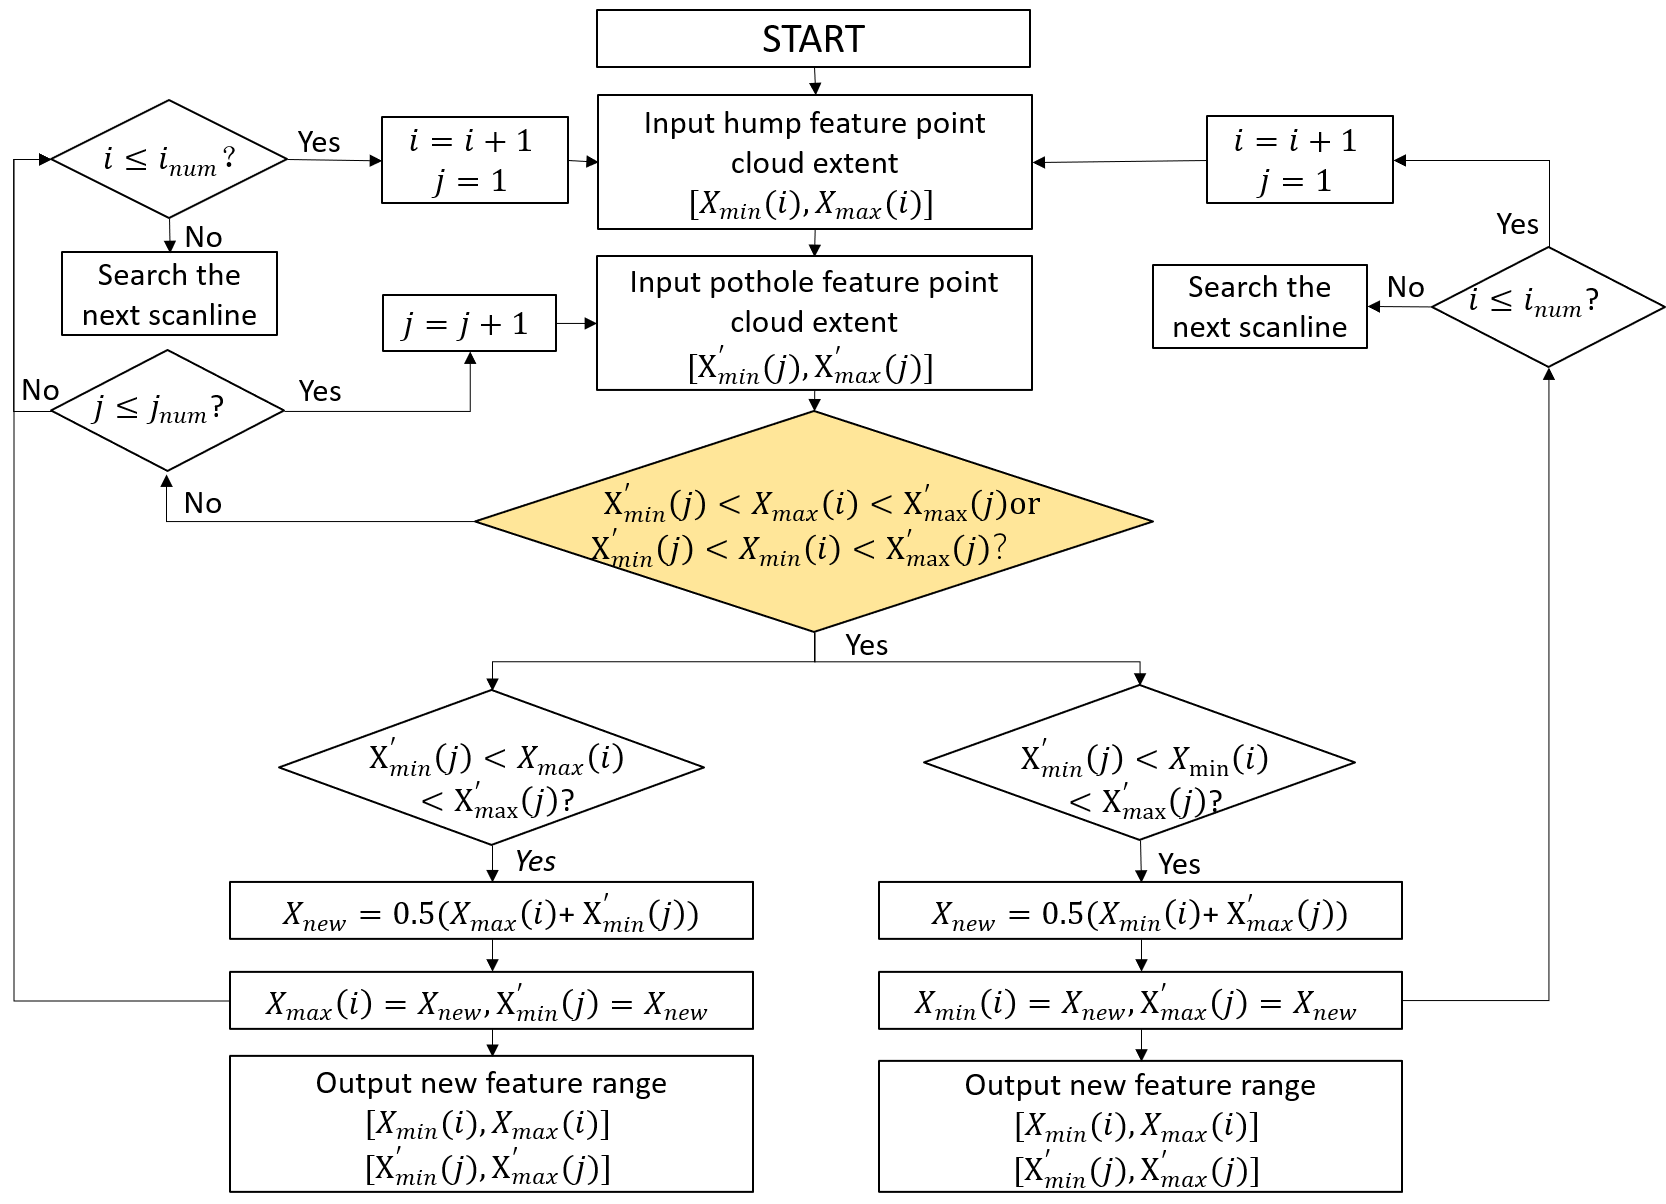
特征重合问题
%% The humps overlap the potholes
for i = 1:10
for j = 1:16
    for k = 1:10
    if Xmax_1(i,j)>Xmin_2(k,j)&&Xmax_1(i,j)<Xmax_2(k,j)&&Xmax_1(i,j)~=0&&Xmax_2(k,j)~=0
       Xnew = 0.5*(Xmax_1(i,j)+Xmin_2(k,j));
       Xmax_1(i,j) = Xnew;
       Xmin_2(k,j) = Xnew;
    end
    if Xmin_1(i,j)>Xmin_2(k,j)&&Xmin_1(i,j)<Xmax_2(k,j)&&Xmin_1(i,j)~=0&&Xmax_2(k,j)~=0
       Xnew = 0.5*(Xmin_1(i,j)+Xmax_2(k,j));
       Xmin_1(i,j) = Xnew;
       Xmax_2(k,j) = Xnew;
    end
    end
end
end
ROI确定
%% Feature area ROi
Roi_1 = cell(10,16);
Roi_2 = cell(10,16);
for i = 1:10
    for j =1:16
        if Xmax_1(i,j)~=0
           Roi_1{i,j} = [Xmin_1(i,j),Xmax_1(i,j),0.2 3.5 -1 0];
        end
        if Xmax_2(i,j)~=0
           Roi_2{i,j} = [Xmin_2(i,j),Xmax_2(i,j),0.2 3.5 -1 0];
        end
    end
end
%% road area Roi
% 将没有特征的激光雷达线分离出来
Ptcloud_nomal = cell(10,16);
for i = 1:16
    len_1 = length(Roi_1{1,i});
    len_2 = length(Roi_2{1,i});
    if len_1 == 0 && len_2 ==0
        Ptcloud_nomal{1,i} = ptcloud_smoothing{i};
    end
end
% 将凹坑,凸起特征范围保存至Roi_3.data中
Roi_3 = cell(1,16);
for i = 1:16
    N = 1;
        for j = 1:10
        len_1 = length(Roi_1{j,i});
        len_2 = length(Roi_2{j,i});
        if len_1 == 6
        Roi_3{1,i}.data(N,:) = Roi_1{j,i} ;
        Roi_3{1,i}.num = N;
        N = N+1;
        end
        if len_2 == 6
        Roi_3{1,i}.data(N,:) = Roi_2{j,i} ;
        Roi_3{1,i}.num = N;
        N = N+1;
        end
        end
end
% 以x值大小对特征范围进行排序
for i = 1:16
    len = length(Roi_3{i});
    if len>0
    Roi_3{i}.data_new = sortrows(Roi_3{i}.data,1);
    end
end
% 求得包含特征激光线中的路面点云范围,保存至Roi_3.roi中
for i = 1:16
    len = length(Roi_3{i});
    if len > 0
    len_1 =  Roi_3{i}.num;
    N = 1;
    for j = 1:len_1+1
        if j == 1
        Roi_3{i}.roi{N}=[-1 Roi_3{i}.data_new(1,1) 0.2 3.5 -1 0];
        N = N+1;
        elseif j>1 && j<len_1+1 && Roi_3{i}.data_new(j-1,2)~=Roi_3{i}.data_new(j,1)
        Roi_3{i}.roi{N}=[Roi_3{i}.data_new(j-1,2) Roi_3{i}.data_new(j,1) 0.2 3.5 -1 0];
        N = N+1;
        elseif j == len_1+1
        Roi_3{i}.roi{N}=[Roi_3{i}.data_new(j-1,2) 1 0.2 3.5 -1 0];
        N = N+1;
        end
    end
    end
end
特征区域与道路区域提取
%% Feature area extraction
Ptcloud_feature_1 = cell(10,16);
Ptcloud_feature_2 = cell(10,16);
for i =1:10
    for j =1:16
        len_1 = length(Roi_1{i,j});
        len_2 = length(Roi_2{i,j});
        if len_1 == 6
        indices = findPointsInROI(ptcloud_smoothing{j},Roi_1{i,j});
        Ptcloud_feature_1{i,j}= select(ptcloud_smoothing{j},indices);
        end
        if len_2 == 6
        indices = findPointsInROI(ptcloud_smoothing{j},Roi_2{i,j});
        Ptcloud_feature_2{i,j}= select(ptcloud_smoothing{j},indices);
        end
    end
end
%% road area extraction
Ptcloud_road =  cell(10,16);
for i = 1:16
len = length(Roi_3{i});
    if len>0
    for j = 1:length(Roi_3{i}.roi)
        indices = findPointsInROI(ptcloud_smoothing{i},Roi_3{i}.roi{j});
        Ptcloud_road{j,i} = select(ptcloud_smoothing{i},indices);
    end
    end
end

