基于夜间灯光遥感数据的中原城市群城镇空间格局研究
基于夜间灯光遥感数据的城镇空间格局研究
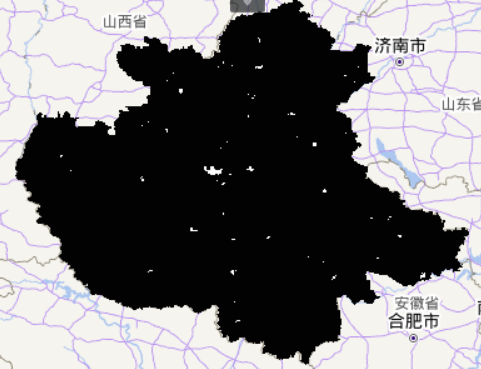
基于夜间灯光提取城市建成区的范围,从而进行区域城镇化空间格局分析。
初始化环境
import aie
aie.Authenticate()
aie.Initialize()
读取行政区划数据
feature_collection = aie.FeatureCollection('user/35861bf257e14a8c807ef23cd92101c8')
geometry = feature_collection.geometry()
map = aie.Map(
    center=geometry.getCenter(),
    height=800,
    zoom=5
)

vis_params = {
    'color': '#00FF00'
}
map.addLayer(
    geometry,
    vis_params,
    'region',
    bounds=geometry.getBounds()
)
map
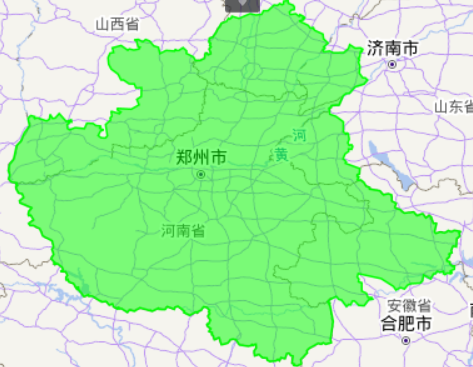
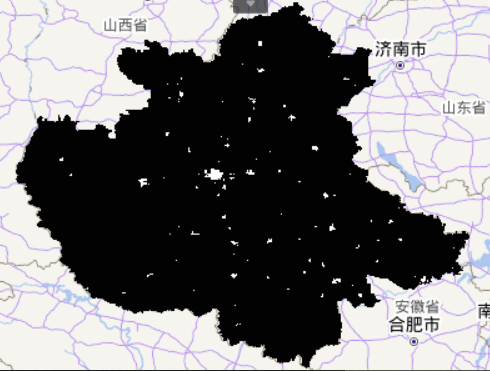
2020年中原城市群
#指定检索数据集,可设置检索的时间范围
dataset = aie.ImageCollection('NOAA_VIIRS_DNB_ANNUAL_V2_VCMSLCFG') \
             .filterDate("2020-01-01", "2020-12-31")
imgs = dataset.select(['average'])
imgs = imgs.mosaic()
imgs = imgs.clip(geometry)

# vis_params = {
#     'bands': 'average',
#     'min': 0.0,
#     'max': 60.0
# }
# map.addLayer(
#     imgs,
#     vis_params,
#     'Nighttime average',
#     bounds=imgs.getBounds()
# )
# map
DN_mean_2020 = imgs.reduceRegion(aie.Reducer.mean())
DN_mean_2020.getInfo()
DN_mean_2020 = DN_mean_2020.getInfo()['average_mean']
# 经过多次对比,将阈值设置为20,这个阈值大家可以设置的更加科学
city_2020 = imgs.gte(aie.Image.constant(20))
mask_params = {
    'bands': 'average',
    'min': 0,
    'max': 1,
    'paletee':['#000000','#ffffff']
}
map.addLayer(
    city_2020,
    mask_params,
    'city_2020',
    bounds=city_2020.getBounds()
)
map
# task = aie.Export.image.toAsset(city_2020,'city_2020',1000)
# task.start()
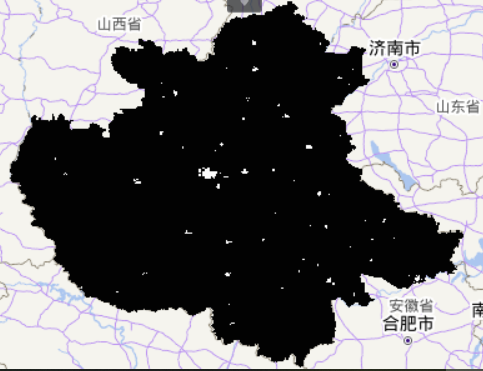
2018年中原城市群
#指定检索数据集,可设置检索的时间范围
dataset = aie.ImageCollection('NOAA_VIIRS_DNB_ANNUAL_V2_VCMSLCFG') \
             .filterDate("2018-01-01", "2018-12-31")
imgs = dataset.select(['average'])
imgs = imgs.mosaic()
imgs = imgs.clip(geometry)
DN_mean_2018 = imgs.reduceRegion(aie.Reducer.mean())
DN_mean_2018.getInfo()
DN_mean_2018 = DN_mean_2018.getInfo()['average_mean']
city_2018 = imgs.gte(aie.Image.constant(20))
mask_params = {
    'bands': 'average',
    'min': 0,
    'max': 1,
    'paletee':['#000000','#ffffff']
}
map.addLayer(
    city_2018,
    mask_params,
    'city_2018',
    bounds=city_2018.getBounds()
)
map
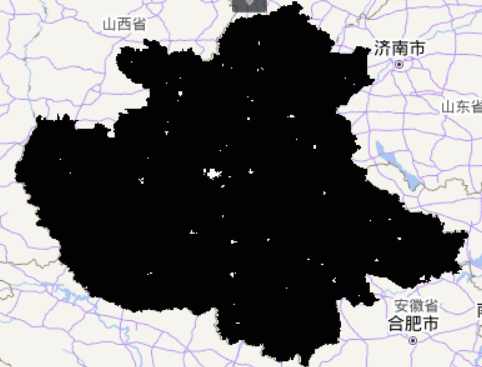
2016年中原城市群
#指定检索数据集,可设置检索的时间范围
dataset = aie.ImageCollection('NOAA_VIIRS_DNB_ANNUAL_V2_VCMSLCFG') \
             .filterDate("2016-01-01", "2016-12-31")
imgs = dataset.select(['average'])
imgs = imgs.mosaic()
imgs = imgs.clip(geometry)
DN_mean_2016 = imgs.reduceRegion(aie.Reducer.mean())
DN_mean_2016.getInfo()
DN_mean_2016 = DN_mean_2016.getInfo()['average_mean']
city_2016 = imgs.gte(aie.Image.constant(20))
mask_params = {
    'bands': 'average',
    'min': 0,
    'max': 1,
    'paletee':['#000000','#ffffff']
}
map.addLayer(
    city_2016,
    mask_params,
    'city_2016',
    bounds=city_2016.getBounds()
)
map
2014年中原城市群
#指定检索数据集,可设置检索的时间范围
dataset = aie.ImageCollection('NOAA_VIIRS_DNB_ANNUAL_V2_VCMSLCFG') \
             .filterDate("2014-01-01", "2014-12-31")
imgs = dataset.select(['average'])
imgs = imgs.mosaic()
imgs = imgs.clip(geometry)
DN_mean_2014 = imgs.reduceRegion(aie.Reducer.mean())
DN_mean_2014.getInfo()
DN_mean_2014 = DN_mean_2014.getInfo()['average_mean']
city_2014 = imgs.gte(aie.Image.constant(20))
mask_params = {
    'bands': 'average',
    'min': 0,
    'max': 1,
    'paletee':['#000000','#ffffff']
}
map.addLayer(
    city_2014,
    mask_params,
    'city_2014',
    bounds=city_2014.getBounds()
)
map
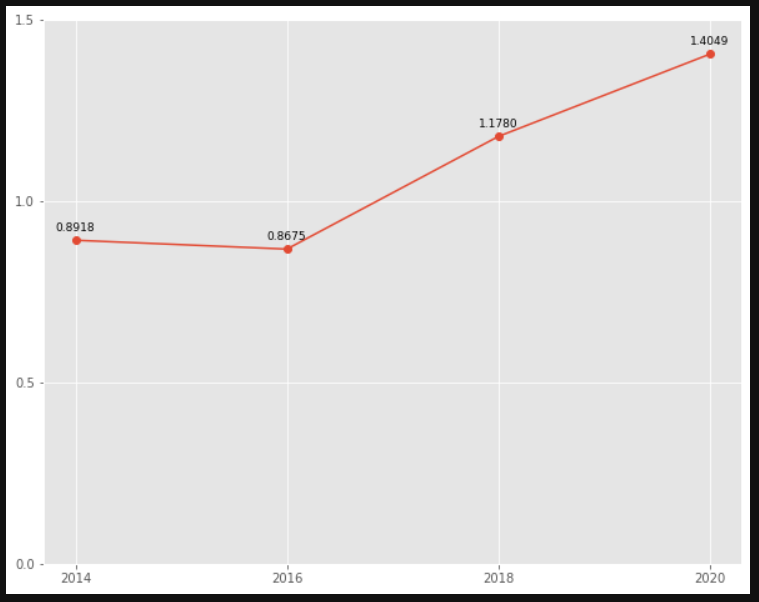
平均灯光亮度变化
import numpy as np
import matplotlib.pyplot as plt
plt.style.use('ggplot')
x = np.array([2014,2016,2018,2020])
Y = np.array([DN_mean_2014,DN_mean_2016,DN_mean_2018,DN_mean_2020])
plt.figure(figsize=(10,8))
ax = plt.gca()
ax.plot(x,Y,'o-')
ax.set_yticks([0,0.5,1,1.5])
ax.set_xticks([2014,2016,2018,2020])
for a,b in zip(x,Y):
    plt.text(a,b+0.02,'%.4f'%b,ha='center',va='bottom',fontsize=9)
建成区面积变化
比如还可以做建成区面积的变化对比,这方面还不太支持,所以知识给大家一个思路,还比如 CNLI 的区域整体城镇化水平动态演化。还有就是阈值的确定还不够合理,大家应该有更加合理确定阈值的方法,本次案例主要引用了《城市与区域规划空间分析实验教程》(第3版)中的实验13。
