Fuzzy模糊推导(Matlab实现)
问题呈述
在模糊控制这门课程中,学到了与模糊数学及模糊推理相关的内容,但是并不太清楚我们在选择模糊规则时应该如何处理,是所有的规则都需要由人手工选择,还是仅需要选择其中的一部分就可以了。因此,在课程示例的基础上做了如下的探究。
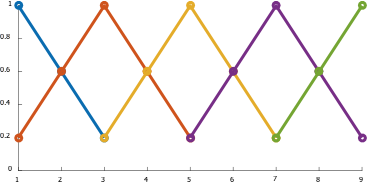
设计一个以E、EC作为输入,U作为输出的模糊推理系统,令E、EC、U的隶属度函数为如下:

| 1 | 0.6 | 0.2 | 0 | 0 | 0 | 0 | 0 | 0 |
|---|---|---|---|---|---|---|---|---|
| 0.2 | 0.6 | 1 | 0.6 | 0.2 | 0 | 0 | 0 | 0 |
| 0 | 0 | 0.2 | 0.6 | 1 | 0.6 | 0.2 | 0 | 0 |
| 0 | 0 | 0 | 0 | 0.2 | 0.6 | 1 | 0.6 | 0.2 |
| 0 | 0 | 0 | 0 | 0 | 0 | 0.2 | 0.6 | 1 |
分别给定“中心十字规则”以及“最强对角线规则”作为初始规则,观察由此推导出的结果,以验证初始模糊规则库应该如何选择。
结果
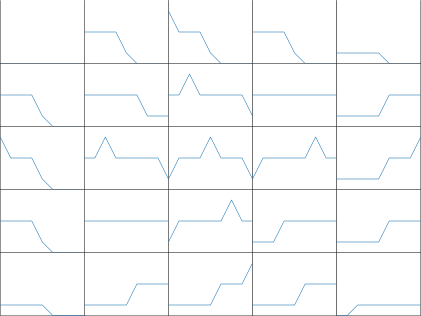
中心十字规则

其中,列索引代表E,行索引代表EC,中间的数据区域代表U。1代表负大(NB),2代表负中(NM),3代表零(Z),4代表正中(PB),5代表正大(PB)。

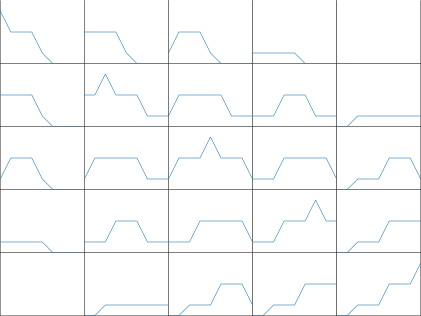
最强对角线


结果分析
从上面的结果可以分析得出:
- 当提供部分规则时,其它规则可由这些规则导出;
- 强对角线规则作为初始规则时,推导效果较好;
- 在强对角线中,左下角和右上角的隶属度为零,这与人的主观判断相同,即“误差正大,但是误差速度为负大,即误差减小(趋于零)的速度最大”,此时不应有主观判断,即维持原态即可。
Additional
tight_subplot.m
function ha = tight_subplot(Nh, Nw, gap, marg_h, marg_w)

% tight_subplot creates "subplot" axes with adjustable gaps and margins
%
% ha = tight_subplot(Nh, Nw, gap, marg_h, marg_w)
%
%   in:  Nh      number of axes in hight (vertical direction)
%        Nw      number of axes in width (horizontaldirection)
%        gap     gaps between the axes in normalized units (0...1)
%                   or [gap_h gap_w] for different gaps in height and width
%        marg_h  margins in height in normalized units (0...1)
%                   or [lower upper] for different lower and upper margins
%        marg_w  margins in width in normalized units (0...1)
%                   or [left right] for different left and right margins
%
%  out:  ha     array of handles of the axes objects
%                   starting from upper left corner, going row-wise as in
%                   going row-wise as in
%
%  Example: ha = tight_subplot(3,2,[.01 .03],[.1 .01],[.01 .01])
%           for ii = 1:6; axes(ha(ii)); plot(randn(10,ii)); end
%           set(ha(1:4),'XTickLabel',''); set(ha,'YTickLabel','')

% Pekka Kumpulainen 20.6.2010   @tut.fi
% Tampere University of Technology / Automation Science and Engineering


if nargin<3; gap = .02; end
if nargin<4 || isempty(marg_h); marg_h = .05; end
if nargin<5; marg_w = .05; end

if numel(gap)==1;
    gap = [gap gap];
end
if numel(marg_w)==1;
    marg_w = [marg_w marg_w];
end
if numel(marg_h)==1;
    marg_h = [marg_h marg_h];
end

axh = (1-sum(marg_h)-(Nh-1)*gap(1))/Nh;
axw = (1-sum(marg_w)-(Nw-1)*gap(2))/Nw;

py = 1-marg_h(2)-axh;

ha = zeros(Nh*Nw,1);
ii = 0;
for ih = 1:Nh
    px = marg_w(1);

    for ix = 1:Nw
        ii = ii+1;
        ha(ii) = axes('Units','normalized', ...
            'Position',[px py axw axh], ...
            'XTickLabel','', ...
            'YTickLabel','');
        px = px+axw+gap(2);
    end
    py = py-axh-gap(1);
end
中心十字规则
clc;
E = [1,0.6,0,0,0,0,0,0,0;0.2,0.6,1,0.6,0.2,0,0,0,0;0,0,0.2,0.6,1,0.6,0.2,0,0;0,0,0,0,0.2,0.6,1,0.6,0.2;0,0,0,0,0,0,0.2,0.6,1];
EC = E;
U = E;


% ----------------------------------------------------------------------------------
% Calculate R
% Deduct relationship
% ----------------------------------------------------------------------------------
R = zeros(81,9);
for i = 1:5
	A = E(i,:)';
	B = EC(3,:);
	C = U(i,:);
	AB = min(repmat(A,1,9), repmat(B,9,1));
	AB = reshape(AB, [81,1]);
	RC = min(repmat(AB,1,9), repmat(C, 81,1));
	R = max(R,RC);
end

for i = [1,2,4,5]
	A = E(3,:)';
	B = EC(i,:);
	C = U(i,:);
	AB = min(repmat(A,1,9), repmat(B,9,1));
	AB = reshape(AB, [81,1]);
	RC = min(repmat(AB,1,9), repmat(C, 81,1));
	R = max(R,RC);
end

% ----------------------------------------------------------------------------------
% Calculate C
% Relationship induction
% ----------------------------------------------------------------------------------

C = zeros(9,5,5);
for i = 1:5
	for j = 1:5
		A = E(i,:)';
		B = EC(j,:);
		AB = min(repmat(A,1,9), repmat(B,9,1));
		AB = reshape(AB, [81,1]);
		C(:,i,j) = max(min(repmat(AB, 1, 9), R));
	end
end

% ----------------------------------------------------------------------------------
% Plot
% ----------------------------------------------------------------------------------
figure(2);clf;
x = (1:9)/9;
ha = tight_subplot(5,5,[.0 .0],[.0 .0],[.0 .0]);
for i = 1:5
	for j = 1:5
		axes(ha(i*5-5+j));
		h = plot(x, C(:,i,j));
		ylim([0,1.2]);
		xlim([min(x), max(x)]);
		set(gca,'XTick',[])
		set(gca,'YTick',[])
	end
end
最强对角线规则
clc;
E = [1,0.6,0,0,0,0,0,0,0;0.2,0.6,1,0.6,0.2,0,0,0,0;0,0,0.2,0.6,1,0.6,0.2,0,0;0,0,0,0,0.2,0.6,1,0.6,0.2;0,0,0,0,0,0,0.2,0.6,1];
EC = E;
U = E;


% ----------------------------------------------------------------------------------
% Calculate R
% Deduct relationship
% ----------------------------------------------------------------------------------
R = zeros(81,9);
for i = 1:5
	A = E(i,:)';
	B = EC(i,:);
	C = U(i,:);
	AB = min(repmat(A,1,9), repmat(B,9,1));
	AB = reshape(AB, [81,1]);
	RC = min(repmat(AB,1,9), repmat(C, 81,1));
	R = max(R,RC);
end


% ----------------------------------------------------------------------------------
% Calculate C
% Relationship induction
% ----------------------------------------------------------------------------------

C = zeros(9,5,5);
for i = 1:5
	for j = 1:5
		A = E(i,:)';
		B = EC(j,:);
		AB = min(repmat(A,1,9), repmat(B,9,1));
		AB = reshape(AB, [81,1]);
		C(:,i,j) = max(min(repmat(AB, 1, 9), R));
	end
end

% ----------------------------------------------------------------------------------
% Plot
% ----------------------------------------------------------------------------------
figure(2);clf;
x = (1:9)/9;
ha = tight_subplot(5,5,[.0 .0],[.0 .0],[.0 .0]);
for i = 1:5
	for j = 1:5
		axes(ha(i*5-5+j));
		h = plot(x, C(:,i,j));
		ylim([0,1.2]);
		xlim([min(x), max(x)]);
		set(gca,'XTick',[])
		set(gca,'YTick',[])
	end
end
模糊合成的定义
设\(P\)是\(U\times V\) 上的模糊关系,\(Q\)是\(V\times W\)上的模糊关系,则\(R\)是\(U\times W\)上的模糊关系,它是\(P\circ Q\)的合成,其隶属函数被定义为
若式中牌子\(\wedge\)代表“取小–\(\min\)”,\(\vee\)代表“取大–\(\max\)”,这种合成关系即为最大值\(\cdot\)最小值合成,合成关系\(R=P\circ Q\)。
示例:
则\(A\circ B=\begin{bmatrix}0.5 & 0.6\\ 0.3 & 0.3 \end{bmatrix}\), \(B\circ A=\begin{bmatrix}{0.1} & {0.2} & {0.2}\\ {0.3} & {0.3} & {0.3}\\ {0.4} & {0.5} & {0.5} \end{bmatrix}\)。
有定义为
模糊推导示例
已知一个双输入单输出的模糊系统,其输入量为\(x\)和\(y\),输出量为\(z\),其输入输出的关系可用如下两条模糊规则描述:
-
\(R_{1}\):如果\(x\)是\(A_{1}\) and \(y\)是\(B_{1}\),则\(z\)是\(C_{1}\)
-
\(R_{2}\):如果\(x\)是\(A_{2}\) and \(y\)是\(B_{2}\),则\(z\)是\(C_{2}\)

(感觉被恶心到了,不知道为什么这儿的array环境始终出不来)
现已知输入\(x\)为\(A'\), \(y\)为\(B’\),试求输出量。

将其按行展开得(把矩阵压扁为一行向量)
同理:
总的蕴含关系为
计算输入量的模糊集合


 浙公网安备 33010602011771号