
使用App Metrics实现性能监控
App Metrics监控需要安装InfluxDB时序数据库和Grafana可视化分析工具
1.安装InfluxDB
下载地址:https://portal.influxdata.com/downloads/#influxdb
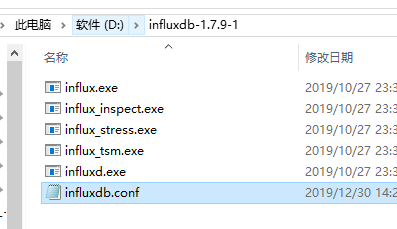
我这里下载的是Windows版本的。
解压influxdb,编辑influxdb.conf,配置相关路径
[meta]
  # Where the metadata/raft database is stored
  dir = "D:/influxdb/meta"

[data]
  # The directory where the TSM storage engine stores TSM files.
  dir = "D:/influxdb/data"

  # The directory where the TSM storage engine stores WAL files.
  wal-dir = "D:/influxdb/wal"
配置http,第一次配置先将权限auth-enabled配置为false
[http]
  # Determines whether HTTP endpoint is enabled.
   enabled = true

  # Determines whether the Flux query endpoint is enabled.
  # flux-enabled = false

  # Determines whether the Flux query logging is enabled.
  # flux-log-enabled = false

  # The bind address used by the HTTP service.
   bind-address = ":8086"

  # Determines whether user authentication is enabled over HTTP/HTTPS.
   auth-enabled = false
用命令行进入当前influxdb目录,执行命令
influxd -config influxdb.conf

另开一个控制台命令行进入influxdb目录设置用户名和密码,运行命令:influx,连接到influx服务器

创建用户命令:
create user "use_name" with password 'user_password'
#创建用户并添加管理员权限
create user "admin" with password '123456' with all privileges
显示所有用户命令
show users

删除用户命令
drop user "user_name"
其他命令:
# 给普通用户授予管理员权限
GRANT ALL PRIVILEGES TO "user_name"

# 给用户指定数据库操作权限
GRANT [READ,WRITE,ALL] ON <database_name> TO <username>

GRANT ALL ON test TO "user_name"

# 撤回用户的管理员权限
REVOKE ALL PRIVILEGES FROM "user_name"

# 查看用户权限
show grants for "user_ame"

# 修改密码
set password for "user_name" = '123456789'
influxdb相关操作:https://www.jianshu.com/p/d9a16b42aa9f
然后将权限auth-enabled配置为true,关闭influxd命令的控制台,重新启动influxdb。
控制台命令行登录influxdb:
influx -host 127.0.0.1 -port 8086 -username "admin" -password "123456"
使用命令创建数据库:
CREATE DATABASE "AppMetricsDemo"
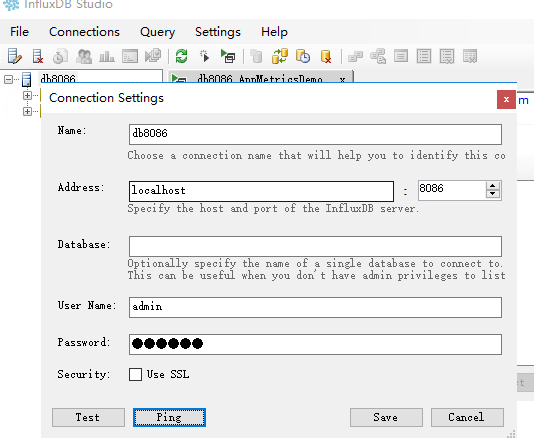
创建数据库可以使用数据库连接工具InfluxDBStudio,
InfluxDBStudio下载地址:https://github.com/CymaticLabs/InfluxDBStudio/releases
使用InfluxDBStudio连接数据库:
2.安装Grafana
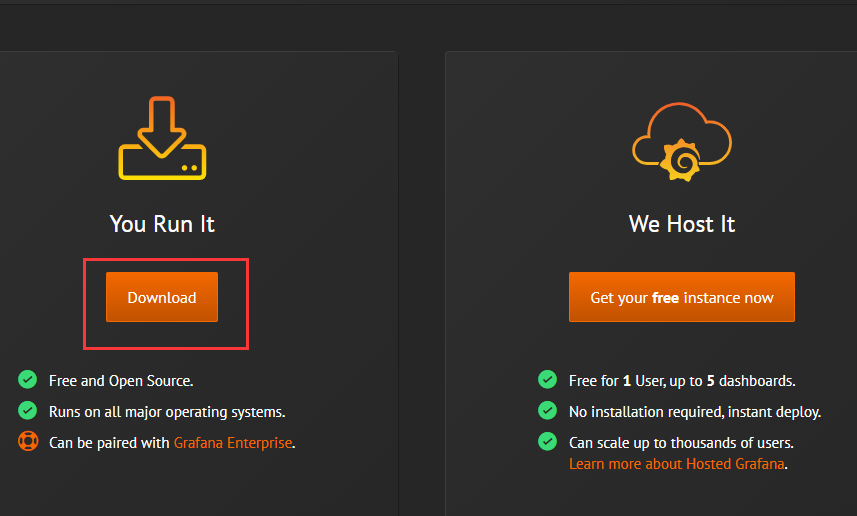
Grafana下载地址:https://grafana.com/get
下载开源版本的压缩包,或者Windows安装程序。
解压后运行grafana-server.exe
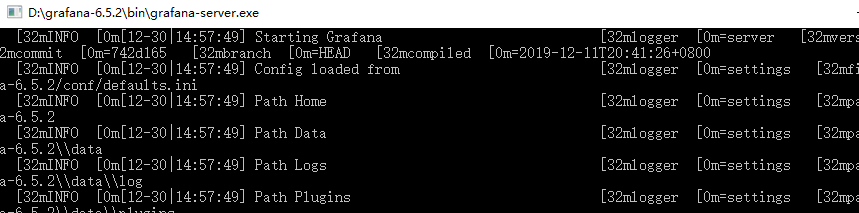
浏览器打开web版:http://localhost:3000
下载App Metrics的json监控配置文件,下载地址:https://grafana.com/grafana/dashboards/2140/revisions

然后导入App Metrics的Web Monitoring json配置文件
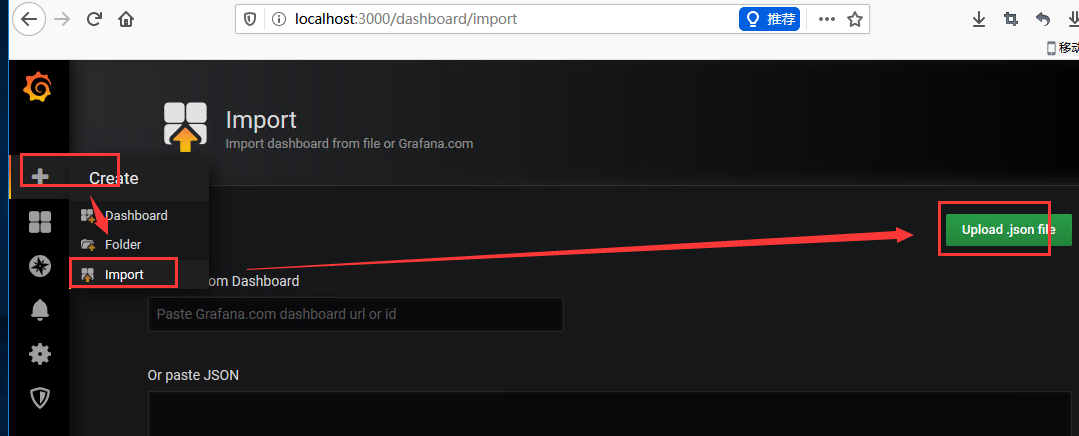
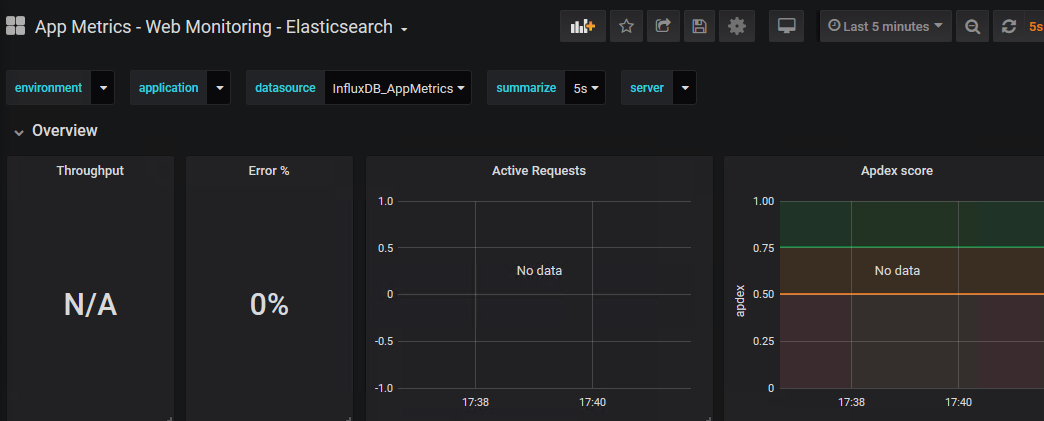
导入成功后就显示了实时监控的界面

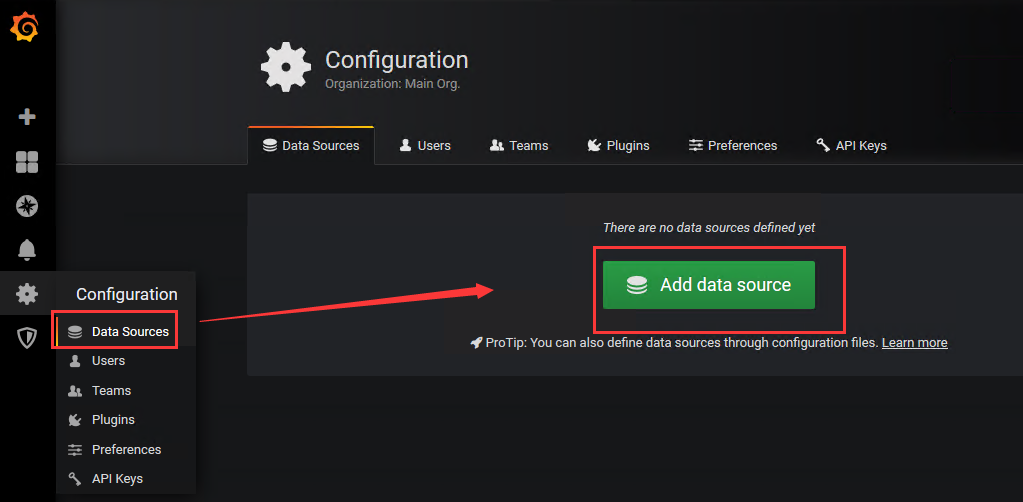
配置数据源,选择Data Sources ->Add data source,选择InfluxDB
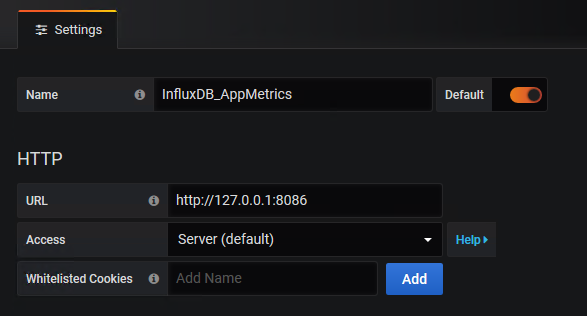

如果仪表盘没有数据源,则把仪表盘的数据源复制到datasource回车


3.在项目中添加App Metrics

 浙公网安备 33010602011771号