go学习笔记——pprof性能分析工具
可以使用pprof来分析golang程序的CPU性能,内存占用,block死锁,Goroutine性能等,pprof一般是在需要分析代码性能的时候才加入
1.分析Gin web服务的性能
可以使用 gin-contrib/pprof 这个工具,参考:Gin框架中使用pprof
添加依赖
go get github.com/gin-contrib/pprof@v1.4.0
在gin的路由上添加 pprof.Register(app)
package main

import (
    "net/http"

    "github.com/gin-contrib/pprof"
    "github.com/gin-gonic/gin"
)

func main() {
    app := gin.Default()

    // 性能分析
    pprof.Register(app)

    app.GET("/test", func(c *gin.Context) {
        c.String(http.StatusOK, "test")
    })
    app.Run(":3000")
}
启动web应用后访问如下path
http://localhost:3000/debug/pprof/
可以看到如下页面
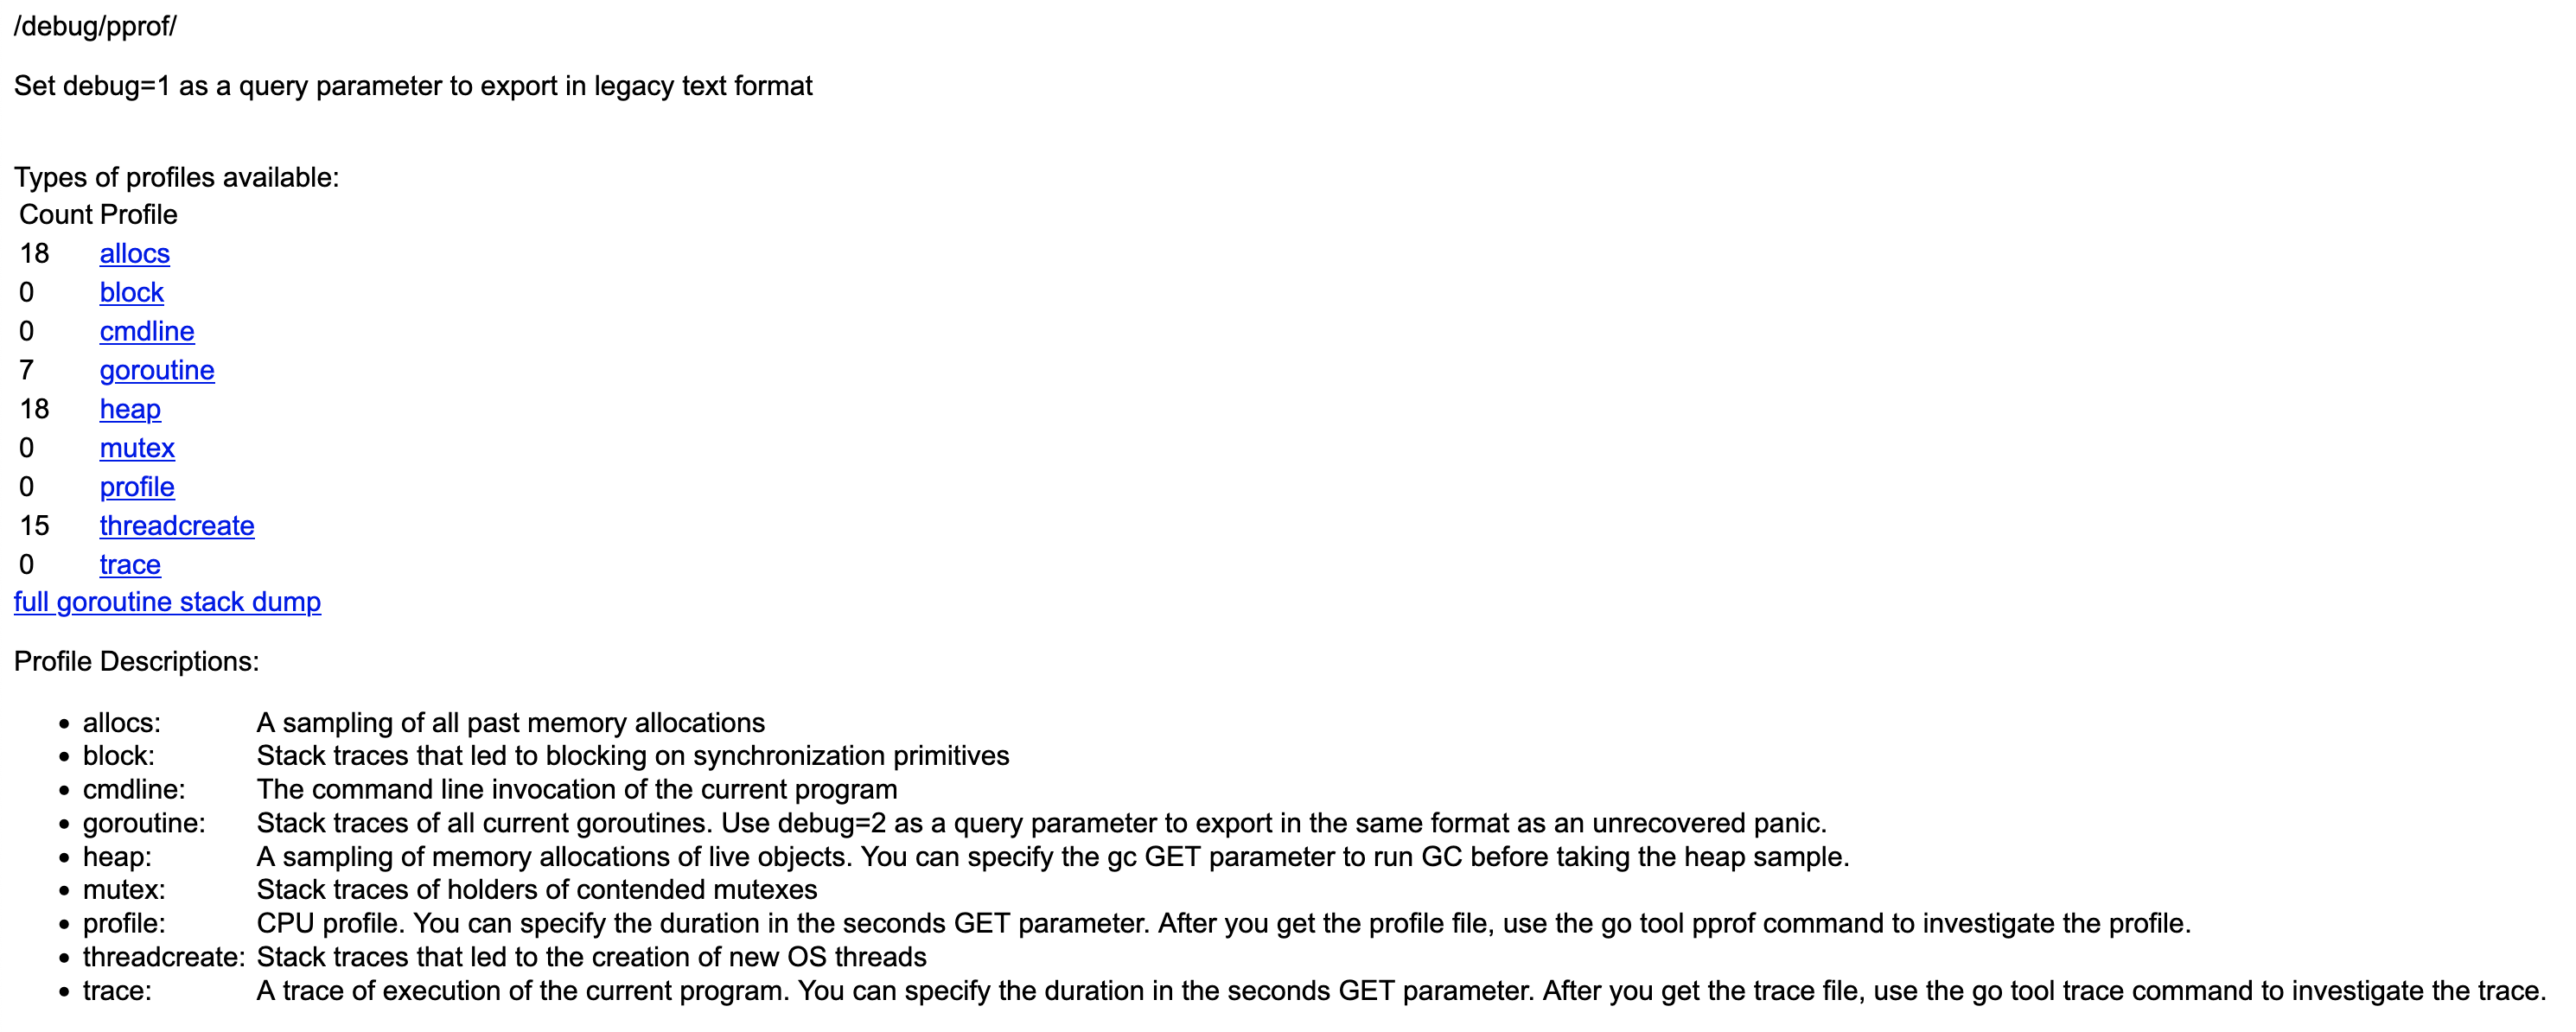
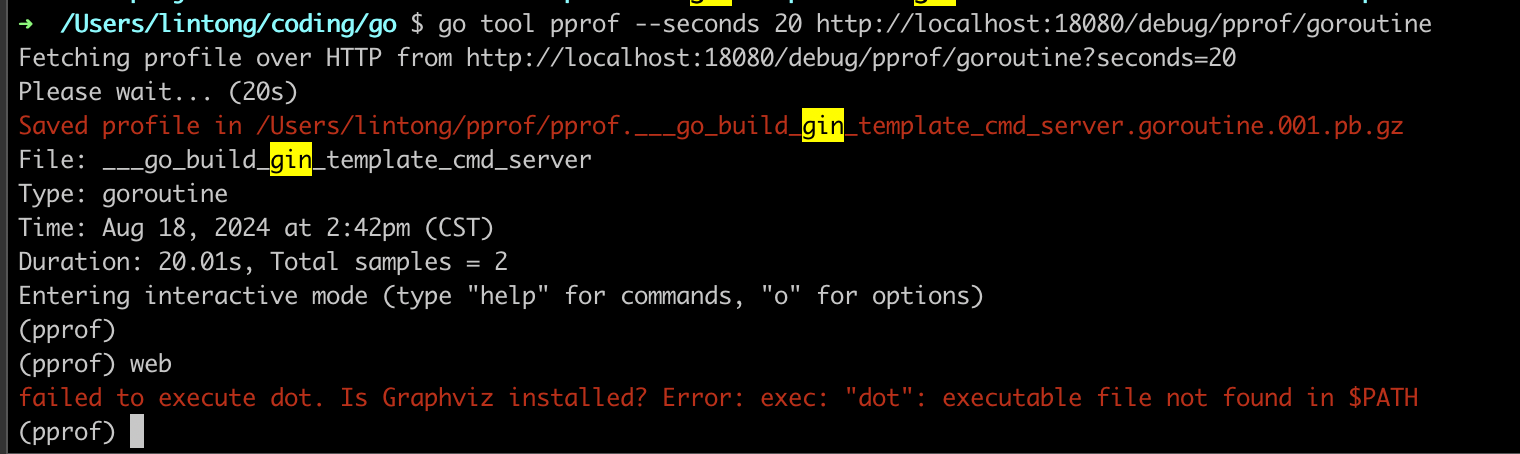
使用go tool pprof命令采集20s的goroutine(Goroutine 是 Go 语言中的一种轻量级线程,提供了并发执行代码的能力)指标数据,如果不设置采集时间是默认采集30s,每10ms采集一次
go tool pprof --seconds 20 http://localhost:18080/debug/pprof/goroutine
采集完毕后可以直接输入 web 来可视化查看数据,不过需要提前安装graphviz,否则会报 failed to execute dot. Is Graphviz installed? Error: exec: "dot": executable file not found in $PATH
brew install graphviz
如果使用brew安装graphviz失败的话,可以使用官方提供的编译安装的方式,我这边就是使用的这种方法
wget https://gitlab.com/api/v4/projects/4207231/packages/generic/graphviz-releases/12.0.0/graphviz-12.0.0.tar.gz
tar -zxvf graphviz-12.0.0.tar.gz

./configure
make
make install
参考:https://graphviz.org/download/source/
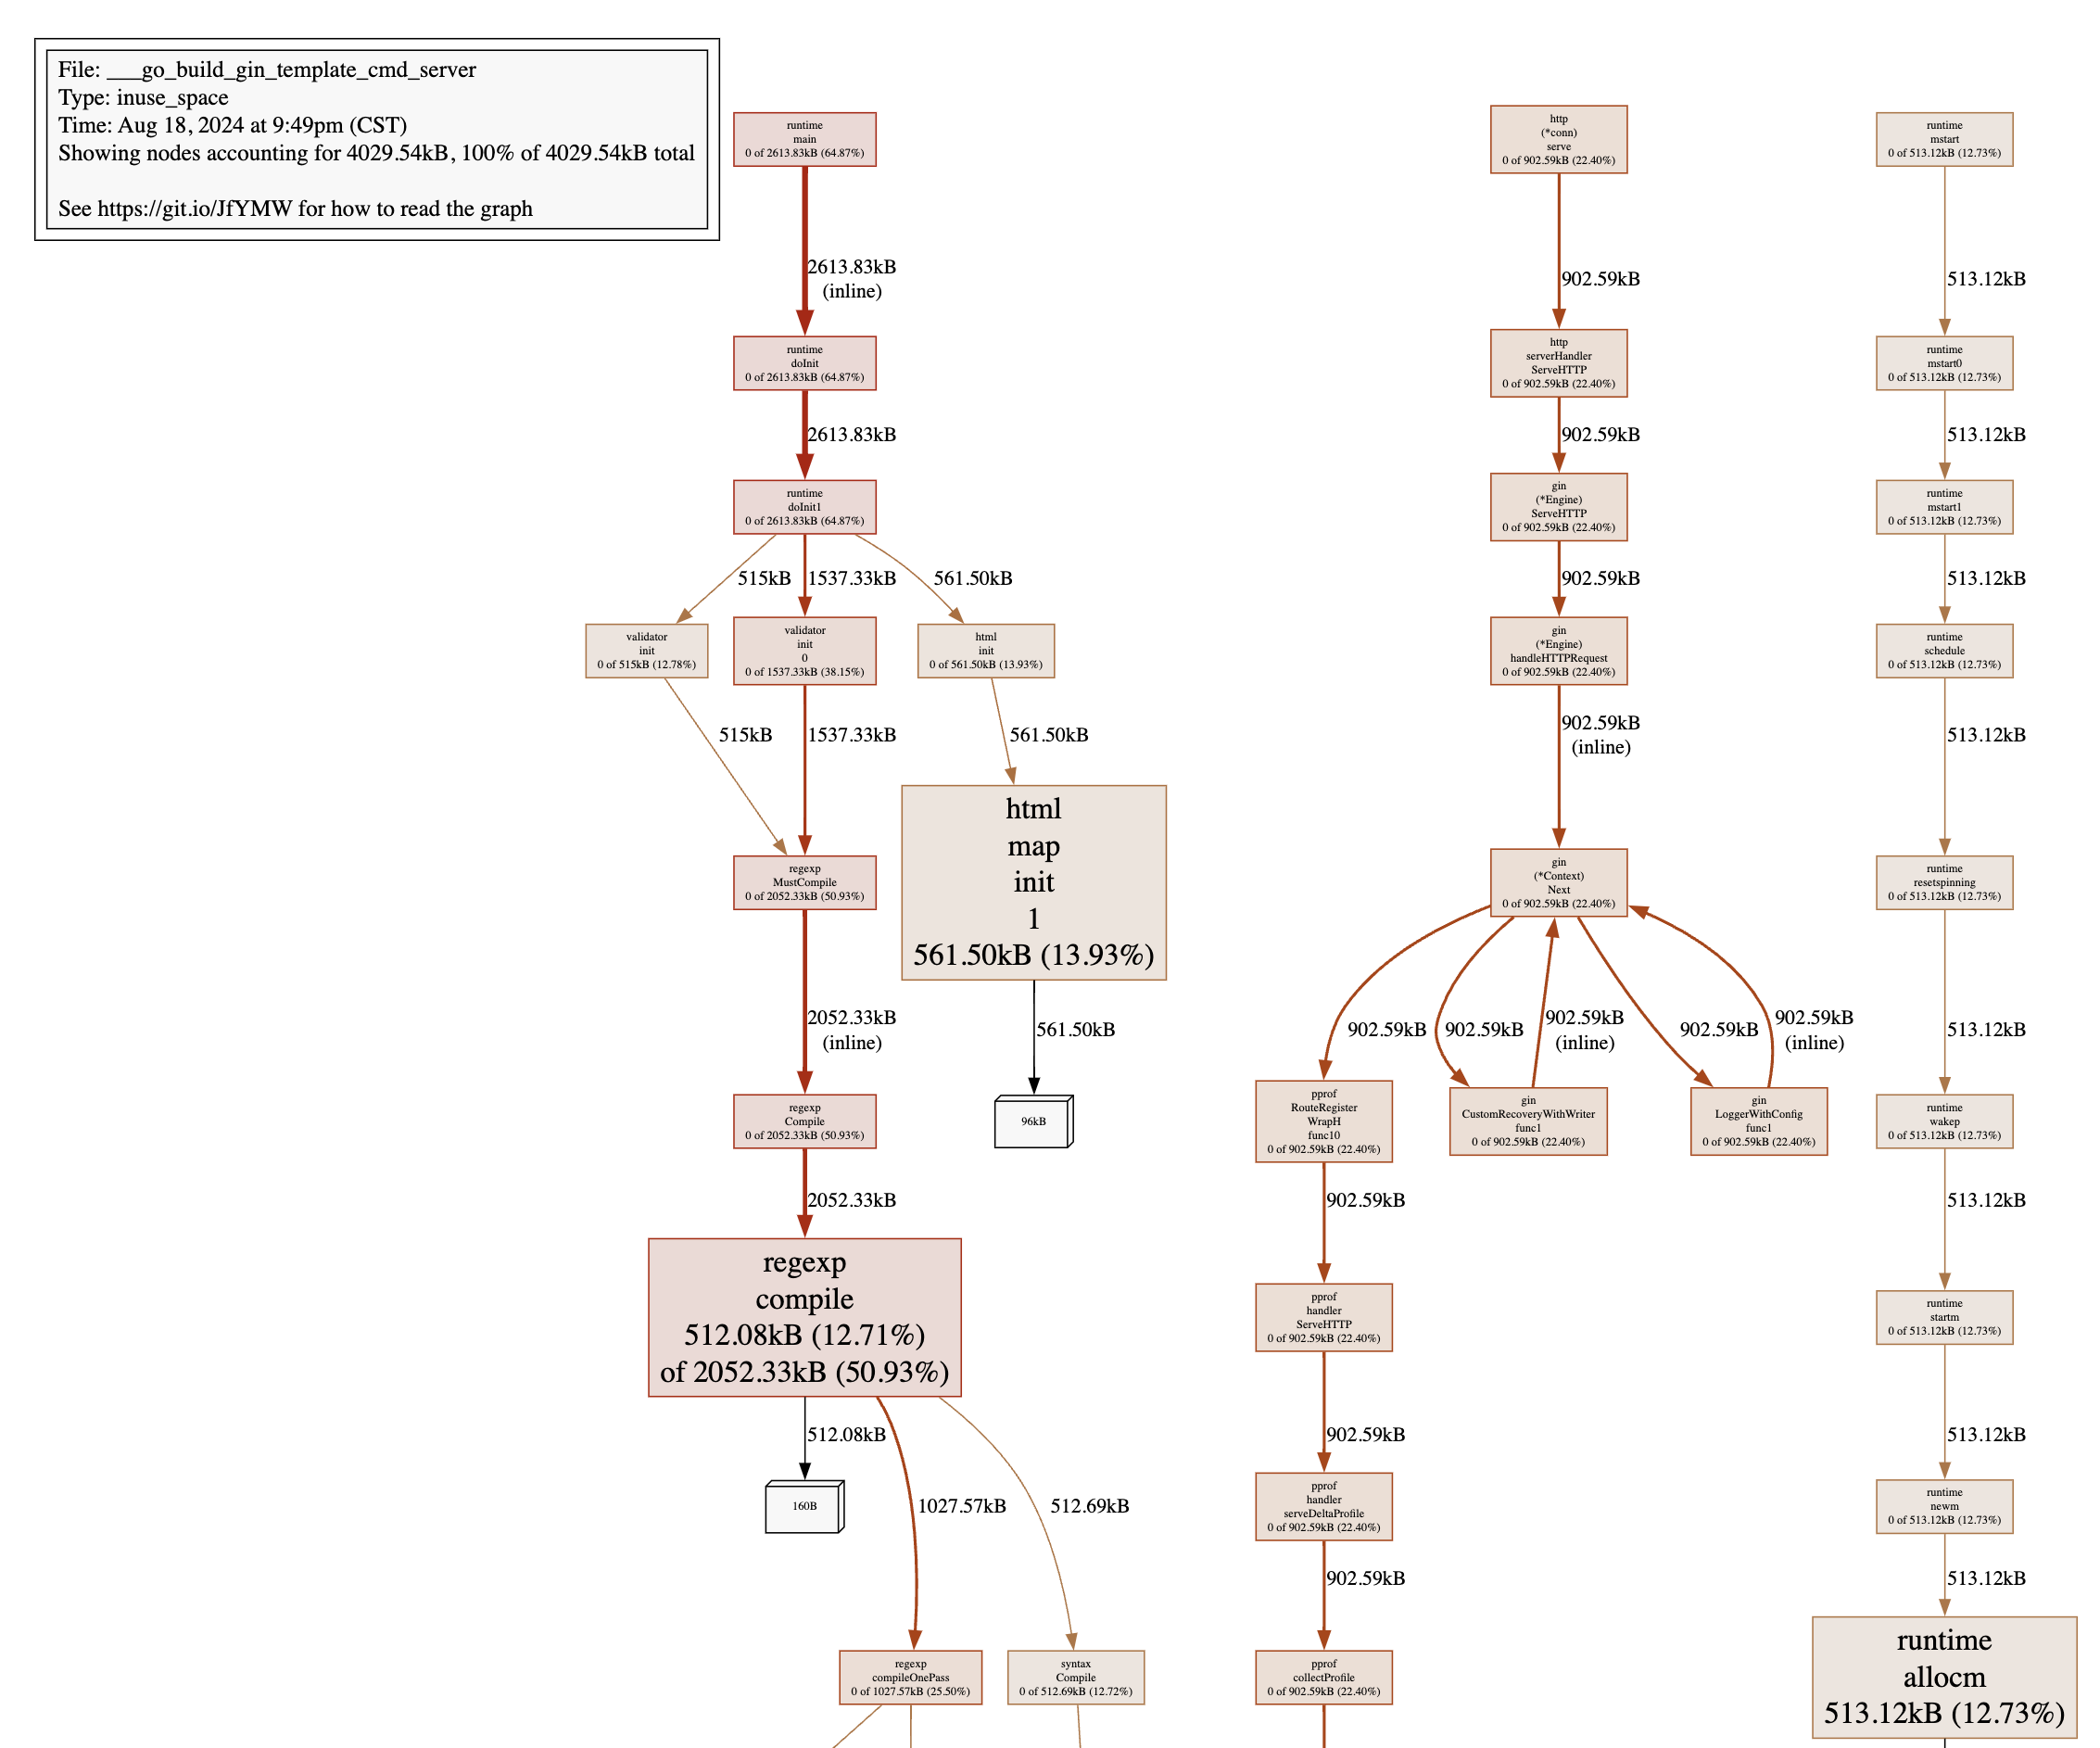
输入web,会弹出一个生成的svg文件,将其保存到文件后用浏览器打开,如下

当然也可以采集heap的数据
go tool pprof http://localhost:18080/debug/pprof/heap
如下
退出pprof可以输入
exit
2.分析http web服务的性能
如果是使用go自带的http包实现的web服务,可以通过添加 net/http/pprof 的方式来开启pprof
import _ "net/http/pprof"
如下
package main

import (
	"net/http"
	_ "net/http/pprof"
)

func main() {
	http.ListenAndServe("localhost:6060", nil)
}
之后访问
http://localhost:6060/debug/pprof/
3.分析CPU
参考:pprof 性能分析
4.分析内存
本文只发表于博客园和tonglin0325的博客,作者:tonglin0325,转载请注明原文链接:https://www.cnblogs.com/tonglin0325/p/6278991.html