
Pyechart——学习
环境:Deepin V20
Anaconda 2020.02
spyder 4.0.1
pyechart 1.7.1
第一步:安装
#安装pyechart
pip install pyecharts
#安装中国城市地图
pip install echarts-china-cities-pypkg
#安装中国省份地图
echarts-china-provinces-pypkg
第二步:获取数据
我从这里找的 http://www.5ppt.net/aricle.asp?id=2718
到最后我觉得我还不如用Excel倒入数据得了。目前只会一些极其笨的方法(用Python的话),还需要继续学习这些。
Ps:爬虫小白、numpy菜鸟。我也在想我还啥都不会我干嘛想到了这些方法。
第三步:开始做
参考的代码:
https://www.cnblogs.com/qi-yuan-008/p/12025305.html
-
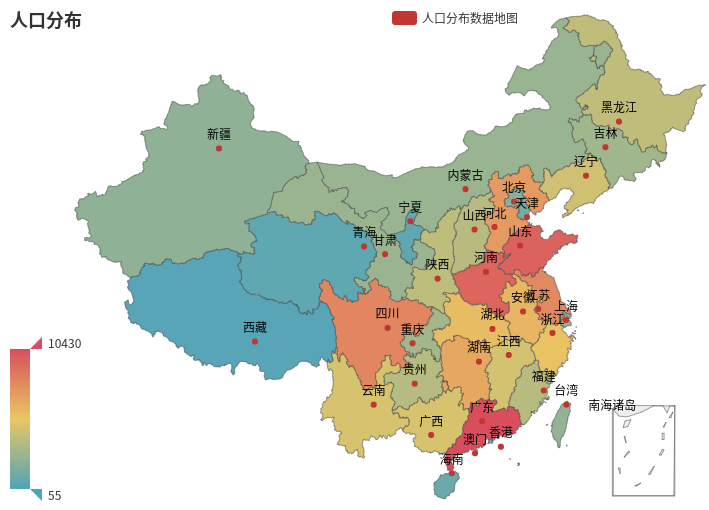
绘制最基本的数据地图:
#导入
from pyecharts import options as opts
from pyecharts.charts import Map

#数据
a1 = ['广东', '山东', '河南', '四川', '江苏', '河北', '湖南', '安徽', '湖北', '浙江', '广西',
        '云南', '江西', '辽宁', '黑龙江', '陕西', '山西', '福建', '贵州', '重庆', '吉林', '甘肃',
        '内蒙古', '台湾', '上海', '新疆', '北京', '天津', '海南', '香港', '宁夏', '青海',
        '西藏', '澳门']
a2 = [10430.03, 9579.31, 9402.36, 8041.82, 7865.99, 7185.42, 6568.37, 5950.1, 5723.77, 5442.0,
      4602.66, 4596.6, 4456.74, 4374.63, 3831.22, 3732.74, 3571.21, 3552.0, 3476.65, 2884.0,
      2746.22, 2557.53, 2470.63, 2316.2, 2301.391, 2181.33, 1961.2, 1293.82, 867.15, 709.76,
      630.14, 562.67, 300.21, 55.23]

def map_visualmap():
    c = (
        Map()
        .add("人口分布数据地图", [list(i) for i in zip(a1,a2)], "china")
        .set_global_opts(
            title_opts=opts.TitleOpts(title="人口分布"),
            visualmap_opts=opts.VisualMapOpts(max_= max(a2),min_=min(a2)),
        )
    )
    return c

if __name__ == '__main__':
    city_ = map_visualmap()
    city_.render(path="DataMap_test.html")
我遇到的一个问题:生成的HTML文件打开实在是太慢了。所以接着找到了这个 https://blog.csdn.net/qq_38316655/article/details/104489019
出处是 https://github.com/pyecharts/pyecharts-assets 的 README.md 。
pyecharts-assets
pyecharts-assets 提供了 pyecharts 的静态资源文件。
可通过 localhost-server 或者 notebook-server 启动本地服务。首先将项目下载到本地
# 通过 git clone
$ git clone https://github.com/pyecharts/pyecharts-assets.git
# 或者直接下载压缩包
$ wget https://github.com/pyecharts/pyecharts-assets/archive/master.zip
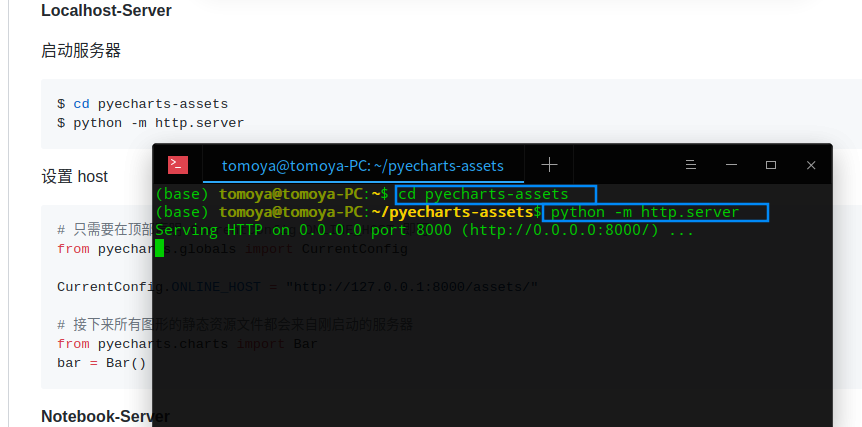
Localhost-Server
启动服务器
$ cd pyecharts-assets
$ python -m http.server
设置 host
# 只需要在顶部声明 CurrentConfig.ONLINE_HOST 即可
from pyecharts.globals import CurrentConfig
CurrentConfig.ONLINE_HOST = "http://127.0.0.1:8000/assets/"
# 接下来所有图形的静态资源文件都会来自刚启动的服务器
from pyecharts.charts import Bar
bar = Bar()
我按着它的步骤操作了,但是我是实在是不懂设置host 怎么操作,我就乱操作。就是执行图片上的那两个命令(如图)在后台一直开着,接着在上面的代码文件导入库的上面加上这两行
from pyecharts.globals import CurrentConfig
CurrentConfig.ONLINE_HOST = "http://127.0.0.1:8000/assets/"
接着我就发现可以很快速的打开那个HTML文件了。
