
v-charts 自定义堆叠面积图背景颜色
下载
npm i v-charts -S
main.js引入
import VeLine from 'v-charts/lib/line.common'
Vue.component(VeLine.name, VeLine)
使用
<ve-line :data="chartData" :settings="chartSettings"></ve-line>
export default {
  data() {
    this.yearSettings = {
yAxisType: ['percent'],
labelMap: {
'value': 'APR'
},
lineStyle:{
width: 1,
color: '#00E789'
},
      area: true, //是否展示为面积图
      itemStyle: { //面积图颜色设置
        color: {
          type: 'linear',
          x: 0,
          y: 0,
          x2: 0,
          y2: 1,
          colorStops: [
            {
              offset: 0, //offset 可取范围 0、0.1、0.2、到1
              color: 'rgba(0, 231, 137, 0.4)', // 0% 处的颜色
            },
            {
              offset: 1,
              color: 'rgba(255, 255, 255, 0)' // 100% 处的颜色
            }
          ],
          globalCoord: false // 缺省为 false
        }
      }
    }
  }
}
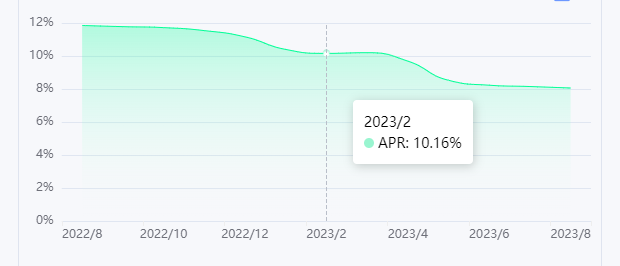
最终效果
更多的配置项目参考 https://echarts.apache.org/zh/option.html#title

 浙公网安备 33010602011771号