

[SAP HANA] HANA trace管理
- tracle 类型
- tracle 配置
- tracle 级别
- SQL tracle
- Performance Trace
- Expensive Statements Trace
- Kernel profiler
- Plan trace
- dump
1.Tracle
tracle 类型
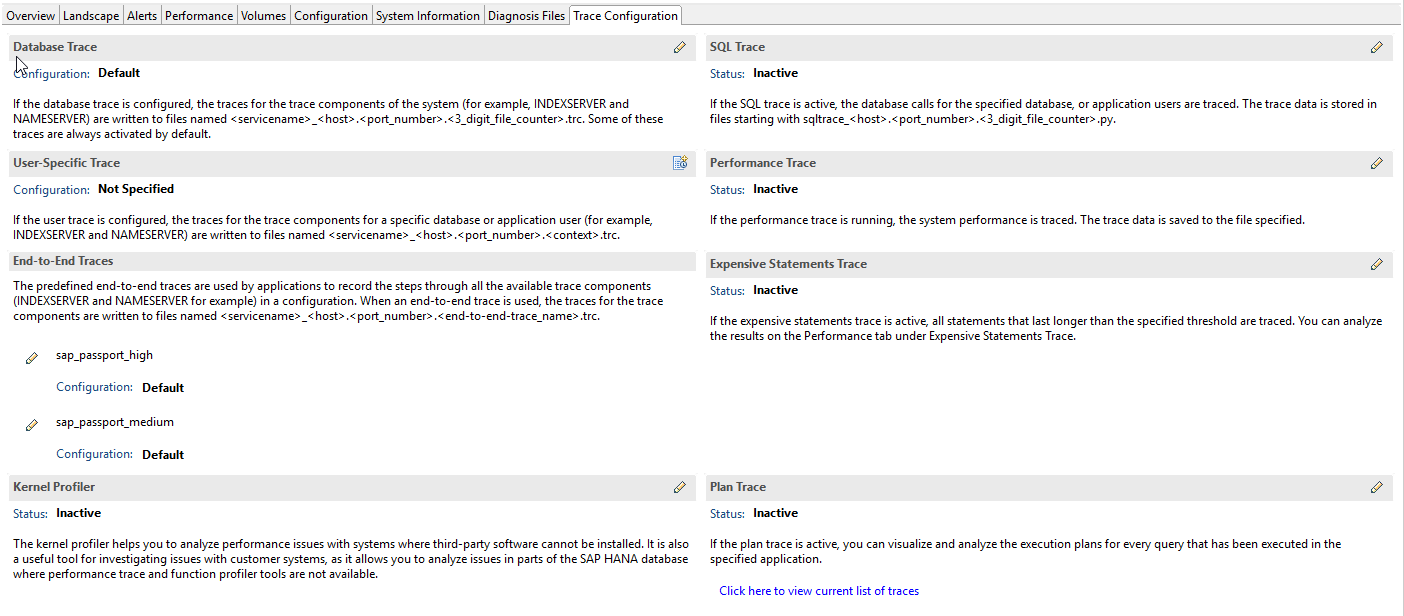
| Database Trace | default active | confingure: global.ini(for all services) or services specific files such as indexserver.ini SAP NOTE 2380176 |
| SQL trace | default Inactive | SQL trace collect information about all SQL statements executed on the index server(tenant Db)/name server(system db). |
| Performance Trace | default Inactive | |
| Expensive Statement trace | default Inactive | |
| Plan trace | default Inactive | |
| kernel profile | default Inactive | collects inforamtion about requent and/or expensive execution paths during qurey processing |
| User-specfic trace |
2.如何配置:
权限要求:特权TRACE ADMIN
配置 kernel profile: role SAP_INTERNAL_HANA_SUPPORT
配置工具: SAP HANA COCKPIT 或SAP HANA IDE
if
a a trace component is available in all sevices,the trace level can be
configured for all servcies at once.it is also possible to configure the
trace level
of a component individually for a specific service. the
tracel level of a component configured at servcies level overrides the
tracel level configured for all services.
some conponents are only available in a particular service and cannot therefore be changed globally.
3.trace 级别:
NONE (0)/FATAL(1)/ERROR(2)/WARNING(3)/INFO(4)/DEBUG(5)
evan if you select trace level NONE,inforamtion about error situations is still recorded.
4.SQL trace
is
saved as an executable python program(by default
sqltrace_<...>.py),which can be used to replay the traced db
oeprations.
can use SQL trace ANalyzer tool to autmate the anlysis of the file.
SAP Note 2412519 FAQ:SAP HANA SQL Trace analyzer
5. Performance Trace
files .tpp or .cpt
alter system start perftrace
6. Expensive Statements Trace inforamtion
need TRACE ADMIN , M_EXPENSIVE_STATEMENTS
Enable global.ini parameter expensive_statement
7. Kernel profiler
Need SAP_INTERNAL_HANA_SUPPORT, active in SAP HANA DB explorer
file:
CPU_<service>_<host>_<port>_<timestamp>.<format>
WAIT_<service>_<host>_<port>_<timestamp>.<format>
KCacheGrind or DOT
8. Plan trace only select statement are traced
global.ini parameter maxfiles and maxfilesize control the the trace log roatation.
9. Generate full system dump
<sid>adm ,cdpy navigate to python_support

python fullsystemInfoDump.py #located in $DIR_INSTANCE/exe/python_support

