pytorch 怎么用tensorboard 可视化
参考链接:
https://mp.weixin.qq.com/s?__biz=MzI5MDUyMDIxNA==&mid=2247514888&idx=2&sn=3884cf50b88eaee6744d35cb528c0fa7&chksm=ec1c56f1db6bdfe7585830d13a3673648c1b9f5098af15d53e4efb96e16a1b22003b1b56ba43&mpshare=1&scene=1&srcid=1103IwBjWjTF3h8l3Smh5ohu&sharer_sharetime=1604478585079&sharer_shareid=3839dc73cba9ba6f5a6eb2fee58f300f&key=966b233910e1aa6df0e367067aa3169852053729d9052e5342c78c9521b069153beb74b5e5136bf692087ad3f33b8e74113962a2cb47ef61279a45edfb79e1a1f8e2a1f99ffb03b137b906f25ce6b92abd156e73faa83b558301cfaf0612deeca4803458512fba340ae9f489ef073cf96c4031c2bd491bf7f53d3a58c3d2cc62&ascene=1&uin=MjAyMjA0NjY3MA%3D%3D&devicetype=Windows+10+x64&version=6300002f&lang=zh_CN&exportkey=AwmXeExcmzVZ1BaQZJvCJ3o%3D&pass_ticket=jMBlpDzYyeU7%2BXpQJxN0X6ddKC13bpbPaoJh%2FjGTz2GR%2BAB4Bu7Rui39ieh3Oxic&wx_header=0
https://blog.csdn.net/bigbennyguo/article/details/87956434
https://blog.csdn.net/zouxiaolv/article/details/105192739
https://pytorch.apachecn.org/docs/1.2/tensorboard.html
https://gist.github.com/anonymous/bf16430f7750c023141c562f3e9f2a91
https://github.com/lanpa/tensorboardX/blob/master/README.md
https://blog.csdn.net/goldxwang/article/details/76855200 Matplotlib调用imshow()函数绘制热图
首先进行环境的配置
我的基本环境:ubuntu 16 py3.6

安装对应的tensorboard tensorboard X ,还有tensorflow-gpu
具体的方法可参考本文开头的第一篇链接
如果出现
启动Tensorboard时发生错误:class BeholderHook(tf.estimator.SessionRunHook): AttributeError: module 'tensorflow.python.estimator.estimator_lib' has no attribute 'SessionRunHook'
主要原因是tensorflow 和tensorboard的版本不一致(要做到上面截图红线所示)
如果出现
cl@gxz:~/visual$ python test.py
[W common_gpu.cc:35] Insufficient cuda driver. Cannot use cuda.
这是因为cuda 和torch 的版本不对应,具体可参考https://www.cnblogs.com/tingtin/p/13900424.html
具体实现过程:
1.
代码:
from tensorboardX import SummaryWriter

# Creates writer1 object.
# The log will be saved in 'runs/exp'
writer1 = SummaryWriter('runs/exp1')


for i in range(10):
    writer1.add_scalar('quadratic', i**2, global_step=i)
    writer1.add_scalar('exponential', 2**i, global_step=i)
需要先运行代码,生成

2.命令行执行:tensorboard --logdir=<your_log_dir> #这里需要注意your_log_dir 为
writer1 = SummaryWriter('runs/exp1')
此时的tensorboard --logdir='runs/exp1'
来开启tensorboard

3.那么现在可以在浏览器地址栏输入相应地址
如果是服务器需要服务器地址+端口号 ,如:http://192.1.27.110:6006/
如果输入相关地址后没反应,可以参考 https://blog.csdn.net/index20001/article/details/82871634
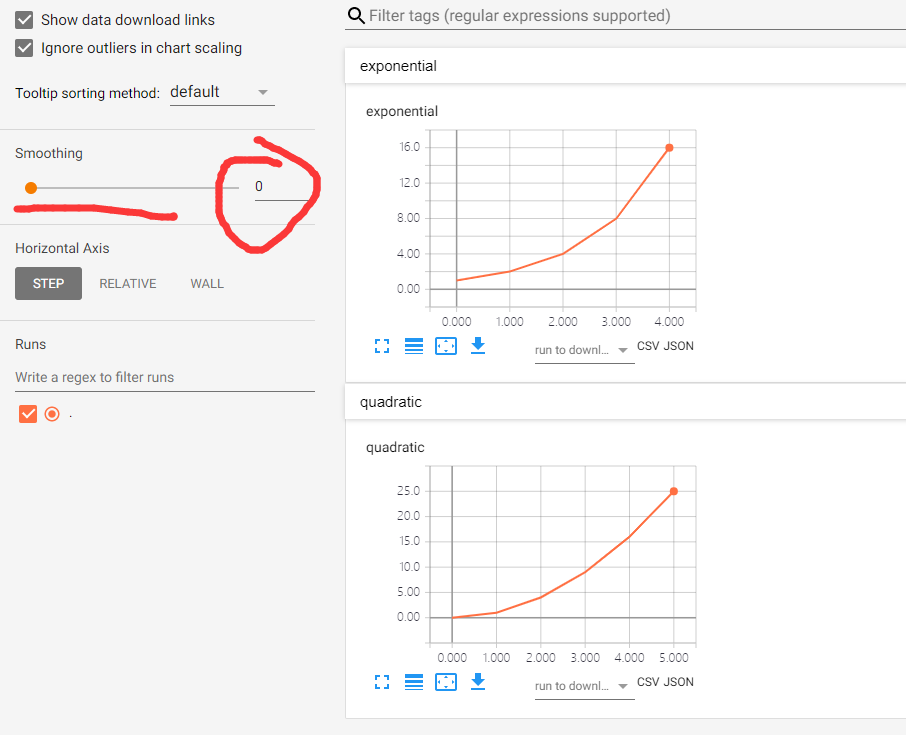
注意:这里的 Smoothing =0 ,不然会在一幅图上显示2条曲线
很容易发现上图没有对应的label,也就是希望下图的

要实现上图,可以在windows环境下
前提:已经得到数据,然后用曲线表示
import requests
import bs4
import re
import time
import xlwt
import xlrd
import telnetlib
import urllib
import matplotlib
# matplotlib.use('Agg')
from bs4 import BeautifulSoup
from urllib import request
from urllib.request import urlopen
# from tensorboardX import SummaryWriter
# from my_fake_useragent import UserAgent
import matplotlib.pyplot as plt
import matplotlib as mpl
import numpy as np
xlsx_path='.\psnr+60.xlsx'
data_xsls = xlrd.open_workbook(xlsx_path)
sheet_name = data_xsls.sheets()[0]
count_nrows = sheet_name.nrows  #获取总行数
x1 = []
x2 = []
x3= []
y1 =[]
y2 = []
y3 = []
for i in range(1,count_nrows):
    y1.append(sheet_name.cell(i,1).value)  #根据行数来取对应列的值,并添加到字典中
    y2.append(sheet_name.cell(i, 2).value)
    y3.append(sheet_name.cell(i, 3).value)
    x1.append(i)
    x2.append(i)
    x3.append(i)


plt.figure()
plt.plot(x1, y1, color='red', label='middlebury')
plt.plot(x2, y2, color='black', label='KITTI2012')
plt.plot(x3, y3, color='blue', label='KITTI2015')

plt.xlabel('Steps',fontsize=20)
plt.ylabel('PSNR',fontsize=20)
plt.legend(fontsize=16)
plt.show()
但是add_iamge() 能够接受的格式是[C,H,W], 范围[0,1],C<=4,数据类型tensor.FloatTensor。
以一副图展示C张图片
#多通道特征图可视化
        # print(' buffer_left:size', buffer_left.shape)
        # print(' buffer_right:size', buffer_right.shape)#[B,C,H,W]
        # print(' buffer_left[0]:size', buffer_left[0].shape)#[C,H,W],#buffer_left[0]像素点范围不是[0,1]
        # y =  buffer_left[0].detach().cpu().unsqueeze(dim=1)#[C,1,H,W]
        # print(' buffer_left[0]:size', buffer_left[0].shape)
        # print(' y:size', y.shape)#一般为[C,1,H,W]
        # a, _,c ,d= buffer_left.shape
        #
        #
        # #buffer_left[0] 才可以,也就是[1,H,W]才没有歧义
        # grid = torchvision.utils.make_grid( y, normalize=True, scale_each=True)
        # print('grid.size :', grid.size())#grid一定要三维,grid的像素点值范围[0,1]
        # # writer.add_image('images',grid , 0,dataformats='CHW')
        # writer.add_image('images',y[31], 0, dataformats='CHW')#这是第32张特征图
        # writer.close()

第32张特征图
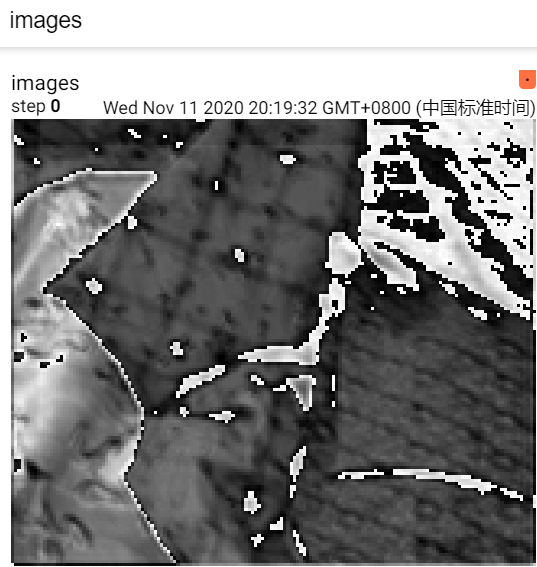
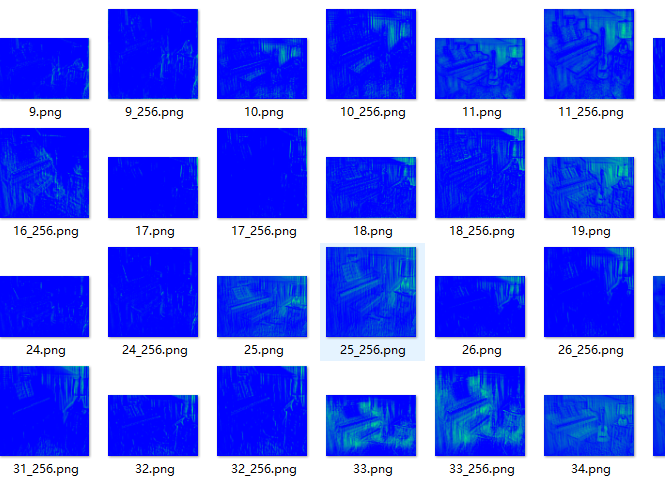
把网络某环节的特征图以热图形式可视化
每个通道一张热力图
参考博客:https://blog.csdn.net/GrayOnDream/article/details/99090247
#下面是某卷积部分,
init_feature维特征提取网络
buffer_left = self.init_feature(x_left)#[B,C,H,W]
buffer_right = self.init_feature(x_right)

        l = buffer_left[0].shape[0]#通道数目
        dst = './feautures'
        therd_size = 256#有些图太小,会放大到这个尺寸
        def make_dirs(path):
            if os.path.exists(path) is False:
                os.makedirs(path)
        dst_path = os.path.join(dst)
        make_dirs(dst_path)
        for i in range(l):
            y =np.asarray(buffer_left[0].data.cpu())#处理成array格式
            y_ = y[i, :, :]
            print('y_.shape:', y_.shape)#2维
            print('y_type:',y_.dtype)#float32
            y_ = np.asarray(y_ * 255, dtype=np.uint8)#[0,255]
            print('y_type:', y_.dtype)#uint8
            # y_ = cv2.applyColorMap(y_, cv2.COLORMAP_JET)
            y_ = cv2.applyColorMap(y_, cv2.COLORMAP_RAINBOW)#https://www.sohu.com/a/343215045_120197868创建伪彩色
            if y_.shape[0] < therd_size:#大小调整
                tmp_file = os.path.join(dst_path, str(i) + '_' + str(therd_size) + '.png')
                tmp_img = y_.copy()#将src中的元素复制到tensor
                tmp_img = cv2.resize(tmp_img, (therd_size, therd_size), interpolation=cv2.INTER_NEAREST)#https://www.cnblogs.com/jyxbk/p/7651241.html
                cv2.imwrite(tmp_file, tmp_img)
            dst_file = os.path.join(dst_path, str(i) + '.png')
            cv2.imwrite(dst_file, y_)
但是上面 的显示结果不美观,因此对像素值范围修改

l = buffer_left[0].shape[0]  # 通道数目
            dst = './feauture'
            therd_size = 256  # 有些图太小,会放大到这个尺寸

            def make_dirs(path):
                if os.path.exists(path) is False:
                    os.makedirs(path)

            dst_path = os.path.join(dst)
            make_dirs(dst_path)

            for i in range(l):
                y = buffer_left[0].data.cpu().numpy()  # 处理成array格式
                y_ = y[i, :, :]


                minn = 1000
                maxx = -1000
                [a, b] = y_.shape
                # for ii in range(a):
                #     for jj in range(b):
                #         minn = min(minn,y_[ii,jj])
                #         maxx = max(maxx,y_[ii][jj])
                # print('minn  maxx',minn,maxx)#并不在0-1之间,有些像素值<0.但是灰度图像像素值[0,1]
                for ii in range(a):
                     for jj in range(b):
                        y_[ii][jj] = max(0, y_[ii][jj])  # 先去掉负值
                y_ = (y_ - np.min(y_)) / np.max(y_)  # 归一化 [0,1]
                y_ = np.asarray(y_ * 255, dtype=np.uint8)  # [0,255]
                # if i == 0:
                #     print('y_.shape:', y_.shape)  # 2维
                #     print('y_type:', y_.dtype)  # float32
                #
                # if i == 0:
                #     print('y_type:', y_.dtype)  # uint8
                # if i == 0:
                #     print('yqian  _  ', y_)
                y_ = cv2.applyColorMap(y_, cv2.COLORMAP_OCEAN)  # https://www.sohu.com/a/343215045_120197868创建伪彩色
                # if i == 0:
                #     print('ycaise )_  ', y_)
                if y_.shape[0] < therd_size:  # 大小调整
                    tmp_file = os.path.join(dst_path, str(i) + '_' + str(therd_size) + '.png')
                     tmp_img = y_.copy()  # 将src中的元素复制到tensor
                     tmp_img = cv2.resize(tmp_img, (therd_size, therd_size),
                                          interpolation=cv2.INTER_NEAREST)  # https://www.cnblogs.com/jyxbk/p/7651241.html
                    cv2.imwrite(tmp_file, tmp_img)
                dst_file = os.path.join(dst_path, str(i) + '.png')
                cv2.imwrite(dst_file, y_)
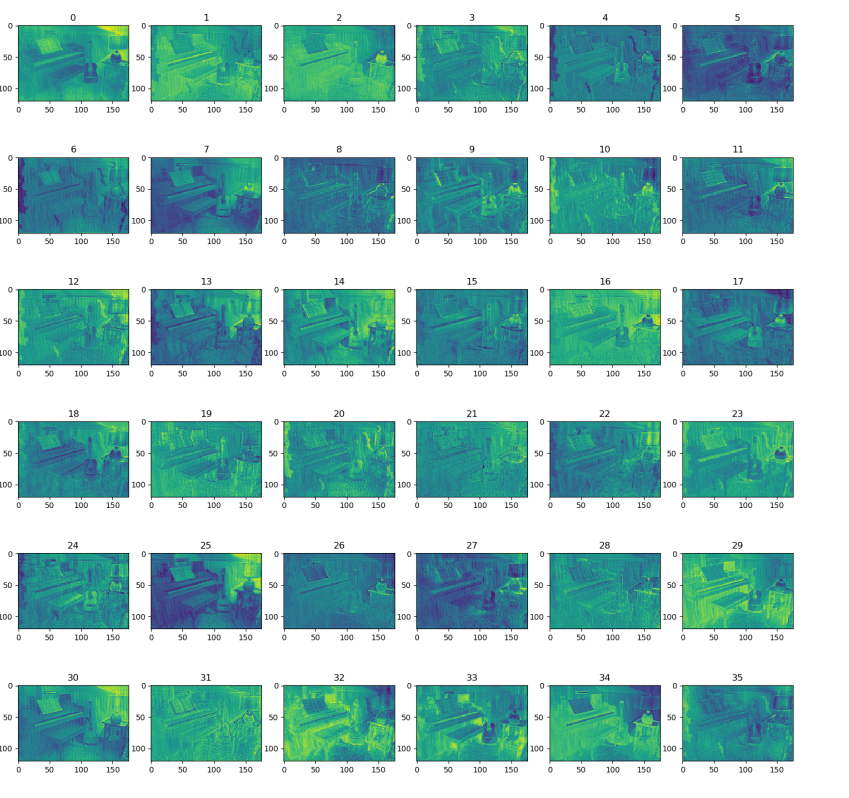
linux服务器无法plt.imshow() 怎么办
https://blog.csdn.net/qq_33292662/article/details/106755325
 # l = buffer[0].shape[0]  # 通道数目
            # plt.figure(figsize=(18,18))#如果一次展示36个,最好(18,18)。不然子图会重叠
            # for i in range(36):
            #     y = buffer[0].data.cpu().numpy()  # 处理成array格式
            #     y_ = y[i, :, :]
            #     plt.subplot(6, 6, i + 1)
            #     plt.title('{}'.format(i))
            #     plt.imshow(y_)#默认会自动归一化
            #     #plt.tight_layout() # tight_layout会自动调整子图参数,使之填充整个图像区域,但会导致部分子图不显示
            #     plt.show()  # 不加无法显示图像
            #
            #
            #
            # plt.savefig('save_pam.png')#36张子图一起显示
多个通道融合为一张热力图

每个通道有一个权重,该通道的权重就是特征图的均值
            [c, h, w] = out[0].shape
            # print('buffer_left[0]',buffer_left[0].shape)
            # print('c h  w',c,h,w)
            ans = np.zeros((h, w))
            dst = './feautures'
            therd_size = 256  # 有些图太小,会放大到这个尺寸
            dst_path = os.path.join(dst)
            make_dirs(dst_path)
            ret = []
            y = np.asarray(out[0].data.cpu())  # 处理成array格式
            for i in range(c):
                y_ = y[i, :, :]
                ret.append(np.mean(y_))#把每个feature map的均值作为对应权重
            for j in range(h):
                for k in range(w):
                    for i in range(c):
                        ans[j][k] += ret[i] * y[i][j][k]#加权融合
            for i in range(h):
                for j in range(w):
                    ans[i][j] = max(0, ans[i][j])#不需要负值
            ans = (ans - np.min(ans)) / np.max(ans)#归一化
            print('ans\n', ans)
            ans = np.asarray(ans * 255, dtype=np.uint8)  # [0,255]
            print('ans _type:', ans.dtype)  # uint8
            # y_ = cv2.applyColorMap(y_, cv2.COLORMAP_JET)
            ans = cv2.applyColorMap(ans, cv2.COLORMAP_JET)  # https://www.sohu.com/a/343215045_120197868创建伪彩色
            if ans.shape[0] < therd_size:  # 大小调整
                tmp_file = os.path.join(dst_path, str(therd_size) + 'sr.png')
                tmp_img = ans.copy()  # 将src中的元素复制到tensor
                tmp_img = cv2.resize(tmp_img, (therd_size, therd_size),
                                     interpolation=cv2.INTER_NEAREST)  # https://www.cnblogs.com/jyxbk/p/7651241.html
                cv2.imwrite(tmp_file, tmp_img)
            dst_file = os.path.join(dst_path, 'sr.png')
            cv2.imwrite(dst_file, ans)
            return out

        [c, h, w] = buffer_left[0].shape
        # print('buffer_left[0]',buffer_left[0].shape)
        # print('c h  w',c,h,w)n
        ans = np.zeros((h, w))

        ret = []
        y = np.asarray(buffer_left[0].data.cpu())  # 处理成array格式
        # for i in range(c):
        #     y_ = y[i, :, :]
        #     ret.append(np.mean(y_))  # 把每个feature map的均值作为对应权重
        for j in range(h):
            for k in range(w):
                for i in range(c):
                    ans[j][k] += y[i][j][k]  # 同等权重融合
        ans = ans / c
        plt.figure()
        # plt.subplot(6, 6, i + 1 - 36)
        plt.title('init')
        plt.imshow(ans)  # 默认会自动归一化
        # plt.tight_layout() # tight_layout会自动调整子图参数,使之填充整个图像区域,但会导致部分子图不显示
        plt.show()  # 不加无法显示图像
        plt.savefig('save_init.png')
[c, h, w] = buffer_left[0].shape
        # print('buffer_left[0]',buffer_left[0].shape)
        # print('c h  w',c,h,w)n
        ans = np.zeros((h, w))

        ret = []
        y = np.asarray(buffer_left[0].data.cpu())  # 处理成array格式
        for i in range(c):
           y_ = y[i, :, :]
           ret.append(np.mean(y_))  # 把每个feature map的均值作为对应权重
        for j in range(h):
            for k in range(w):
                for i in range(c):
                    ans[j][k] += ret [i] * y[i][j][k]  # 加权融合

        plt.figure()
        # plt.subplot(6, 6, i + 1 - 36)
        plt.title('init')
        plt.imshow(ans)  # 默认会自动归一化
        # plt.tight_layout() # tight_layout会自动调整子图参数,使之填充整个图像区域,但会导致部分子图不显示
        plt.show()  # 不加无法显示图像
        plt.savefig('save_init.png')
结果:
同等权重融合
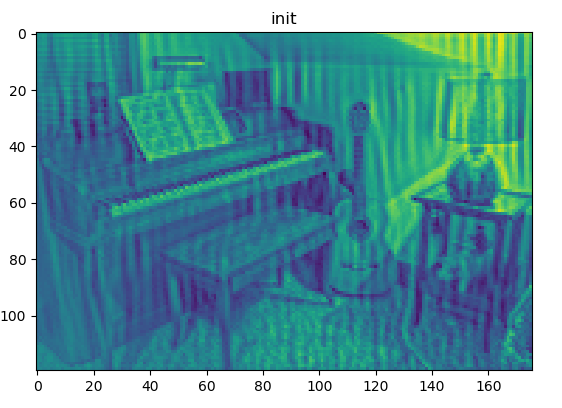
加权融合
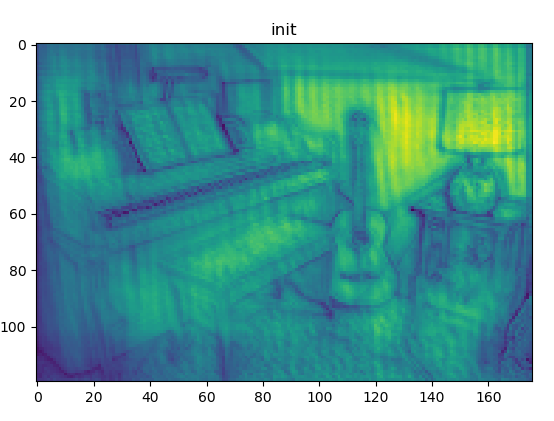
CAM 可视化
参考:https://blog.csdn.net/sinat_37532065/article/details/103362517
        print('out shape',out.shape)
        [c, h, w] = out[0].shape
       # print('buffer_left[0]',buffer_left[0].shape)
        heatmap = out.cpu().numpy()
        print('heat',heatmap.shape)
        heatmap = np.mean(heatmap, axis=0)
        heatmap = np.maximum(heatmap, 0)
        heatmap /= np.max(heatmap)
        print('max heat', heatmap.shape)
        img = cv2.imread('/home/cl/cvcnet/dataset/test/ceshi/1/hr/000000/hr0.png')
        print('img',img.shape)
        sr = np.zeros((img.shape[0], img.shape[1],3))
        numc = heatmap.shape[0]
        print('img', img.shape)
        print('numx',numc)
        for  i in range(numc):
        # 可视化原始热力图
        # if visual_heatmap:
        #     plt.matshow(heatmap)
        #     plt.show()

            # img = cv2.imread('/home/cl/cvcnet/dataset/test/ceshi/2/hr/000000/hr0.png')  # 用cv2加载原始图像


            heatmap = cv2.resize(heatmap[i], (img.shape[1], img.shape[0]))  # 将热力图的大小调整为与原始图像相同
            print('heap', heatmap.shape)
            heatmap = np.uint8(255 * heatmap)  # 将热力图转换为RGB格式
            heatmap = cv2.applyColorMap(heatmap, cv2.COLORMAP_JET)  # 将热力图应用于原始图像
            print('after heap', heatmap.shape)
            superimposed_img = heatmap * 0.4 + img  # 这里的0.4是热力图强度因子
            print('su shape',superimposed_img.shape)
            sr  =sr +superimposed_img

        #     cv2.imwrite(str(i+1)+'.png', superimposed_img)
        sr = sr/numc
        cv2.imwrite('sr.png', sr)
out shape torch.Size([1, 64, 93, 310])
heat (1, 64, 93, 310)
max heat (64, 93, 310)
img (372, 1240, 3)
img (372, 1240, 3)
numx 64
heap (372, 1240)
after heap (372, 1240, 3)
su shape (372, 1240, 3)

注意如果

ERROR: TensorBoard could not bind to port 6006, it was already in use
表示目前的端口正在被使用,需要lsof -i:6006

kill -9 32683
在重新在浏览器输入地址+端口才可,不要用其他的端口,不然会无法显示曲线
上述解决方案来源于 https://blog.csdn.net/c20081052/article/details/81974847
如果第二次运行tensorboard时发现不显示图像,只有一个点(此时的gxz文件可能比正常的小)
那可能是上一次没有writer.close()
调用日志书写器实例对象summary_writer的close()方法写入内存,否则它每隔120s写入一次
close() 方法是把事件文件写到硬盘,并且关闭文件,一般是在不再需要writer的时候调用这个函数。
如果
add_image() got an unexpected keyword argument 'dataformats'
请
pip install tensorboardX==1.6
如果遇到:
No dashboards are active for the current data set.
请参考:https://www.cnblogs.com/ipersevere/p/10843115.html


【推荐】国内首个AI IDE,深度理解中文开发场景,立即下载体验Trae
【推荐】编程新体验,更懂你的AI,立即体验豆包MarsCode编程助手
【推荐】抖音旗下AI助手豆包,你的智能百科全书,全免费不限次数
【推荐】轻量又高性能的 SSH 工具 IShell:AI 加持,快人一步
· go语言实现终端里的倒计时
· 如何编写易于单元测试的代码
· 10年+ .NET Coder 心语,封装的思维:从隐藏、稳定开始理解其本质意义
· .NET Core 中如何实现缓存的预热?
· 从 HTTP 原因短语缺失研究 HTTP/2 和 HTTP/3 的设计差异
· 分享一个免费、快速、无限量使用的满血 DeepSeek R1 模型,支持深度思考和联网搜索!
· 基于 Docker 搭建 FRP 内网穿透开源项目(很简单哒)
· ollama系列01:轻松3步本地部署deepseek,普通电脑可用
· 25岁的心里话
· 按钮权限的设计及实现