python 的库 (PIL(scatter),Numpy,scipy)
PIL
from PIL import Image
img = Image.open('./data/images/neural-style/picasso.jpg')#图片路径
#img.show()#展示图片
'''
print(img)
img.save("./data/images/neural-style/picasso.png")#保存为png格式
img = Image.open("./data/images/neural-style/picasso.png")
print(img.format, img.size, img.mode)
png 650*650 RGB


pix = img.load()
print(pix[0,2])#在1.1.6及以后的版本,方法load()返回一个用于读取和修改像素的像素访问对象

img.paste((256,256,0),(0,0,100,100))#(256,256,0)黄色
img.show()
'''

matplotlib
在使用matplotlib的过程中,常常会需要画很多图,但是好像并不能同时展示许多图。这是因为python可视化库matplotlib的显示模式默认为阻塞(block)模式。
什么是阻塞模式那?我的理解就是在plt.show()之后,程序会暂停到那儿,并不会继续执行下去。如果需要继续执行程序,就要关闭图片。那如何展示动态图或多个窗口呢?
这就要使用plt.ion()这个函数,使matplotlib的显示模式转换为交互(interactive)模式。即使在脚本中遇到plt.show(),代码还是会继续执行。下面这段代码是展示两个不同的窗口:
    import matplotlib.pyplot as plt
    plt.ion()    # 打开交互模式
    # 同时打开两个窗口显示图片
    plt.figure()  #图片一
    plt.imshow(i1)
    plt.figure()    #图片二
    plt.imshow(i2)
    # 显示前关掉交互模式
    plt.ioff()
    plt.show()
下面就来讲讲matplotlib这两种模式具体的区别
在交互模式下:
1、plt.plot(x)或plt.imshow(x)是直接出图像,不需要plt.show()
2、如果在脚本中使用ion()命令开启了交互模式,没有使用ioff()关闭的话,则图像会一闪而过,并不会常留。要想防止这种情况,需要在plt.show()之前加上ioff()命令。
在阻塞模式下:
1、打开一个窗口以后必须关掉才能打开下一个新的窗口。这种情况下,默认是不能像Matlab一样同时开很多窗口进行对比的。
2、plt.plot(x)或plt.imshow(x)是直接出图像,需要plt.show()后才能显示图像
plt.subplot(1,3,1)
plt.title('original')
plt.imshow(img)
plt.subplot(1,3,2)
plt.title('add salt and pepper noise')
plt.imshow(out1)
plt.subplot(1,3,3)
plt.title('Inverse harmonic mean filter restoration')
plt.imshow(out2)
plt.tight_layout()#tight_layout会自动调整子图参数,使之填充整个图像区域
plt.show()#不加无法显示图像

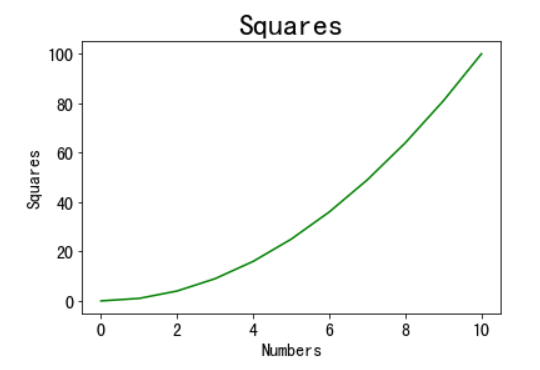
import matplotlib.pyplot as plt

x_values=list(range(11))
#x轴的数字是0到10这11个整数
y_values=[x**2 for x in x_values]
#y轴的数字是x轴数字的平方
plt.plot(x_values,y_values,c='green')
#用plot函数绘制折线图,线条颜色设置为绿色
plt.title('Squares',fontsize=24)
#设置图表标题和标题字号
plt.tick_params(axis='both',which='major',labelsize=14)
#设置刻度的字号
plt.xlabel('Numbers',fontsize=14)
#设置x轴标签及其字号
plt.ylabel('Squares',fontsize=14)
#设置y轴标签及其字号
plt.show()
#显示图表
import matplotlib.pyplot as plt
from matplotlib.pyplot import MultipleLocator
#从pyplot导入MultipleLocator类,这个类用于设置刻度间隔

x_values=list(range(11))
y_values=[x**2 for x in x_values]
plt.plot(x_values,y_values,c='green')
plt.title('Squares',fontsize=24)
plt.tick_params(axis='both',which='major',labelsize=14)
plt.xlabel('Numbers',fontsize=14)
plt.ylabel('Squares',fontsize=14)
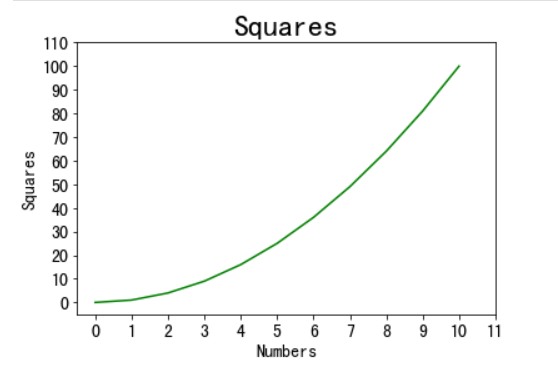
x_major_locator=MultipleLocator(1)
#把x轴的刻度间隔设置为1,并存在变量里
y_major_locator=MultipleLocator(10)
#把y轴的刻度间隔设置为10,并存在变量里
ax=plt.gca()
#ax为两条坐标轴的实例
ax.xaxis.set_major_locator(x_major_locator)
#把x轴的主刻度设置为1的倍数
ax.yaxis.set_major_locator(y_major_locator)
#把y轴的主刻度设置为10的倍数
plt.xlim(-0.5,11)
#把x轴的刻度范围设置为-0.5到11,因为0.5不满一个刻度间隔,所以数字不会显示出来,但是能看到一点空白
plt.ylim(-5,110)
#把y轴的刻度范围设置为-5到110,同理,-5不会标出来,但是能看到一点空白
plt.show()
https://www.cnblogs.com/zyg123/p/10504633.html
这篇博客对图像绘制的设置有很多的修改
plt.imshow(X)
X:array_like对象/数列类对象,shape(n,m) 或者(n,m,3)或者(n,m,4)
把X代表的图片显示在当前坐标轴中。X可以是数列类格式、或者PIL图片。如果X是数列类对象,它可以有如下3种情况&类型:
· M*N - 用来作图的数列值:float类型 / INT类型
· M*N*3 - RGB数列:float类型 / unit8类型
· M*N*4 - RGBA数列:float类型 / unit8类型
M*N*3和M*N*4的float数列,取值范围限定为[0.0, 1.0]。M*N类数列是基于norm(采用标量对映射到标量方法作图)和cmap(将标准化标量映射为颜色)。
matplotlib中cla() clf() close()用途
cla()   # Clear axis即清除当前图形中的当前活动轴。其他轴不受影响。
clf()   # Clear figure清除所有轴,但是窗口打开,这样它可以被重复使用。
close() # Close a figure window
plt.text函数用法
plt.text(0,0.5,'loss:%.4f '%loss.data.numpy(),#%.4f格式化输出,保留思维小数点
                         fontdict={'size': 20, 'color':  'red'}#字体尺寸20,颜色 红色)
                         #第一和第二个参数0,0.5表示输出信息的坐标,原点坐标是(0,0)
matplotlib 清除axis plt.cla()、plt.clf()、plt.close()
plt.cla() # 清除axes,即当前 figure 中的活动的axes,但其他axes保持不变。
plt.clf() # 清除当前 figure 的所有axes,但是不关闭这个 window,所以能继续复用于其他的 plot。
plt.close() # 关闭 window,如果没有指定,则指当前 window
plt.scatter()函数解析
plt.scatter()函数用于生成一个scatter散点图。
matplotlib.pyplot.scatter(x,
y,
s=20,
c='b',
marker='o',
cmap=None,
norm=None,
vmin=None,
vmax=None,
alpha=None,
linewidths=None,
verts=None,
hold=None,
**kwargs)
参数:
- x,y:表示的是shape大小为(n,)的数组,也就是我们即将绘制散点图的数据点,输入数据。
- s:表示的是数据点的大小,是一个标量或者是一个shape大小为(n,)的数组,可选,默认20。
- c:表示的是色彩或颜色序列,可选,默认蓝色’b’。但是c不应该是一个单一的RGB数字,也不应该是一个RGBA的序列,因为不便区分。c可以是一个RGB或RGBA二维行数组。
- marker:MarkerStyle,表示的是标记的样式,可选,默认’o’。
- cmap:Colormap,标量或者是一个colormap的名字,cmap仅仅当c是一个浮点数数组的时候才使用。如果没有申明就是image.cmap,可选,默认None。
- norm:Normalize,数据亮度在0-1之间,也是只有c是一个浮点数的数组的时候才使用。如果没有申明,就是默认None。
- vmin,vmax:标量,当norm存在的时候忽略。用来进行亮度数据的归一化,可选,默认None。
- alpha:标量,0-1之间,可选,默认None。
- linewidths:也就是标记点的长度,默认None。
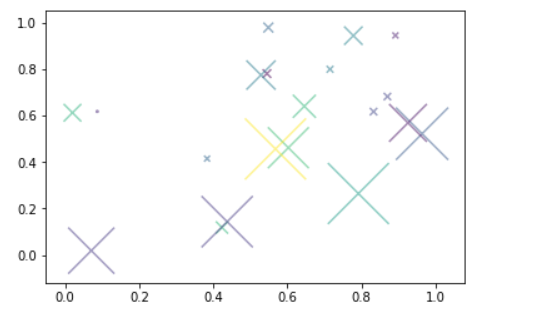
import numpy as np
import matplotlib.pyplot as plt

np.random.seed(0)
x=np.random.rand(20)
y=np.random.rand(20)
colors=np.random.rand(20)
area=(50*np.random.rand(20))**2#颜色和数据点的大小都在变
lines=np.zeros(220)+100
plt.scatter(x,y,s=area,c=colors,alpha=0.5,marker='x',linewidths=lines)
plt.show()
np.random.seed()
关于seed()函数用法:
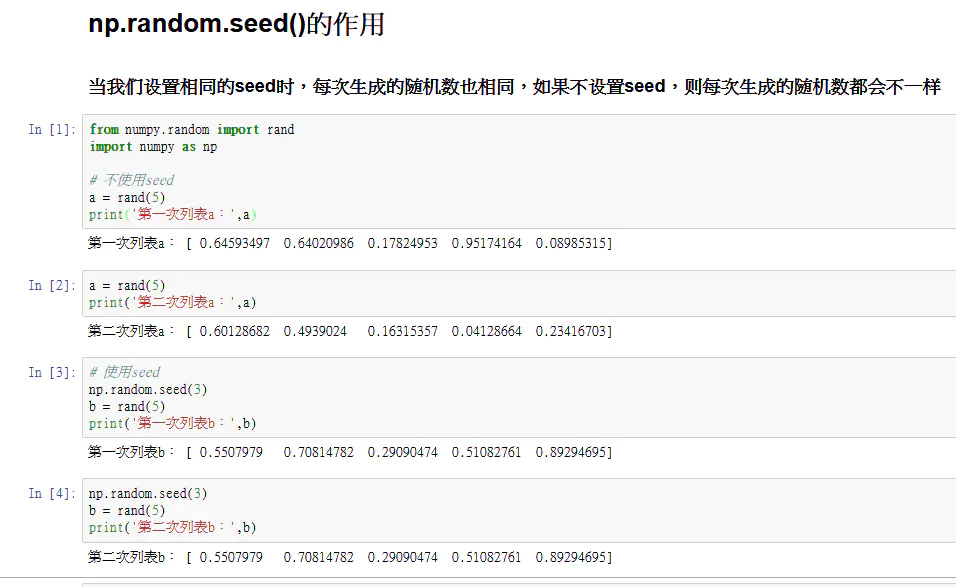
seed( ) 用于指定随机数生成时所用算法开始的整数值。
1.如果使用相同的seed( )值,则每次生成的随即数都相同;
2.如果不设置这个值,则系统根据时间来自己选择这个值,此时每次生成的随机数因时间差异而不同。
3.设置的seed()值仅一次有效
链接:https://www.jianshu.com/p/b16b37f6b439
单张图像变换大小—— img.resize()
from PIL import Image
image = Image.open('./data/images/neural-style/dancing.jpg')
#image.show()
print(image)
image = image.resize((650, 650),Image.ANTIALIAS)
print(image)
E:\anaca\python.exe E:/PycharmProjects/style_transfer2/learn.py
<PIL.JpegImagePlugin.JpegImageFile image mode=RGB size=444x444 at 0x23E26EB47C8>
<PIL.Image.Image image mode=RGB size=650x650 at 0x23E234A1088>
这个函数img.resize((width, height),Image.ANTIALIAS)
第二个参数:
Image.NEAREST :低质量
Image.BILINEAR:双线性
Image.BICUBIC :三次样条插值
Image.ANTIALIAS:高质量
Process finished with exit code 0
from PIL import Image
image1 = Image.open('./data/images/neural-style/dancing.jpg')
#image.show()
print(image1)
a = image1.size
print(a)
image2 = Image.open("./data/images/neural-style/picasso.jpg")
print(image2)
image2 = image2.resize(a, Image.ANTIALIAS)
print(image2)
E:\anaca\python.exe E:/PycharmProjects/style_transfer2/learn.py
<PIL.JpegImagePlugin.JpegImageFile image mode=RGB size=444x444 at 0x2B08759D848>
(444, 444)
<PIL.JpegImagePlugin.JpegImageFile image mode=RGB size=650x650 at 0x2B0876DF208>
<PIL.Image.Image image mode=RGB size=444x444 at 0x2B0863132C8>
a = (image1.size[0],image1.size[1])#记住是[]
[444, 444]
易错
import torchvision.transforms as transforms
import torchvision.models as models

import copy


from PIL import Image
import torch
device = torch.device("cuda" if torch.cuda.is_available() else "cpu")
loader = transforms.Compose([
    transforms.ToTensor()])

def image_loader(image_name):
    image = Image.open(image_name).convert('RGB')
    image = image.resize((650, 600), Image.ANTIALIAS)
    print(image.size) # 0是横向的1是纵向的
    image = loader(image).unsqueeze(0)#用来满足网络的输入维度的假batch维度,即不足之处补0
    print(image.size())#2是height 3是 width
    return image.to(device, torch.float)

image_loader('./data/images/neural-style/picasso.jpg')


(650, 600)
torch.Size([1, 3, 600, 650])   #注意650 600的顺序反过来了
#这里也反过来了
from PIL import Image
import os
import numpy as np
import random
img = Image.open('E:/PycharmProjects/style_transfer2/data/images/neural-style/2.jpg')
print(img.size)
f = np.array(img)
print(f.shape)
(960, 720)
(720, 960, 3)
Python中读取、显示和保存图片的方法
利用 PIL 中的 Image 函数
这个函数读取出来不是 array 格式,这时候需要用 np.asarray(im) 或者 np.array(im)函数将其处理成array格式。
区别:np.array() 是深拷贝,np.asarray() 是浅拷贝。浅拷贝只拷贝父对象,不会拷贝对象的内部的子对象;深拷贝会拷贝对象及其子对象。
image = Image.open('E:/PycharmProjects/style_transfer2/data/images/neural-style/tim.jpg')
image.show()
image.save('C:/Users/Administrator/Desktop/1.jpg')
im_arr = np.array(image)
print(im_arr.shape)
img = Image.fromarray(np.uint8(im_arr))#array转换成image

img.save('C:/Users/Administrator/Desktop/2.jpg',quality=95)
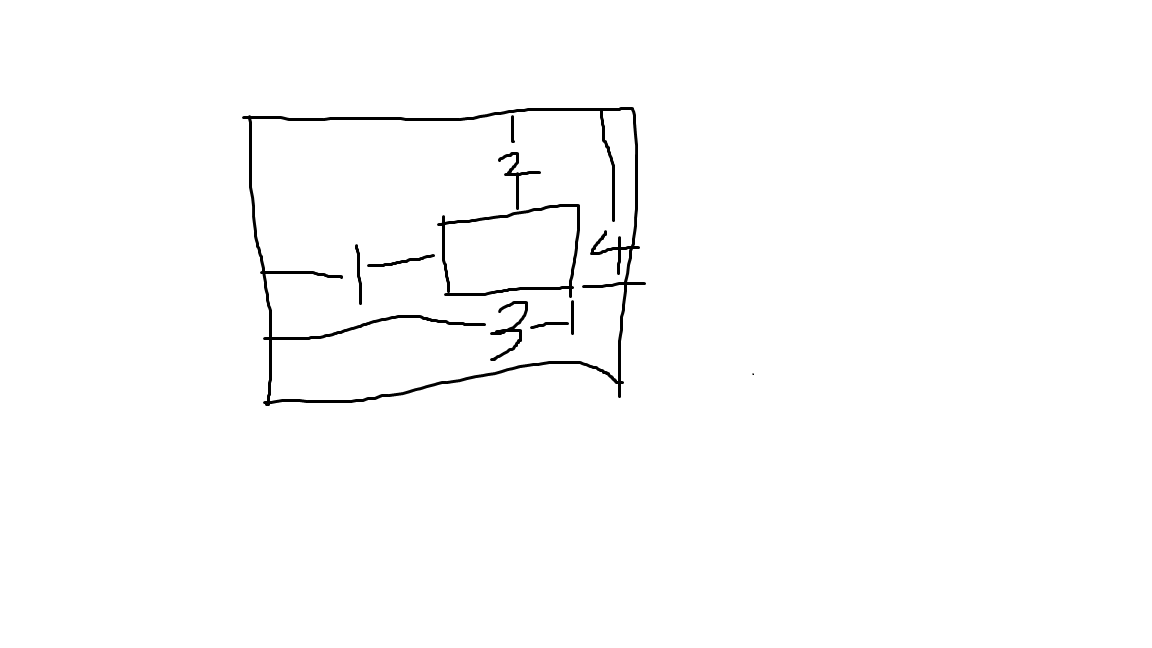
crop()裁剪图片
from PIL import Image
img =   Image.open('E:/PycharmProjects/style_transfer2/data\images/neural-style/2.jpg')
print(img.size)
c = img.crop((1,2,3,4))

c.show()
大的长方形为原来图片,小的长方形是裁剪得到的图片
1 2 3 4 分别表示被裁减的区域左边缘和原图片左边缘的距离,上。。,右边。。,下。。。
paste的应用
a = Image.open('E:/PycharmProjects/style_transfer2/data\images/neural-style/tim.jpg')
b = Image.open('E:/PycharmProjects/style_transfer2/data\images/neural-style/timg.jpg')
# print(a.size)#1021*1024
# print(b.size)#450*450


tmp=b.crop((0,0,225,225))
a.paste(tmp,(500,500,725,725))#和crop类似,把tmp贴到a上
a.show()

定义:ImageOps.invert(image)⇒ image
含义:将输入图像转换为反色图像。
from PIL import ImageOps
from PIL import ImageOps
a = Image.open('E:/PycharmProjects/style_transfer2/data\images/neural-style/tim.jpg')
b = Image.open('E:/PycharmProjects/style_transfer2/data\images/neural-style/timg.jpg')
# print(a.size)#1021*1024
# print(b.size)#450*450
c = ImageOps.invert(b)
c.show()

a

c

scipy.misc.imresize改变图像的大小
scipy.misc.imresize( arr, size, interp='bilinear', mode=None)
resize an image.改变图像大小并且隐藏归一化到0-255区间的操作
参数:
arr: ndarray, the array of image to be resized
size: 只对原图的第0和第1维度的size做改变,其他维度的size保持不变。
1)int, percentage(百分比) of current size. 整数的时候是原图像的百分比,例如7,80,160分别是原图像的百分之七,百分之八十,百分之一百六十的大小
2)float, fraction(分数) of current size. 浮点数的时候是原图像的分数,例如0.7,1.5分别是原图像的0.7倍和1.5倍
3)tupe, size of the output image (height,width).元组的时候是直接定义输出图像的长和宽,与原图的大小无关
interp: str, optional. interpolation(插值) to use for re-sizing('nearest', 'lanczos', 'bilinear', 'bicubic', 'cubic')。是一个可选的参数,是调整图像大小所用的插值的方法,
分别有最近邻差值,Lanczos采样放缩插值,双线性插值,双三次插值,三次插值
mode: str, optional.
以下讨论都是基于size=1.0或者size=100也就是说不改变原图像的大小的情况下。如果size不是和原图大小一样,那么先进行mode变化,再利用插值方法对size进行变化。
(1) 当arr是二维的时候arr=[h,w],可以选择'P’,'L',None:mode='L'和mode=None的结果是一样的,都是直接将原图归一化到0-255范围内(归一化的方法在下面),结果shape=[h,w];mode='P'的时候是将mode='L'的结果是将只有一个图层的二维图像变为3维图像,具体做法是三个图层是一样的,结果shape=[h,w,3]。
(2)当arr是三维的时候arr.shape=[h,w,c],必须满足一个条件,就是至少一个维度是3!!!,mode可以选择‘RGB’, None实际上这两个选择结果是一样的;1)当c=3时,结果shape=[h,w,3], 2)当c不等于3同时只有一个3的时候,shape的变化如下 [h,3,c]------[h,c,3],[3,w,c]-----[w,c,3],3)当c不等于3同时h=w=3的时候,shape变化如下[3,3,c]-------[3,c,3]. 注意这里面的2)和3)因为维度改变了,会在下面讨论
(3)当arr是四维的时候:mode='RGBA'或者None,略
返回值: imresize: ndarray, the resized array of image
这里的scipy==1.2.1
import scipy.misc as smi
a = np.arange(24).reshape(4,6)

a3 = smi.imresize(a,size=1.0,mode='P')
print('a: ',a)

print('a3: ',a3)
a: [[ 0 1 2 3 4 5]
[ 6 7 8 9 10 11]
[12 13 14 15 16 17]
[18 19 20 21 22 23]]
a3: [[[ 0 0 0]
[ 11 11 11]
[ 22 22 22]
[ 33 33 33]
[ 44 44 44]
[ 55 55 55]]
[[ 67 67 67]
[ 78 78 78]
[ 89 89 89]
[100 100 100]
[111 111 111]
[122 122 122]]
[[133 133 133]
[144 144 144]
[155 155 155]
[166 166 166]
[177 177 177]
[188 188 188]]
[[200 200 200]
[211 211 211]
[222 222 222]
[233 233 233]
[244 244 244]
[255 255 255]]]
Numpy
>>> import numpy
>>> a = numpy.array([[1,2,3],[4,5,6]])
>>> print(a)
[[1 2 3]
 [4 5 6]]
>>> a = numpy.array([[1,2,3],dtype=complex)
  File "<stdin>", line 1
    a = numpy.array([[1,2,3],dtype=complex)
                                  ^
SyntaxError: invalid syntax
>>> a = numpy.array([1,2,3],dtype=complex)#复数
>>> print(a)
[1.+0.j 2.+0.j 3.+0.j]
>>> a = numpy.array([[1,2,3],[4,5,6]])
>>> print(a.shape)
(2, 3)
>>> a.shape=(3,2)
>>> print(a)
[[1 2]
 [3 4]
 [5 6]]
>>> b=a.reshape(2,3)
>>> print(b0
... print(b)
  File "<stdin>", line 2
    print(b)
        ^
SyntaxError: invalid syntax
>>> print(b)
[[1 2 3]
 [4 5 6]]
>>>
>>> a=numpy.arange(24)
>>> print(a)
[ 0  1  2  3  4  5  6  7  8  9 10 11 12 13 14 15 16 17 18 19 20 21 22 23]
>>> print(a.ndim)
1
>>> b=a.reshape(6,2,2)
>>> print(b)
[[[ 0  1]
  [ 2  3]]

 [[ 4  5]
  [ 6  7]]

 [[ 8  9]
  [10 11]]

 [[12 13]
  [14 15]]

 [[16 17]
  [18 19]]

 [[20 21]
  [22 23]]]
>>> print(b.ndim)#维度
3
>>> x=numpy.array([1,2],dtype=numpy.float32)#4个字节
>>> print(x.itemsize)
4
# int8,int16,int32,int64可替换为等价的字符串'i1','i2','i4','i8'
>>> a=np.arange(9).reshape(3,3)
>>> print(a)
[[0 1 2]
[3 4 5]
[6 7 8]]
>>> b=a[:,1]
>>> print(b)
[1 4 7]#依然行的形式表示一维数组
>>> w=np.arange(3)
>>> print(w)
[0 1 2]
>>> w=w**2
>>> print(w)
[0 1 4]#每个元素各自平方
>>> import numpy
>>> dt=numpy.dtype(numpy.int32)
>>> print(dt)
int32
>>> dt=numpy.dtype('i8')
>>> print(dt)
int64
>>> dt=numpy.dtype([('age',numpy.int8)])# 创建结构化数据类型
>>> print(dt)
[('age', 'i1')]
>>> a=numpy.array([(10,)(20,),(30,)],dtype=dt)
Traceback (most recent call last):
  File "<stdin>", line 1, in <module>
TypeError: 'tuple' object is not callable
>>> print(dt)
[('age', 'i1')]
>>> a=numpy.array([(10,),(20,),(30,)],dtype=dt)
>>> print(a)
[(10,) (20,) (30,)]
>>> print(a['age'])
[10 20 30]
>>> stu=numpy.dtype([('name','S20'),('age','i1'),('marks','f4')])
>>> a=numpy.array([('abc',21,50),('xyz',18,75)],dtype=stu)
>>> print(a)
[(b'abc', 21, 50.) (b'xyz', 18, 75.)]
>>> print(a['name'])
[b'abc' b'xyz']
>>>
>>> a = numpy.array([('abc', 21, 50), ('xyz', 18, 75)], dtype=student)
Traceback (most recent call last):
  File "<stdin>", line 1, in <module>
NameError: name 'student' is not defined
>>> a = numpy.array([('abc', 21, 50), ('xyz', 18, 75)], dtype=stu)
>>> print(a)
[(b'abc', 21, 50.) (b'xyz', 18, 75.)]
numpy.empty:它创建指定形状和dtype的未初始化数组
. Fortran数组与C 语言数组存放顺序的差异(以 a (3,2)为例):
   C语言的二维数组(先行后列):  a(1,1) a(1,2) a(2,1) a(2,2) a(3,1) a(3,2)
   Fortran的二维数组(先列后行):a(1,1) a(2,1) a(3,1) a(1,2) a(2,2) a(3,2)
import numpy
x = numpy.empty([3,2], dtype = int)
print(x)
# [[1890908336      32761]
#  [1890912960      32761]
#  [         0          0]]
其中,数组元素为随机值,因为它们未初始化
# 含有5个0的数组,默认类型为float
import numpy
x = numpy.zeros(5)
print(x)
# [0. 0. 0. 0. 0.]
# 自定义类型
import numpy
x = numpy.zeros((2,2), dtype =  [('x',  'i1'),  ('y',  'i1')])
print(x)
# [[(0, 0) (0, 0)]
#  [(0, 0) (0, 0)]]
import numpy
x = numpy.ones([2,2], dtype = int)
print(x)
# [[1 1]
#  [1 1]]
numpy.asarray:此函数类似于numpy.array,这个例程对于将Python序列转换为ndarray非常有用
numpy.asarray(a, dtype = None, order = None)
相关参数说明如下:

a:任意形式的输入参数,比如列表、列表的元组、元组、元组的元组、元组的列表。
dtype:通常,输入数据的类型会应用到返回的ndarray。
order:'C'为按行的C风格数组,'F'为按列的Fortran风格数组。
# 将列表转换为ndarray
import numpy as np
x = [1, 2, 3]
a = np.asarray(x)
print(a)
# [1 2 3]
import torch

import numpy as np
a = np.random.randn(2,2)
# array和asarray都可以将结构数据转化为ndarray,
# 但是主要区别就是当数据源是ndarray时,array仍然会copy出一个副本,占用新的内存,但asarray不会。
b = np.asarray(a)
c = np.array(a)
a[1] =3
print(a)
print('asarray :')
print(b)
print('array :')
print(c)
初始:
[[-0.10470403  0.1118859 ]
 [ 3.          3.        ]]
asarray :
[[-0.10470403  0.1118859 ]
 [ 3.          3.        ]]#也会跟着修改
array :
[[-0.10470403  0.1118859 ]
 [-0.09354853 -0.17821701]]
numpy.arange:这个函数返回ndarray对象,包含给定范围内的等间隔值。

numpy.arange(start, stop, step, dtype)
# 设置了起始值和终止值参数
import numpy as np
x = np.arange(10,20,2)
print(X)
# [10  12  14  16  18]
数组的索引和切片

一维数组的索引和切片
import numpy
arr = numpy.arange(10)
print(arr)
# [0 1 2 3 4 5 6 7 8 9]
print(arr[1:8])
# [1 2 3 4 5 6 7]
print(arr[:8:3])
# [0 3 6]
print(arr[::-1])
# [9 8 7 6 5 4 3 2 1 0]
import numpy
arr = numpy.arange(16).reshape(2,4,2)
print(arr)
# [[[ 0  1]
#   [ 2  3]
#   [ 4  5]
#   [ 6  7]]
#
#  [[ 8  9]
#   [10 11]
#   [12 13]
#   [14 15]]]
print(arr[0,0,0])
# 0
print(arr[1,3,1])
# 15
print(arr[:,0,0])
# [0 8]
print(arr[0])
#[[0 1]
# [2 3]
# [4 5]
# [6 7]]
print(arr[0,:,:]) # 效果同上
print(arr[0,...]) # 效果同上
print(arr[0, :, 1])
# [1 3 5 7]
print(arr[0, :, -1])#-1为倒数第一列
# [1 3 5 7]
print(arr[0, ::-1, -1])
# [7 5 3 1]
print(arr[0, ::2, -1])
# [1 5]
print(arr[::-1])
#[[[ 8  9]
#  [10 11]
#  [12 13]
#  [14 15]]
#
# [[ 0  1]
#  [ 2  3]
#  [ 4  5]
#  [ 6  7]]]
花式索引
import numpy
arr = numpy.empty((5, 3))
for i in range(5):
    arr[i] = i
print(arr)
# [[0. 0. 0.]
#  [1. 1. 1.]
#  [2. 2. 2.]
#  [3. 3. 3.]
#  [4. 4. 4.]]
print(arr[[3,1,2,0]]) #以第3,1,2,0行的顺序选取子集,从0开始计数
# [[3. 3. 3.]
#  [1. 1. 1.]
#  [2. 2. 2.]
#  [0. 0. 0.]]
print(arr[[-2,-3,-1]]) #以倒数第2,3,1行顺序选取子集,负数是从-1开始计数
# [[3. 3. 3.]
#  [2. 2. 2.]
#  [4. 4. 4.]]
x = np.arange(16).reshape(2,4,2)
print(x)
print("first")
print(x[:,:,::-1])#列逆序
print(x)
print('second ')
print(x[:,::-1,:])#行逆序
[[[ 0  1]
  [ 2  3]
  [ 4  5]
  [ 6  7]]

 [[ 8  9]
  [10 11]
  [12 13]
  [14 15]]]
first
[[[ 1  0]
  [ 3  2]
  [ 5  4]
  [ 7  6]]

 [[ 9  8]
  [11 10]
  [13 12]
  [15 14]]]
[[[ 0  1]
  [ 2  3]
  [ 4  5]
  [ 6  7]]

 [[ 8  9]
  [10 11]
  [12 13]
  [14 15]]]
second
[[[ 6  7]
  [ 4  5]
  [ 2  3]
  [ 0  1]]

 [[14 15]
  [12 13]
  [10 11]
  [ 8  9]]]
import numpy
arr1 = numpy.array([[2,1],[1,2]])
arr2 = numpy.array([[1,2],[3,4]])
print(arr1 - arr2)
# [[ 1 -1]
#  [-2 -2]]

print(arr1**2)
# [[4 1]
#  [1 4]]

print(3*arr2)
# [[ 3  6]
#  [ 9 12]]

print(arr1*arr2)  # 普通乘法
# [[2 2]
#  [3 8]]

print(numpy.dot(arr1,arr2))  # 矩阵乘法
# [[ 5  8]
#  [ 7 10]]
>>> a=np.arange(4)
>>> b=np.arange(3)
>>> print(a)
[0 1 2 3]
>>> print(b)
[0 1 2]
>>> a.dot(b)
Traceback (most recent call last):
File "<stdin>", line 1, in <module>
ValueError: shapes (4,) and (3,) not aligned: 4 (dim 0) != 3 (dim 0)
>>> b=np.ones(4)
>>> print(b)
[1. 1. 1. 1.]
>>> a.dot(b)#
都是一维数组,那么它返回的就是向量的内积
6.0
>>> a=np.array([[1,2],[3,4]])
>>> b=np.array([[5,6],[7,15]])
>>> print(a)
[[1 2]
[3 4]]
>>> print(b)
[[ 5 6]
[ 7 15]]
>>> a.dot(b)
都是二维数组,那么它返回的是矩阵乘法
array([[19, 36],
[43, 78]])
print(arr2.T)  #矩阵转置
# [[1 3]
#  [2 4]]

print(numpy.linalg.inv(arr2)) # 返回逆矩阵
# [[-2.   1. ]
#  [ 1.5 -0.5]]

print(arr2.sum())  # 数组元素求和
# 10
print(arr2.max())  # 返回数组最大元素
# 4

# 如果是一维数组,就是当前列之前的和加到当前列上
# 如果是二维数组,axis可以是0(第一行不动,其他行累加), 可以是1(第一列列不动,其他列累加)
print(arr2.cumsum(axis = 1))
# [[1 3]
#  [3 7]]
>>> b=numpy.arange(9).reshape(3,3)
>>> print(b)
[[0 1 2]
[3 4 5]
[6 7 8]]
>>> print(b.cumsum(axis=1))
[[ 0 1 3]
[ 3 7 12]
[ 6 13 21]]
>>> a=numpy.arange(5)
>>> print(a)
[0 1 2 3 4]
>>> print(a.cumsum(axis=0))
[ 0 1 3 6 10]
易错

import random
print(random.randint(a,b))#[a,b]
import numpy as np
print(np.random.randint(a,b))#[a,b)
numpy.random.randint用法
numpy.random.randint(low, high=None, size=None, dtype='l')
函数的作用是,返回一个随机整型数,范围从低(包括)到高(不包括),即[low, high)。
如果没有写参数high的值,则返回[0,low)的值。
参数如下:
low: int
生成的数值最低要大于等于low。
(hign = None时,生成的数值要在[0, low)区间内)
high: int (可选)
如果使用这个值,则生成的数值在[low, high)区间。
size: int or tuple of ints(可选)
输出随机数的尺寸,比如size = (m * n* k)则输出同规模即m * n* k个随机数。默认是None的,仅仅返回满足要求的单一随机数。
dtype: dtype(可选):
想要输出的格式。如int64、int等等
输出:
out: int or ndarray of ints
返回一个随机数或随机数数组
example:
print(np.random.randint(5,size=(2,4)))
[[0 4 2 0]
[1 1 2 4]]
a = np.arange(24).reshape(2,3,4)
print(a)
print('fwv')
print(a[:,:,:3])#取前三列
[[[ 0 1 2 3]
[ 4 5 6 7]
[ 8 9 10 11]]
[[12 13 14 15]
[16 17 18 19]
[20 21 22 23]]]
fwv
[[[ 0 1 2]
[ 4 5 6]
[ 8 9 10]]
[[12 13 14]
[16 17 18]
[20 21 22]]]
np.concatenate函数
concatenate([a, b])
连接,连接后ndim不变,a和b可以有一维size不同,但size不同的维度必须是要连接的维度
>>> a = np.array([[1, 2], [3, 4]])
>>> b = np.array([[5, 6]])               b是一个二维array
>>> np.concatenate((a, b), axis=0)
array([[1, 2],
       [3, 4],
       [5, 6]])
a:2*2
b:1*2
axis=0--> (1+2)*2
print(np.concatenate((a, b), axis=1))#会报错
#array转换成image
numpy添加新的维度:newaxis的方法
x = np.random.randint(1,9,size =4)
print(x)
x1 = x[np.newaxis,:]#1*4
print(x1)
x2 = x[:,np.newaxis]#4*1
print(x2)
[4 4 5 1]
[[4 4 5 1]]
[[4]
[4]
[5]
[1]]
x = np.random.randint(1,9,(2,3,4))
print(x)
y = x[:,np.newaxis,:,:]
print('y ',y.shape)
print(y)
z = x[:,:,np.newaxis,:]
print('z ',z.shape)
print(z)
[[[3 7 4 4]
[1 1 7 3]
[3 3 7 8]]
[[8 2 8 5]
[7 6 2 7]
[6 5 7 5]]]
y (2, 1, 3, 4)
[[[[3 7 4 4]
[1 1 7 3]
[3 3 7 8]]]
[[[8 2 8 5]
[7 6 2 7]
[6 5 7 5]]]]
z (2, 3, 1, 4)
[[[[3 7 4 4]]
[[1 1 7 3]]
[[3 3 7 8]]]
[[[8 2 8 5]]
[[7 6 2 7]]
[[6 5 7 5]]]]
x = np.random.randint(1,9,(4,4))
print(x)
y = x[np.newaxis,0:2]
print('y ',y.shape)
print(y)
y = x[np.newaxis,0:2]
y (1, 2, 4)
[[[7 4 2 6]
[1 5 5 4]]]
y = x[0:2,np.newaxis]
y (2, 1, 4)
[[[6 8 3 5]]
[[7 6 3 5]]]
np.argwhere()的用法
import numpy as np
a = np.random.randint(0,10,size=(3,3))
print(a)
s = np.argwhere(a>5)#返回大于5的index(非0)
print(s)
[[1 5 4]
 [8 9 4]
 [6 8 3]]


[[1 0]
 [1 1]
 [2 0]
 [2 1]]
import numpy as np
a = np.random.randint(0,10,size=(3,3))
print(a)
s = np.argwhere(a==5)
print(s)
[[8 4 5]
 [1 3 7]
 [9 3 5]]
[[0 2]
 [2 2]]
import torch
import numpy as np
a = torch.Tensor([1.,0.,1.,0.])
b = np.asarray(a)
print(b)
print(np.argwhere(b))
# [1. 0. 1. 0.]
# [[0]
#  [2]]
np.squeeze
squeeze 函数:从数组的形状中删除单维度条目,即把shape中为1的维度去掉
用法:numpy.squeeze(a,axis = None)
 1)a表示输入的数组;
 2)axis用于指定需要删除的维度,但是指定的维度必须为单维度,否则将会报错;
 3)axis的取值可为None 或 int 或 tuple of ints, 可选。若axis为空,则删除所有单维度的条目;
 4)返回值:数组
 5) 不会修改原数组;
import torch
import numpy as np
a = torch.Tensor([1.,0.,1.,0.])
b = np.asarray(a)
print(b)
c = np.argwhere(b)
print(c)
print(c.shape)
d = np.squeeze(c)
print(d)
print(d.shape)
print(d.size)
# [1. 0. 1. 0.]
# [[0]
#  [2]]
# (2, 1)
# [0 2]
# (2,)
# 2
注意
[1. 0. 0. 0.]
[[0]]
(1, 1)
0
()#空的
1
np.random.rand()
通过本函数可以返回一个或一组服从“0~1”均匀分布的随机样本值。随机样本取值范围是[0,1),不包括1。
均匀分布:在相同长度间隔的分布概率是等可能的。 均匀分布由两个参数a和b定义,它们是数轴上的最小值和最大值,通常缩写为U(a,b)
import numpy as np
np.random.rand()
0.8785941662916695
np.random.rand(2)
array([0.75021837, 0.8724264 ])
np.random.rand(5,2)
array([[0.21020877, 0.39619821],
       [0.61875733, 0.61013236],
       [0.56376116, 0.83765933],
       [0.12568493, 0.06425823],
       [0.21223259, 0.5732313 ]])
np.random.randn()函数
np.random.randn(d0,d1,d2……dn)
1)当函数括号内没有参数时,则返回一个浮点数;
2)当函数括号内有一个参数时,则返回秩为1的数组,不能表示向量和矩阵;
3)当函数括号内有两个及以上参数时,则返回对应维度的数组,能表示向量或矩阵;
4)np.random.standard_normal()函数与np.random.randn()类似,但是np.random.standard_normal()
的输入参数为元组(tuple).
5)np.random.randn()的输入通常为整数,但是如果为浮点数,则会自动直接截断转换为整数。
通过本函数可以返回一个或一组服从标准正态分布的随机样本值。
标准正态分布是以0为均数、以1为标准差的正态分布,记为N(0,1)。
标准正态分布曲线下面积分布规律是:
在-1.96~+1.96范围内曲线下的面积等于0.9500(即取值在这个范围的概率为95%),在-2.58~+2.58范围内曲线下面积为0.9900(即取值在这个范围的概率为99%).
因此,由 np.random.randn()函数所产生的随机样本基本上取值主要在-1.96~+1.96之间,当然也不排除存在较大值的情形,只是概率较小而已。
np.random.randn()
0.3475693772399517
np.random.randn(3,3)
array([[ 0.04850506, -0.73062761,  0.19194061],
       [ 1.61736745, -0.11880494,  0.16404238],
       [ 0.37672584, -0.44905497, -1.17443303]])
np.random.binomial()
函数原型及参数:numpy.random.binomial(n,p,size=None)
官方参数的解释如下:
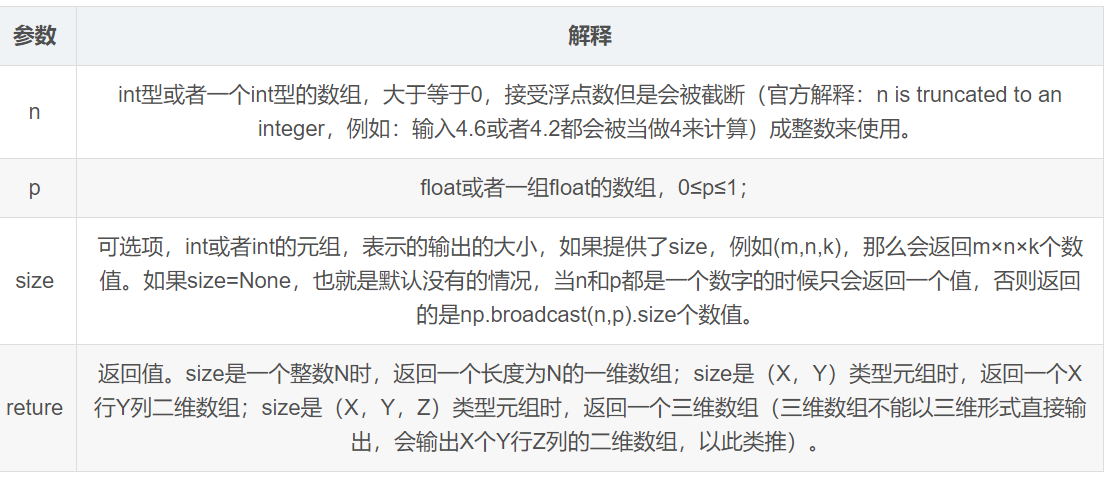
参数n:一次试验的样本数n,并且相互不干扰。
参数p:事件发生的概率p,范围[0,1]。这里有个理解的关键就是 “事件发生”到底是指的什么事件发生?准确来讲是指:
如果一个样本发生的结果要么是A要么是B,事件发生指的是该样本其中一种结果发生。
参数size:限定了返回值的形式(具体见上面return的解释)和实验次数。当size是整数N时,表示实验N次,返回每次实验中事件发生的次数;
size是(X,Y)时,表示实验X*Y次,以X行Y列的形式输出每次试验中事件发生的次数。
return返回值 : 以size给定的形式,返回每次试验事件发生的次数,次数大于等于0且小于等于参数n。注意:每次返回的结果具有随机性,因为二项式分布本身就是随机试验
给出几个例子:
例1: n=1时,重复伯努利试验。
一次抛一枚硬币试验,正面朝上发生的概率为0.5,做8次实验,求每次试验发生正面朝上的硬币个数:
import numpy as np
test = np.random.binomial(1,0.5,8)
print(test)
#[1 1 1 0 1 0 1 0]


例2: n>1时,多个样本进行试验:
一次抛5枚硬币,每枚硬币正面朝上概率为0.5,做8次试验,求每次试验发生正面朝上的硬币个数:
import numpy as np
test = np.random.binomial(5,0.5,8)
print(test)
#[3 3 3 3 2 4 1 3]


例3:size为元组的形式时:
一次抛5枚硬币,每硬币正面朝上概率为0.5,做30次试验,求每次试验发生正面朝上的硬币个数:
import numpy as np
test = np.random.binomial(5,0.5,(10,3))
print(test)
# [[4 1 2]
#  [3 1 2]
#  [4 2 3]
#  [2 4 3]
#  [3 5 1]
#  [3 3 3]
#  [1 2 1]
#  [1 2 2]
#  [2 4 5]
#  [2 5 4]]


一次抛2个硬币,每枚硬币抛到正反两面的概率都是0.5,那么两个硬币都是正面的概率是多少?发生一正一反的概率是多少?
显然答案是0.25和0.5,试验次数越大,越能接近理论概率:
import numpy as np
test = sum(np.random.binomial(2,0.5,10000)==1)/10000
print(test)
0.4975
import numpy as np
test = sum(np.random.binomial(2,0.5,10000)==2)/10000
print(test)
0.2446
numpy的broadcast广播机制
A=np.zeros((2,3,2))
维度数量
numpy中指定维度都是用元组来的,比如np.zeros((2,3,2))的维度数量是三维的。np.zeros((3,))维度数量这是1维的,因为(3)不是元组它只能算3加个括号而已, 加个逗号(3,)才是元组。
某个维度大小
比如np.zeros((2,3,4))的维度数量是三维的。这个数组第一维的维度大小是2,第二维的维度大小是3,第三维的维度大小是4.
广播(broadcasting)
通常只在对多个数组进行对应元素操作形状不同时,才会发生广播。
那什么是对应元素进行操作呢?比如:
a = np.array([1,2,3])
b = np.array([2,2,2])
a*b # a和b对应元素相乘
# a*b的结果是: [1*2,2*2,3*2]
'''
np.dot(a,b) # 这就不是对应元素操作,这是矩阵相乘。
# np.dot(a,b)的结果是a,b的点积。
'''
什么叫做形状不同呢?
a = np.array([1,2,3])
b = 2
a*b #a是1维向量,b是标量,这就是形状不同
# 结果也是:[1*2,2*2, 3*2]
'''
这是因为发生了广播。b被填充为[2,2,2]
然后a*b的效果变成了,[1,2,3]*[2,2,2]
'''
前面的两个例子输入不同但运行结果相同的原因就是发生的广播(broadcast)。
可以广播的几种情况:
假定只有两个数组进行操作,即A+B、A*B这种情况。
1. 两个数组各维度大小从后往前比对均一致
举个例子:
A = np.zeros((2,5,3,4))
B = np.zeros((3,4))
print((A+B).shape) # 输出 (2, 5, 3, 4)

A = np.zeros((4))
B = np.zeros((3,4))
print((A+B).shape) # 输出(3,4)
举个反例:
A = np.zeros((2,5,3,5))
B = np.zeros((3,3))
print((A+B).shape)
报错:
ValueError: operands could not be broadcast together with shapes (2,5,3,4) (3,3)
为啥呢?因为最后一维的大小A是5,B是3,不一致。
2. 两个数组存在一些维度大小不相等时,有一个数组的该不相等维度大小为1
这是对上面那条规则的补充,虽然存在多个维大小不一致,但是只要不相等的那些维有一个数组的该大小是1就可以。
举个例子:
A = np.zeros((2,5,3,4))
B = np.zeros((3,1))
print((A+B).shape) # 输出:(2, 5, 3, 4)

A = np.zeros((2,5,3,4))
B = np.zeros((2,1,1,4))
print((A+B).shape) # 输出:(2, 5, 3, 4),不一样的要都是1

A = np.zeros((1))
B = np.zeros((3,4))
print((A+B).shape) # 输出(3,4)


# 下面是报错案例
A = np.zeros((2,5,3,4))
B = np.zeros((2,4,1,4))
print((A+B).shape)
ValueError: operands could not be broadcast together with shapes (2,5,3,4) (2,4,1,4)
为啥报错?因为A和B的第2维不相等。并且都不等于1.转载自:https://zhuanlan.zhihu.com/p/60365398
hstack()函数

函数原型:hstack(tup) ,参数tup可以是元组,列表,或者numpy数组,返回结果为numpy的数组。看下面的代码体会它的含义

a = [1,2,3]
b = [4,5,6]
print(np.hstack((a,b)))


[1 2 3 4 5 6]

print(np.vstack((a,b)))
[[1 2 3]
 [4 5 6]]
import numpy as np
a=[[1],[2],[3]]
b=[[1],[2],[3]]
c=[[1],[2],[3]]
d=[[1],[2],[3]]
print(np.hstack((a,b,c,d)))

输出:
[[1 1 1 1]
 [2 2 2 2]
 [3 3 3 3]]


它其实就是水平(按列顺序)把数组给堆叠起来,vstack()函数正好和它相反。


vstack()函数
函数原型:vstack(tup) ,参数tup可以是元组,列表,或者numpy数组,返回结果为numpy的数组。看下面的代码体会它的含义

import numpy as np
a=[1,2,3]
b=[4,5,6]
print(np.vstack((a,b)))

输出:
[[1 2 3]
 [4 5 6]]
import numpy as np
a=[[1],[2],[3]]
b=[[1],[2],[3]]
c=[[1],[2],[3]]
d=[[1],[2],[3]]
print(np.vstack((a,b,c,d)))

输出:
[[1]
 [2]
 [3]
 [1]
 [2]
 [3]
 [1]
 [2]
 [3]
 [1]
 [2]
 [3]]
它是垂直(按照行顺序)的把数组给堆叠起来。
numpy.transpose()
http://www.360doc.com/content/19/0602/00/7669533_839717717.shtml
np.linspace
numpy.linspace(start, stop, num=50, endpoint=True, retstep=False, dtype=None, axis=0)
Return evenly spaced numbers over a specified interval.
(在start和stop之间返回均匀间隔的数据)
Returns num evenly spaced samples, calculated over the interval [start, stop].
(返回的是 [start, stop]之间的均匀分布)
The endpoint of the interval can optionally be excluded.
Changed in version 1.16.0: Non-scalar start and stop are now supported.
(可以选择是否排除间隔的终点)


start:返回样本数据开始点
stop:返回样本数据结束点
num:生成的样本数据量,默认为50
endpoint:True则包含stop;False则不包含stop
retstep:If True, return (samples, step), where step is the spacing between samples.(即如果为True则结果会给出数据间隔)
dtype:输出数组类型
axis:0(默认)或-1


>>> np.linspace(2.0, 3.0, num=5)
array([ 2.  ,  2.25,  2.5 ,  2.75,  3.  ])
>>> np.linspace(2.0, 3.0, num=5, endpoint=False)
array([ 2. ,  2.2,  2.4,  2.6,  2.8])
>>> np.linspace(2.0, 3.0, num=5, retstep=True)
(array([ 2.  ,  2.25,  2.5 ,  2.75,  3.  ]), 0.25)


【推荐】国内首个AI IDE,深度理解中文开发场景,立即下载体验Trae
【推荐】编程新体验,更懂你的AI,立即体验豆包MarsCode编程助手
【推荐】抖音旗下AI助手豆包,你的智能百科全书,全免费不限次数
【推荐】轻量又高性能的 SSH 工具 IShell:AI 加持,快人一步
· go语言实现终端里的倒计时
· 如何编写易于单元测试的代码
· 10年+ .NET Coder 心语,封装的思维:从隐藏、稳定开始理解其本质意义
· .NET Core 中如何实现缓存的预热?
· 从 HTTP 原因短语缺失研究 HTTP/2 和 HTTP/3 的设计差异
· 分享一个免费、快速、无限量使用的满血 DeepSeek R1 模型,支持深度思考和联网搜索!
· 基于 Docker 搭建 FRP 内网穿透开源项目(很简单哒)
· ollama系列01:轻松3步本地部署deepseek,普通电脑可用
· 25岁的心里话
· 按钮权限的设计及实现