Silverlight OLAP Pivot Gird
Overview
One of the most flexible controls in our library is the grid control. VIBlend DataGrid for Silverlight is the first fully functional OLAP grid for Silverlight. It brings together the features of traditional data grid controls, hierarchical grids and Excel-like pivot tables.VIBlend DataGrid for Silverlight supports both data bindings and complete unbound mode. You can visualize a database table, bind to a generic collectionor populate the grid's content through APIs without using any datasource.
Highlights
Data Binding and Unbound mode
Hierarchies on Rows and on Columns
Sorting
Filtering
Rows Grouping
Pivot tables and OLAP drill-down
Pivot table sorting by Label
Compact and traditional Pivot Rows Rendering
Built-in data aggregation functions
Summaries
Nested Grids
Row Details templates
Tooltips
Rows and Columns resize
Cell styles, Properties and Formatting
Grid Cells Templates
Cell Edit Templates
Cells Merge
Drag & Drop
Rich programming model
OLAP Drill-Through
Office 2007 and Office 2010 Themes
Regional settings support including numbers, currency, dates
Single and Multiple Cells Selection
Single and Multiple Rows and Columns Selection
Real-Time and Deferred scrolling modes
Grid lines display modes
Keyboard navigation
Export to Excel and XML
Export to HTML and CSV
Examples in C# and VB.NET
Full C# source code available
Data Binding and UnBound mode
VIBlend DataGrid for Silverlight can be bound to a data source or used in unbound mode. It provides a comprehensive set of easy to use APIs that allow you to access and customize almost every little detail.
OLAP Grid - Pivot Table Report
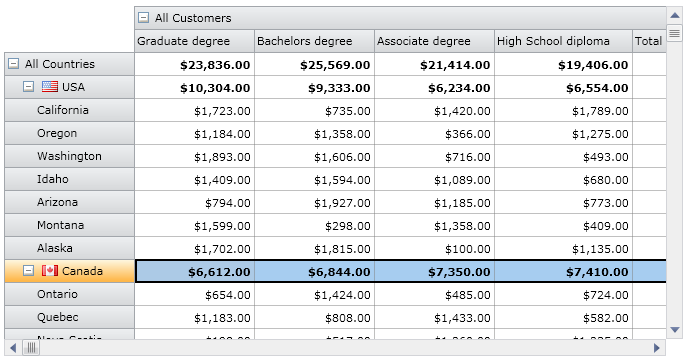
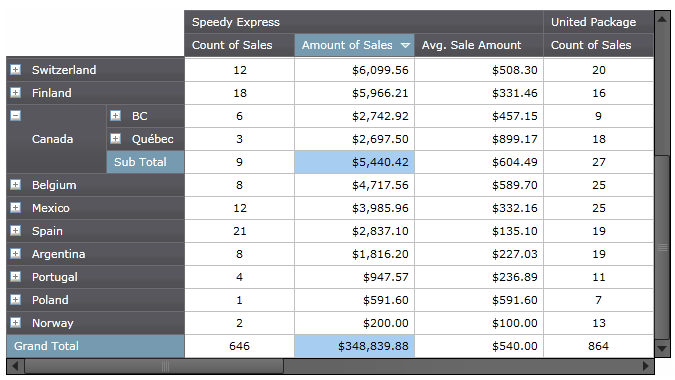
VIBlend DataGrid for Silverlight features a built-in data aggregation engine which is capable of turning any tabular data source into a wide variety of cross tab views. In a typical data grid, the data is flat and consists of many rows and columns. The data may contain multiple cells with the exact same values. In many of these scenarios working with the raw data may not be the best way to spot patterns and analysize trends. The rows grouping feature allows you to group multiple rows by columns where the corresponding grid cells have the same value. Pivot tables go one step further and enable powerful multidimensional data analysis. A Pivot table usually consits of row, column and data (value/fact) fields.
Row Details
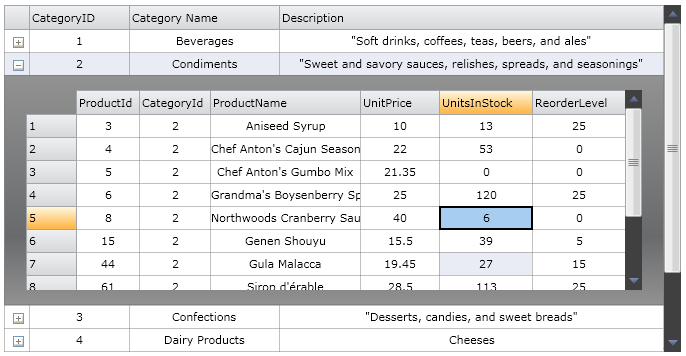
VIBlend DataGrid for Silverlight allow you to specify grid row templates that provide more detailed information. The row details functionality is enabled via standard Silverlight DataTemplates. This allows you to easily display any type of content. The row details area height is configurable for each individual row.
Rows Grouping
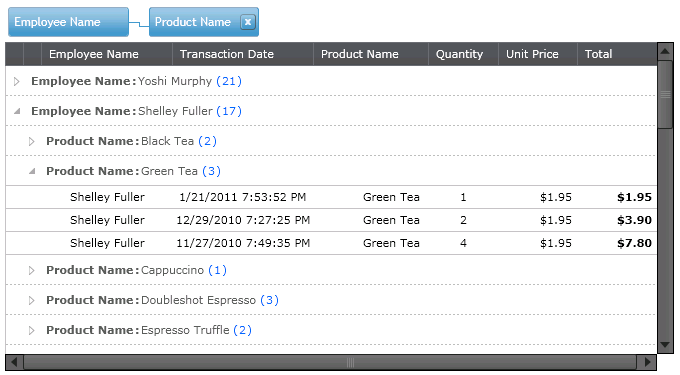
VIBlend DataGrid for Silverlight allows you to group rows by the value of one or more columns. This feature is very useful in many business applications where the data source contains a larger number of rows. For example, you can group Sales records by Product, by Date or any other data column.
Sorting by Rows or Columns
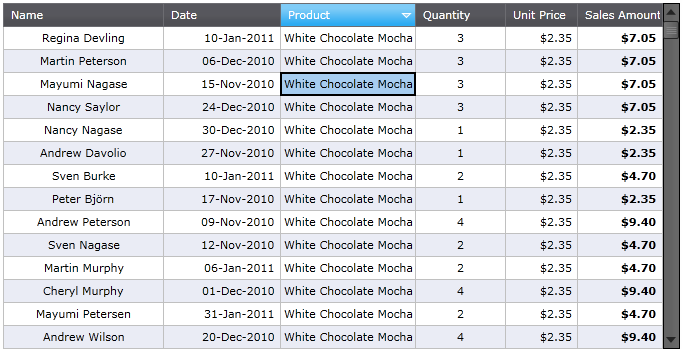
VIBlend DataGrid for Silverlight provides built-in sorting capabilities. The sorting works in both bound and unbound mode. You can sort by columns and by rows. Each column and row has a Sorting property that allows you to enable or disable the sorting functionality. In addition, the data grid control keeps track on the original sort order and you can always see the data in the original (unsorted) order. The sorting algorithm automatically detects if you are sorting numbers, dates, text or other data type, and applies a proper comparison. The sorting APIs are extensible and allow you to plug-in a custom sorting implementation.
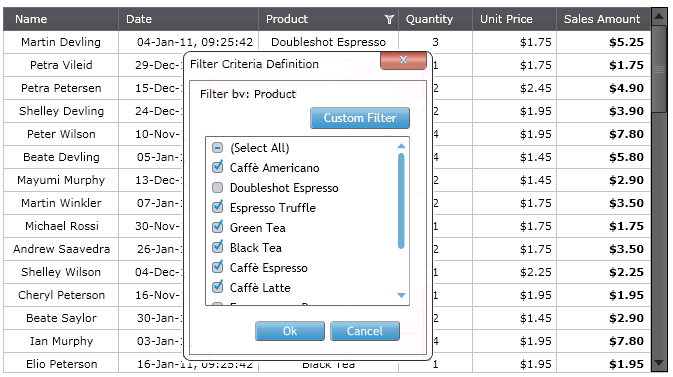
Filtering
VIBlend DataGrid for Silverlight features an advanced and extensible filtering framework. The filtering functionality works in both bound and unbound mode and you can filter by any column or row. VIBlend DataGrid provides built-in filters, and filter expression definition UI for the most common numerical, date/time and text data types. Extensible APIs allow you to build custom filters and filtering expressions for any data type.
Cells Formatting
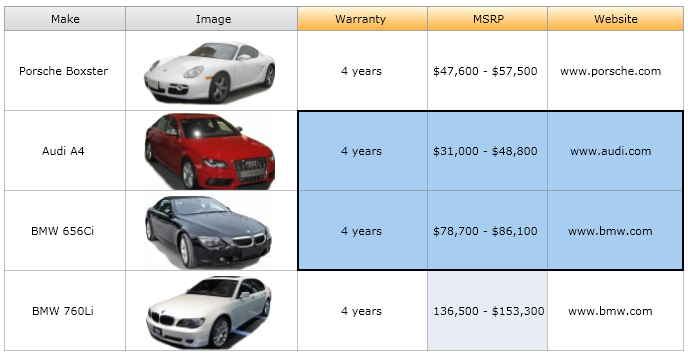
VIBlend Silverlight DataGrid allows you to use standard .NET format strings to format the grid cells content. In addition, you can completely replace the default cell template with a custom template. You can also create a custom cell style and easily replace the built-in style. Our DataGrid's cells are true Silverlight content controls, so they can contain anything.
Cell Images
You can create great looking interfaces with cell images, editable fields, animations and themes. The data grid cells are completely customizable. You can easily change Styles and DataTemplates for entire rows, columns or individual grid cells.
Nested Data Grids
VIBlend DataGrid for Silverlight allows you to display hierarchical data using nested data grids. You can add a nested grid or any other control within the row details area of the parent grid. There are no restrictions on the levels of nesting.
Sub Totals and Grand Totals
In Pivot mode, VIBlend DataGrid for Silverlight allows you to display automatic sub totals and grand totals. You can enable sub totals and grand totals independently for rows and columns.
Themes and Styling
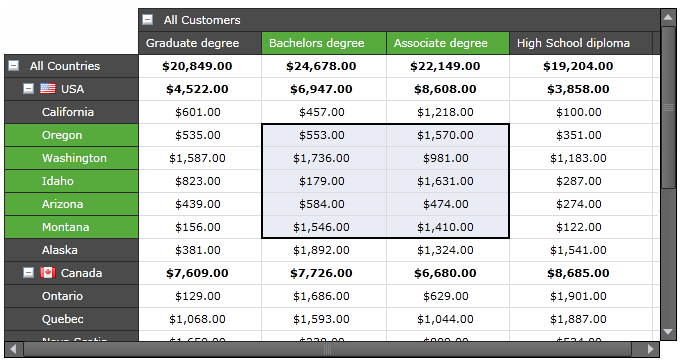
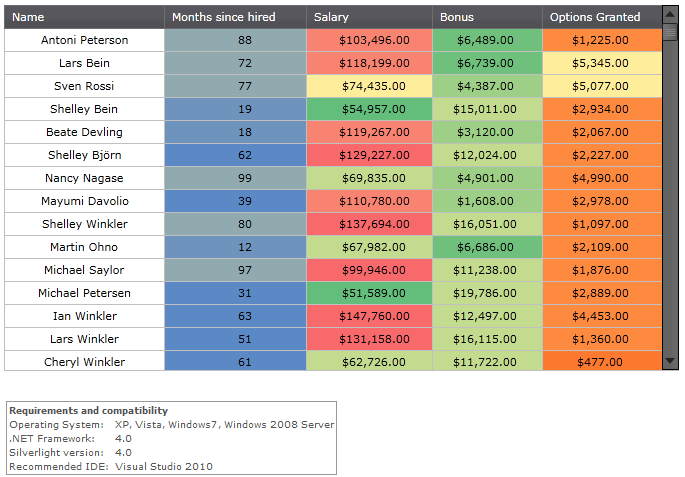
VIBlend DataGrid for Silverlight ships with a nice set of professionally designed themes. This will help you deliver consistent look and feel in your applications. The flexible infrastructure allows you to create your own themes and change the styles and colors of almost any visual element. For example, you can build a custom cell style, or cell data template and use it with any grid cell.





【推荐】国内首个AI IDE,深度理解中文开发场景,立即下载体验Trae
【推荐】编程新体验,更懂你的AI,立即体验豆包MarsCode编程助手
【推荐】抖音旗下AI助手豆包,你的智能百科全书,全免费不限次数
【推荐】轻量又高性能的 SSH 工具 IShell:AI 加持,快人一步
· 10年+ .NET Coder 心语,封装的思维:从隐藏、稳定开始理解其本质意义
· .NET Core 中如何实现缓存的预热?
· 从 HTTP 原因短语缺失研究 HTTP/2 和 HTTP/3 的设计差异
· AI与.NET技术实操系列:向量存储与相似性搜索在 .NET 中的实现
· 基于Microsoft.Extensions.AI核心库实现RAG应用
· 10年+ .NET Coder 心语 ── 封装的思维:从隐藏、稳定开始理解其本质意义
· 地球OL攻略 —— 某应届生求职总结
· 提示词工程——AI应用必不可少的技术
· Open-Sora 2.0 重磅开源!
· 周边上新:园子的第一款马克杯温暖上架
2007-04-17 最好的。NET反编译工具