leaflet 河流颜色渐变效果
1、Leaflet-polycolor
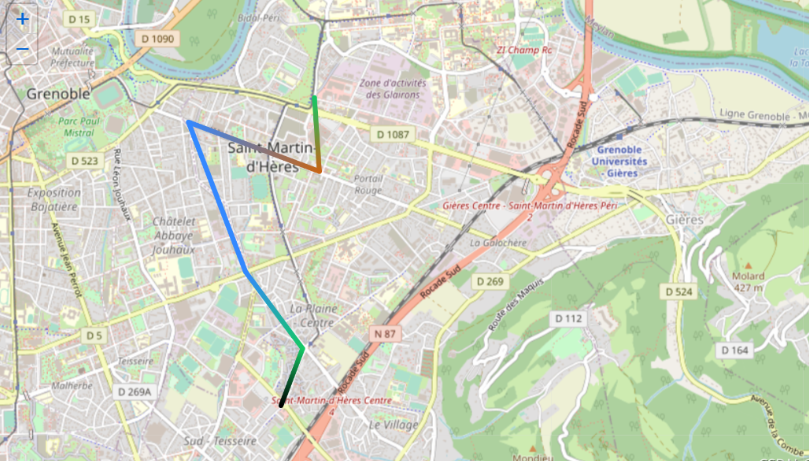
github地址:https://github.com/Oliv/leaflet-polycolor
插件缺陷:需要把每个折点的颜色都指定才行,一般做不到
2、Leaflet.hotline
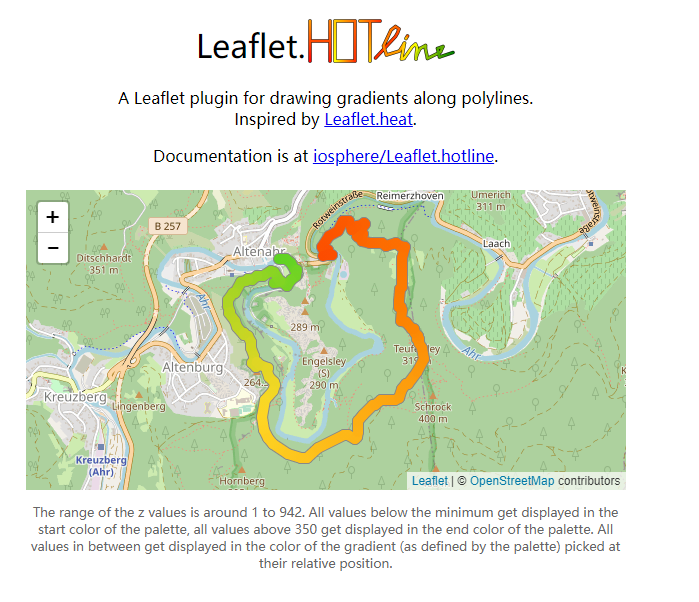
github下载地址:https://github.com/iosphere/Leaflet.hotline
完整demo示例:
<html>
<head>
<meta name="viewport" content="width=device-width,initial-scale=1,user-scalable=no">
<script src="//cdnjs.cloudflare.com/ajax/libs/leaflet/1.0.3/leaflet.js"></script>
<script src="js/coords.js"></script>
<script src="../dist/leaflet.hotline.js"></script>
<link rel="stylesheet" href="//cdnjs.cloudflare.com/ajax/libs/leaflet/1.0.3/leaflet.css" />
<style>
header,
section {
max-width: 600px;
margin: 1.5em auto;
text-align: center;
}
aside {
margin: 1.5em 0;
}
label {
display: inline-block;
padding: 0.5em;
}
input {
vertical-align: text-bottom;
}
h1 a {
text-decoration: none;
color: inherit;
font-weight: normal;
}
h1 img {
vertical-align: text-bottom;
}
#map {
width: 100%;
height: 300px;
}
.muted {
color: #666;
font-size: 0.8em;
}
</style>
</head>
<body>
<header>
<h1>
<a href="https://github.com/iosphere/Leaflet.hotline/">Leaflet.<img src="img/hotline.png" alt="hotline" height="50"/></a>
</h1>
<p>A Leaflet plugin for drawing gradients along polylines. <br>
Inspired by <a href="https://github.com/Leaflet/Leaflet.heat">Leaflet.heat</a>.</p>
<p>Documentation is at <a href="https://github.com/iosphere/Leaflet.hotline/">iosphere/Leaflet.hotline</a>.</p>
</header>
<section>
<div id="map"></div>
<p class="muted">The range of the z values is around 1 to 942. All values below the minimum get displayed in the start color of the palette, all values above 350 get displayed in the end color of the palette. All values in between get displayed in the color of the gradient (as defined by the palette) picked at their relative position.</p>
</section>
<script>
var tiles = L.tileLayer('//{s}.tile.osm.org/{z}/{x}/{y}.png', {
attribution: '© <a href="http://osm.org/copyright">OpenStreetMap</a> contributors'
});
var map = L.map('map', {
layers: [tiles],
});
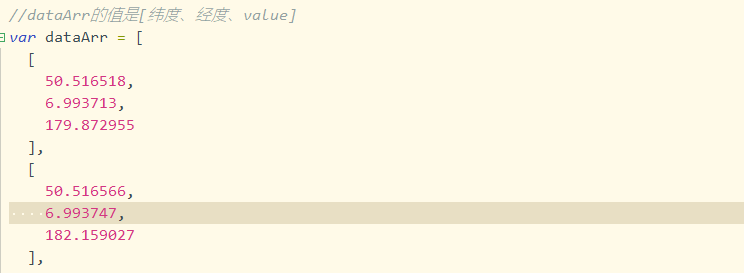
//dataArr长度是942,给dataArr的z值重新赋值,模拟总磷的范围变化3~6
i=3;
dataArr.forEach((item)=>{
item[2]=i;
i=i+0.003;
});
//创建hotline对象,dataArr的值是[x值、y值、z值]
var hotlineLayer = L.hotline(dataArr, {
min: 1,//z值的最小值
max: 6,//z值的最大值
palette: {
0.0: '#3CC5F1',
0.2: '#12AAEE',
0.4: '#5ED323',
0.6: '#FED724',
0.8: '#FC8402',
1.0: '#FC3F00'
},
weight: 10,//线条粗细
outlineColor: '#888888',//边框线颜色
outlineWidth: 1//边框线粗细
});
map.fitBounds(hotlineLayer.getBounds());
hotlineLayer.addTo(map);
</script>
</body>
</html>
3、mapboxgl 中插值表达式

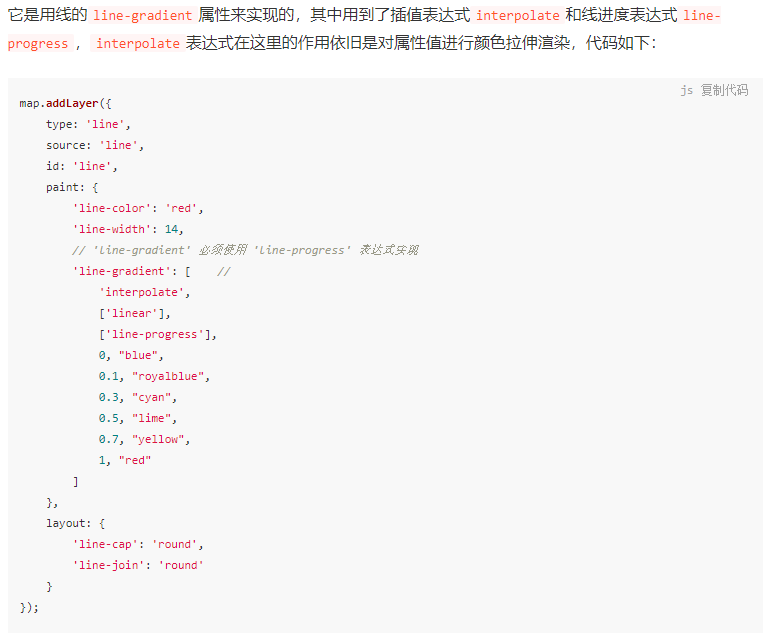
完整示例如下:https://docs.mapbox.com/mapbox-gl-js/example/line-gradient/
参考博客地址:https://juejin.cn/post/7096052657604788232
4、canvas动态绘制
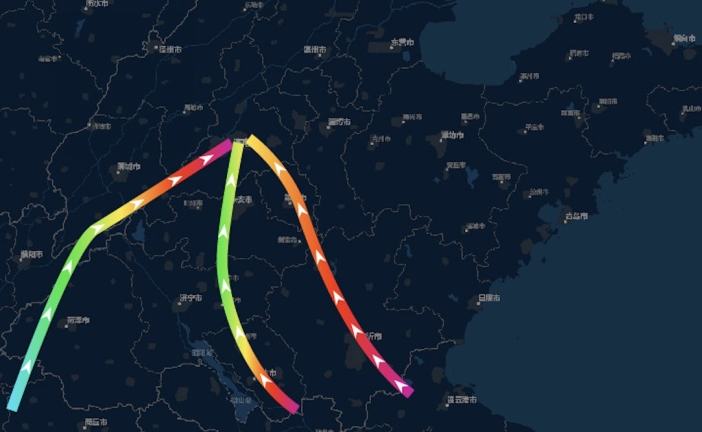
连接地址:https://blog.csdn.net/weixin_34353688/article/details/112120676


 浙公网安备 33010602011771号