streamlit数据可视化web基本
streamlit数据可视化web基本
Streamlit 是一个用于机器学习、数据可视化的 Python 框架,能够快速构建数据分析和机器学习Web页面。
安装
pip install streamlit
# 导入
import streamlit as st
服务启动
streamlit run example.py
# 修改端口
streamlit run example.py     --server.port  32002
显示内容
st.write(*args, **kwargs)      强大且灵活的显示方法,支持HTML,Markdown,DataFrame等
st.markdown:	利用Markdown语法展示丰富文本内容,如标题、段落、链接和图片。
st.title:		引入一个大标题,为您的博客增添震撼效果。
st.header:		添加分隔和上下文的标题,以更好地组织内容。
st.subheader:	用于细分内容的子标题,提供更多层级的结构。
st.caption:		添加图表或图像的标题解释文本,完美配合可视化展示。
st.code:		展示源代码或特定语言的代码块,使您的示例更具可读性。
st.text:		展示普通文本内容,将信息清晰简洁地传达给读者。
st.latex:		展示LaTeX数学表达式和公式,为您的技术文章增添学术魅力。
st.divider:		插入一个分割线,以凸显不同章节之间的鲜明区分。
st.write(*args, **kwargs)
将传入的内容显示在页面中,极其强大和灵活,支持HTML,Markdown,DataFrame,Image,URL,PDF

args (any)
    write(string)       #
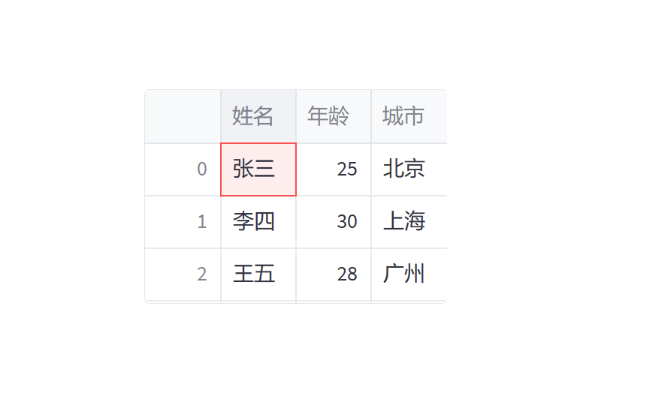
    write(data_frame)   # 将data_frame显示为表格
    write(error)
    write(func)         # 显示一个函数的相关信息
    write(module)
    write(dict)
    write(mpl_fig)
    write(altair)
    write(keras)
    write(graphviz)
    write(plotly_fig)
    write(bokeh_fig)
    write(sympy_expr)
    write(htmlable)    # 支持显示HTML标记语言的内容
    write(obj)
unsafe_allow_html (bool)
st.write("<h1 style='color: blue;'>这是HTML内容</h1>", unsafe_allow_html=True)  # html标记文本
st.write("这是一个列表:\n\n- 项目1\n- 项目2\n- 项目3")                           #  markdown格式


import pandas as pd
data = {'姓名': ['张三', '李四', '王五'],
        '年龄': [25, 30, 28],
        '城市': ['北京', '上海', '广州']}

df = pd.DataFrame(data)
st.write(df)

显示markdown
st.markdown(body, unsafe_allow_html=False)
import streamlit as st

st.markdown('Streamlit is **_really_ cool**.')                                            # 加粗和斜体
st.markdown("This text is :red[colored red], and this is **:blue[colored]** and bold.")   # 颜色
st.markdown(":green[$\sqrt{x^2+y^2}=1$] is a Pythagorean identity. :pencil:")             # 公式
显示标题
st.title
st.title(body, anchor=None) # 显示大标题
import streamlit as st

st.title('This is a title')
st.title('A title with _italics_ :blue[colors] and emojis :sunglasses:')
st.header(body)             # 引入小标题

import streamlit as st

st.header('This is a header')
st.header('A header with _italics_ :blue[colors] and emojis :sunglasses:')
st.header(body)           # 引入次级标题

import streamlit as st

st.subheader('This is a subheader')
st.subheader('A subheader with _italics_ :blue[colors] and emojis :sunglasses:')
st.caption(body)         # 添加解释性文字,通常用于解释上面的内容或提供额外的上下文


import streamlit as st

st.caption('This is a string that explains something above.')
st.caption('A caption with _italics_ :blue[colors] and emojis :sunglasses:')
显示文本公式
import streamlit as st

st.text('This is some text.')


import streamlit as st

st.latex(r'''
    a + ar + a r^2 + a r^3 + \cdots + a r^{n-1} =
    \sum_{k=0}^{n-1} ar^k =
    a \left(\frac{1-r^{n}}{1-r}\right)
    ''')
显示code
st.code(body, language="python")
code = '''
def hello_world():
    print("Hello, World!")
hello_world()
'''

st.code(code, language='python')
显示分割线
import streamlit as st

st.write("This is some text.")
st.slider("This is a slider", 0, 100, (25, 75))
st.divider()  # Draws a horizontal rule
st.write("This text is between the horizontal rules.")
st.divider()  # Another horizontal rule
显示图表
import matplotlib.pyplot as plt
import numpy as np
import streamlit as st


# matplotlib 和 streamlit 联合使用
x = np.linspace(0, 10, 100)
y = np.sin(x)

fig, ax = plt.subplots()
ax.plot(x, y)

st.write(fig)
显示图片视频
from PIL import Image
import streamlit as st
# 加载本地图片文件
image = Image.open("image.jpg")
# 使用st.write()函数显示图片
st.write("显示本地图片文件")
st.image(image,caption="Image caption")
st.image(image, caption='Sunrise by the mountains', width=300) # 调整图像的尺寸
# 图片URL链接
image_url = "https://example.com/image.jpg"
# 使用st.write()函数显示图片
st.write("显示URL链接中的图片")
st.write(f"")
# 读取 PDF 文件的二进制数据
with open("document.pdf", "rb") as f:
pdf_bytes = f.read()
# 使用 st.write() 函数显示 PDF 文件
st.write(pdf_bytes, format="pdf")
import streamlit as st

# 打开视频文件
video_file = open('myvideo.mp4', 'rb')
video_bytes = video_file.read()

# 使用st.video函数播放视频
st.video(video_bytes)
参考资料
https://docs.streamlit.io/library/get-started 官方文档
https://zhuanlan.zhihu.com/p/448853407?utm_id=0
https://zhuanlan.zhihu.com/p/553612847
https://blog.csdn.net/qq_31034569/article/details/122152973
https://blog.csdn.net/weixin_46043195/article/details/132124940


