
深度学习评价指标
评价指标
准确率 Accuracy,混淆矩阵 Confusion Matrix,精确率Precision,召回率Recall,平均正确率AP,mean Average Precision mAP,交除并IoU,ROC + AUC,非极大值抑制(NMS)
交并比-IOU
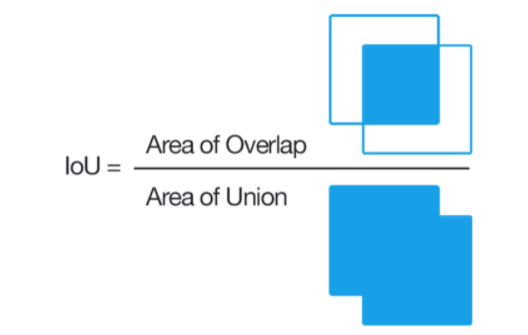
预测框与标注框的交集与并集之比,数值越大表示该检测器的性能越好。
一般情况下对于检测框的判定都会存在一个阈值,也就是IoU的阈值,一般可以设置当IoU的值大于0.5的时候,则可认为检测到目标物体。
def box_iou_calc(boxes1, boxes2):
    # https://github.com/pytorch/vision/blob/master/torchvision/ops/boxes.py
    """
    Return intersection-over-union (Jaccard index) of boxes.
    Both sets of boxes are expected to be in (x1, y1, x2, y2) format.
    Arguments:
        boxes1 (Array[N, 4])
        boxes2 (Array[M, 4])
    Returns:
        iou (Array[N, M]): the NxM matrix containing the pairwise
            IoU values for every element in boxes1 and boxes2
    This implementation is taken from the above link and changed so that it only uses numpy..
    """

    def box_area(box):
        # box = 4xn
        return (box[2] - box[0]) * (box[3] - box[1])

    area1 = box_area(boxes1.T)
    area2 = box_area(boxes2.T)


    lt = np.maximum(boxes1[:, None, :2], boxes2[:, :2])  # [N,1,2] and [M,2] >>> [N,M,2]  # 交集左下角
    print(lt.shape)
    rb = np.minimum(boxes1[:, None, 2:], boxes2[:, 2:])  # [N,M,2]  # 交集右上角


    inter = np.prod(np.clip(rb - lt, a_min=0, a_max=None), 2)     # [N,M]  坐标相乘,且最小为0

    return inter / (area1[:, None] + area2 - inter)  # iou = inter / (area1 + area2 - inter)

# torch 版本
def box_iou(box1, box2):
    # https://github.com/pytorch/vision/blob/master/torchvision/ops/boxes.py
    """
    Return intersection-over-union (Jaccard index) of boxes.
    Both sets of boxes are expected to be in (x1, y1, x2, y2) format.
    Arguments:
        box1 (Tensor[N, 4])
        box2 (Tensor[M, 4])
    Returns:
        iou (Tensor[N, M]): the NxM matrix containing the pairwise
            IoU values for every element in boxes1 and boxes2
    """

    def box_area(box):
        # box = 4xn
        return (box[2] - box[0]) * (box[3] - box[1])

    area1 = box_area(box1.T)
    area2 = box_area(box2.T)

    # inter(N,M) = (rb(N,M,2) - lt(N,M,2)).clamp(0).prod(2)
    inter = (torch.min(box1[:, None, 2:], box2[:, 2:]) - torch.max(box1[:, None, :2], box2[:, :2])).clamp(0).prod(2)
    iou = inter / (area1[:, None] + area2 - inter)
    return iou  # iou = inter / (area1 + area2 - inter)
混淆矩阵-Confusion Matrix
混淆矩阵是ROC曲线绘制的基础,同时它也是衡量分类型模型准确度中最基本,最直观,计算最简单的方法。
混淆矩阵中的横轴是模型预测的类别数量统计,纵轴是数据真实标签的数量统计。
| 实验预测 | 实验预测 | 实验预测 | ||
|---|---|---|---|---|
| car | person | char | ||
| 真实 | car | 5 | 3 | 0 |
| 真实 | person | 4 | 8 | 0 |
| 真实 | char | 0 | 2 | 6 |
对角线,表示模型预测和数据标签一致的数目,所以对角线之和除以测试集总数就是 准确率。对角线上数字越大越好,在可视化结果中颜色越深,说明模型在该类的预测准确率越高。如果按行来看,每行不在对角线位置的就是错误预测的类别。总的来说,我们希望对角线越高越好,非对角线越低越好。
- 预测值为正例,记为P(Positive)
- 预测值为反例,记为N(Negative)
- 预测值与真实值相同,记为T(True)
- 预测值与真实值相反,记为F(False)
对应对car这个类别的混淆表格为
| 预测为正P | 预测为负数N | |
|---|---|---|
| 真实为正 | TP=8 | FN=3 |
| 真实为负 | FP=4 | TN=16 |
对应person这类别的混淆表格为
| 预测为正P | 预测为负数N | |
|---|---|---|
| 真实为正 | TP=8 | FN=4 |
| 真实为负 | FP=5 | TN=11 |
- TP-预测为正例,实际为正例——正样本 正确识别为正
- TN-预测为负例,实际为负例——负样本 正确识别为负
- FP-预测为正例,实际为负例——正样本 错误识别为负
- FN-预测为负例,实际为正例——负样本 错误识别为正
记忆技巧
-
第 1 个字母表示算法预测正确或者错误,即 True、False 描述的是这个分类器是否判断正确。
-
第 2 个字母表示算法预测的结果,即 Positive、Negative 是这个分类器的分类结果
TP+TN+FP+FN= 总样本数
P = TP + FN :所有 "实际为正例" 的样本数
N = FP + TN :所有 "实际 为负例" 的样本数
准确率(Acc)
准确率一般用来评估模型的全局准确程度,不能包含太多信息,无法全面评价一个模型性能。
准确率accuracy常见的评价指标,被分对的样本数除以所有的样本数,通常来说,准确率越高,分类器越好
公式
accuracy = (TP+TN)/(TP+TN+FP+FN)
- 分母是全部四种数据;分子中第一个字母是 T 表示 "算法预测正确了"。
特点
准确率有一个缺点,就是数据的样本不均衡,这个指标是不能评价模型的性能优劣的。
假如一个测试集有正样本99个,负样本1个。我们设计的模型是个无脑模型,即把所有的样本都预测为正样本,那么模型的Accuracy为99%,看评价指标,模型的效果很好,但实际上模型没有任何预测能力。
精准率(Precision)
针对预测,又称为查准率
Precision 在预测的结果来统计, 就是在识别出来的图片中,即在模型预测为正样本的结果中,真正是正样本所占的百分比。或者说是 在预测为正样本的结果中,有多少是准确的
公式
分母中, TP表示 : 算法预测正确 & 预测的是正例,FP表示 : 算法预测错误 & 预测的是正例(实际是负例)
特点
分类阈值较高,需要尽可能地把所需的类别检测准确,而不在乎这些类别是否都被检测出来。比如对于罪犯的预测,我们希望预测结果是非常准确的,即使放过了一些真正的罪犯,也不能错怪一个好人。
召回率(Recall)
针对原始样本真实数据的一个评价指标,又称为查全率
Recall 是在实际为正样本中,被预测为正样本所占的百分比
预测样本中实际正样本数 / 预测的样本数即 Recall=TP/(TP+FN) 找的全的比例
公式
特点
召回率分类阈值较低。尽量检测数据,不遗漏数据,所谓的宁肯错杀一千,不肯放过一个。
比如对于地震的预测,希望每次地震都能被预测出来,这个时候可以牺牲precision。假如一共发生了10次地震,我们情愿发出1000次警报
精准率 VS 召回率
关注点不同
召回率是覆盖面的度量,度量有多个真实正例被预测为正例。精度是精确性的度量,表示被预测为正例的示例中实际为正例的比例。
不同的应用场景下,我们的关注点不同
相互矛盾
- recall和precision是相互矛盾的。如果想要更高的recall,那么就要让模型的预测能覆盖到更多的样本,但是这样模型就更有可能犯错,也就是说precision会比较低。如果模型很保守,只能检测出它很确定的样本,那么其precision会很高,但是recall会相对低。
- recall(TPR)的分母是样本中正类的个数,因此样本一旦确定,其分母即为定值,也就是说recall的变化随分子增加而单调递增;precision的分母是样本中预测为正类的个数,其会随着分类阈值的变化而变化,因此Precision的变化受TP和FP的综合影响,不单调,变化情况不可预测。
Precision-recall 曲线
改变识别阈值,使得系统依次能够识别前K张图片,阈值的变化同时会导致Precision与Recall值发生变化,从而得到曲线。
如果一个分类器的性能比较好,那么它应该有如下的表现:
在Recall值增长的同时,Precision的值保持在一个很高的水平。
而性能比较差的分类器可能会损失很多Precision值才能换来Recall值的提高。
通常情况下,文章中都会使用Precision-recall曲线,来显示出分类器在Precision与Recall之间的权衡。
PR曲线中precision为纵坐标,recall为横坐标
如果模型的精度越高,召回率越高,那么模型的性能越好。也就是说PR曲线下面的面积越大,模型的性能越好
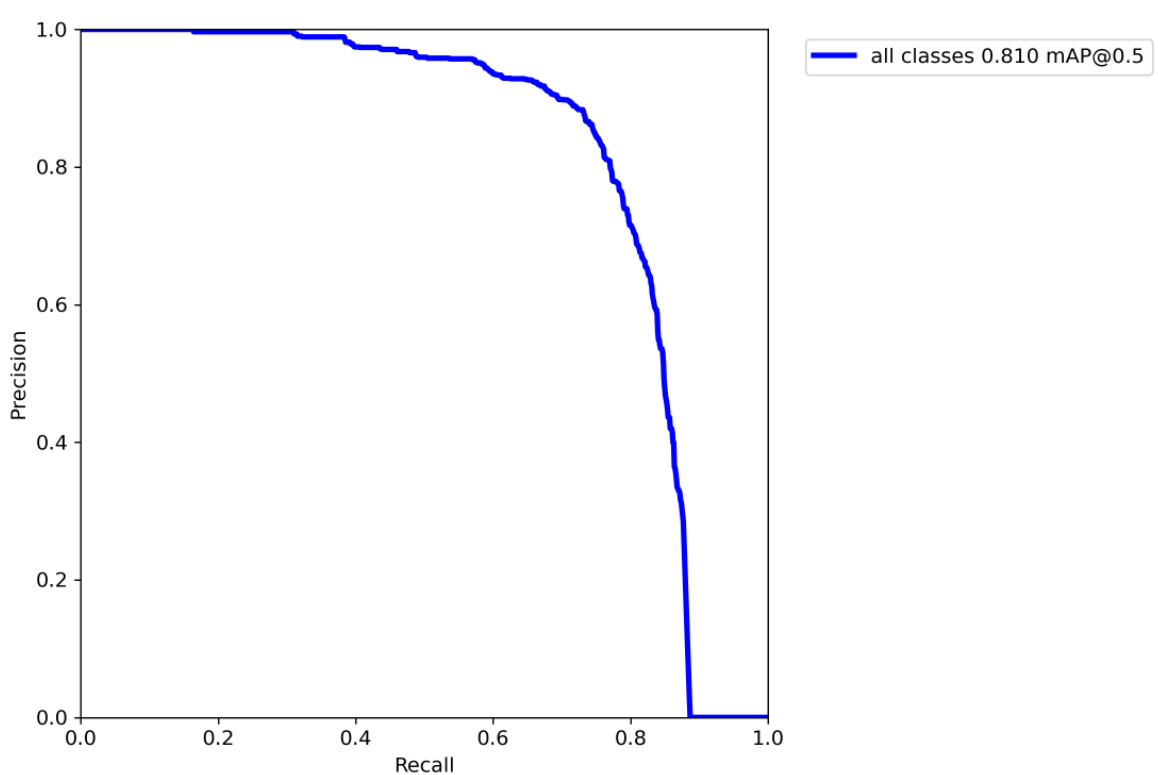
PR曲线反映了分类器对正例的识别准确程度和对正例的覆盖能力之间的权衡。
F1 Score
在一些场景下要兼顾精准率和召回率,就有 F1 score。F1值就是精确值和召回率的调和均值
准确率和召回率的调和平均
F1分数(F1-score)是分类问题的一个衡量指标。F1分数认为召回率和精度同等重要, 一些多分类问题的机器学习竞赛,常常将F1-score作为最终测评的方法。它是精确率和召回率的调和平均数,最大为1,最小为0
F1 = 2TP/(2TP+FP+FN)
公式
此外还有F2分数和F0.5分数。F2分数认为召回率的重要程度是精度的2倍,而F0.5分数认为召回率的重要程度是精度的一半
特点
调和平均数的性质就是,只有当精准率和召回率二者都非常高的时候,它们的调和平均才会高
Average-Precision(AP)
AP即Average Precision,称为平均精准率,是对不同召回率点上的准确率进行平均,在PR曲线图上表现为PR曲线下面的面积。AP的值越大,则说明模型的平均准确率越高。
AP就是Precision-recall 曲线下面的面积,通常来说一个越好的分类器,AP值越高。
mean Average Precision(mAP)
MAP 均值平均精度
mAP = 所有类别的平均精度求和除以所有类别
- mAP: mean Average Precision, 即各类别AP的平均值
- AP: PR曲线下面积
- PR曲线: Precision-Recall曲线
- Precision: TP / (TP + FP)
- Recall: TP / (TP + FN)
- TP: IoU>0.5的检测框数量(同一Ground Truth只计算一次)
- FP: IoU<=0.5的检测框,或者是检测到同一个GT的多余检测框的数量
- FN: 没有检测到的GT的数量
公式
mAP衡量的是的模型在所有类别上的好坏,是目标检测中一个最为重要的指标,一般看论文或者评估一个目标检测模型,都会看这个值,这个值是在0-1直接,越大越好。
mAP 的计算大致可以分解为以下几步:
| 阶段 | 输出 | 关键变量 |
|---|---|---|
| 针对单个目标 | TP、FP、FN | IOU(交并比) |
| 针对单个类别 | PR-Curve、AP | Confidence(置信度) |
| 针对测试集全集 | mAP |
对于任何算法,评估指标需要知道ground truth(真实标签)数据。 我们只知道训练、验证和测试数据集的ground truth。对于目标检测问题,ground truth包括图像中物体的类别以及该图像中每个物体的真实边界框。
我们首先需要判断每个检测的正确性。这里采用IoU(Intersection over Union),它可以作为评价边界框正确性的度量指标
def compute_ap(gt_boxes, gt_class_ids,
               pred_boxes, pred_class_ids, pred_scores,
               iou_threshold=0.5):
    """Compute Average Precision at a set IoU threshold (default 0.5).

    Returns:
    mAP: Mean Average Precision
    precisions: List of precisions at different class score thresholds.
    recalls: List of recall values at different class score thresholds.
    overlaps: [pred_boxes, gt_boxes] IoU overlaps.
    """
    # Trim zero padding and sort predictions by score from high to low
    gt_boxes = trim_zeros(gt_boxes)
    pred_boxes = trim_zeros(pred_boxes)
    pred_scores = pred_scores[:pred_boxes.shape[0]]
    indices = np.argsort(pred_scores)[::-1]
    pred_boxes = pred_boxes[indices]
    pred_class_ids = pred_class_ids[indices]
    pred_scores = pred_scores[indices]

    # Compute IoU overlaps [pred_boxes, gt_boxes]
    overlaps = compute_overlaps(pred_boxes, gt_boxes)

    # Loop through ground truth boxes and find matching predictions
    match_count = 0
    pred_match = np.zeros([pred_boxes.shape[0]])
    gt_match = np.zeros([gt_boxes.shape[0]])
    for i in range(len(pred_boxes)):
        # Find best matching ground truth box
        sorted_ixs = np.argsort(overlaps[i])[::-1]
        for j in sorted_ixs:
            # If ground truth box is already matched, go to next one
            if gt_match[j] == 1:
                continue
            # If we reach IoU smaller than the threshold, end the loop
            iou = overlaps[i, j]
            if iou < iou_threshold:
                break
            # Do we have a match?
            if pred_class_ids[i] == gt_class_ids[j]:
                match_count += 1
                gt_match[j] = 1
                pred_match[i] = 1
                break

    # Compute precision and recall at each prediction box step
    precisions = np.cumsum(pred_match) / (np.arange(len(pred_match)) + 1)
    recalls = np.cumsum(pred_match).astype(np.float32) / len(gt_match)

    # Pad with start and end values to simplify the math
    precisions = np.concatenate([[0], precisions, [0]])
    recalls = np.concatenate([[0], recalls, [1]])

    # Ensure precision values decrease but don't increase. This way, the
    # precision value at each recall threshold is the maximum it can be
    # for all following recall thresholds, as specified by the VOC paper.
    for i in range(len(precisions) - 2, -1, -1):
        precisions[i] = np.maximum(precisions[i], precisions[i + 1])

    # Compute mean AP over recall range
    indices = np.where(recalls[:-1] != recalls[1:])[0] + 1
    mAP = np.sum((recalls[indices] - recalls[indices - 1]) *
                 precisions[indices])

    return mAP, precisions, recalls,
