随笔分类 - Prometheus
摘要:Thanos Query: 实现了 Prometheus API,将来自下游组件提供的数据进行聚合最终返回给查询数据的 client (如 grafana),类似数据库中间件。 Querier是Thanos中负责处理查询请求的组件。它可以从多个数据源(如Thanos Sidecars、Store G
阅读全文
摘要:早期 kubelet中集成cAdvisor,采集该节点的资源及容器相关指标,支持的指标包括 CPU,内存,网络吞吐量,文件系统使用率,并通过4194端口提供web ui.
阅读全文
摘要:prometheus-operator: 是通过CRD来部署和管理 Prometheus Server,同时监控这些自定义资源事件的变化来做相应的处理,是整个系统的控制中心。 Service: 简单的说就是 Prometheus 监控的对象 ServiceMonitor: (相当于exporter
阅读全文
摘要:Histogram直方图,可以反应一段时间内,不通值的分布
阅读全文
摘要:prometheus-operator里的alertManager实例是通过服务发现的方式来做的 自定义rule apiVersion: monitoring.coreos.com/v1 kind: PrometheusRule metadata: labels: prometheus: k8s r
阅读全文
摘要:kubectl -n monitoring create secret generic etcd-certs --from-file=/etc/kubernetes/pki/etcd/peer.crt --from-file=/etc/kubernetes/pki/etcd/peer.key --f
阅读全文
摘要:修改scheduler的监听地址 给 scheduler创建service, 便于monitor通过service的label找到pod apiVersion: v1 kind: Service metadata: namespace: kube-system name: kube-schedule
阅读全文
摘要:节点node: cpu使用率 内存使用率 网络使用率,带宽 tcp连接 集群监控 pod监控 pod重启 readiless 就绪检查
阅读全文
摘要:granfana https://blog.csdn.net/ccy19910925/article/details/86649518 prometheus.yaml.tmpl: |- global: scrape_interval: 5s evaluation_interval: 5s exter
阅读全文
摘要:https://blog.csdn.net/xxxxaayy/article/details/104989792 https://blog.csdn.net/u013256816/article/details/110251564 https://blog.csdn.net/yuanpan1987/
阅读全文
摘要: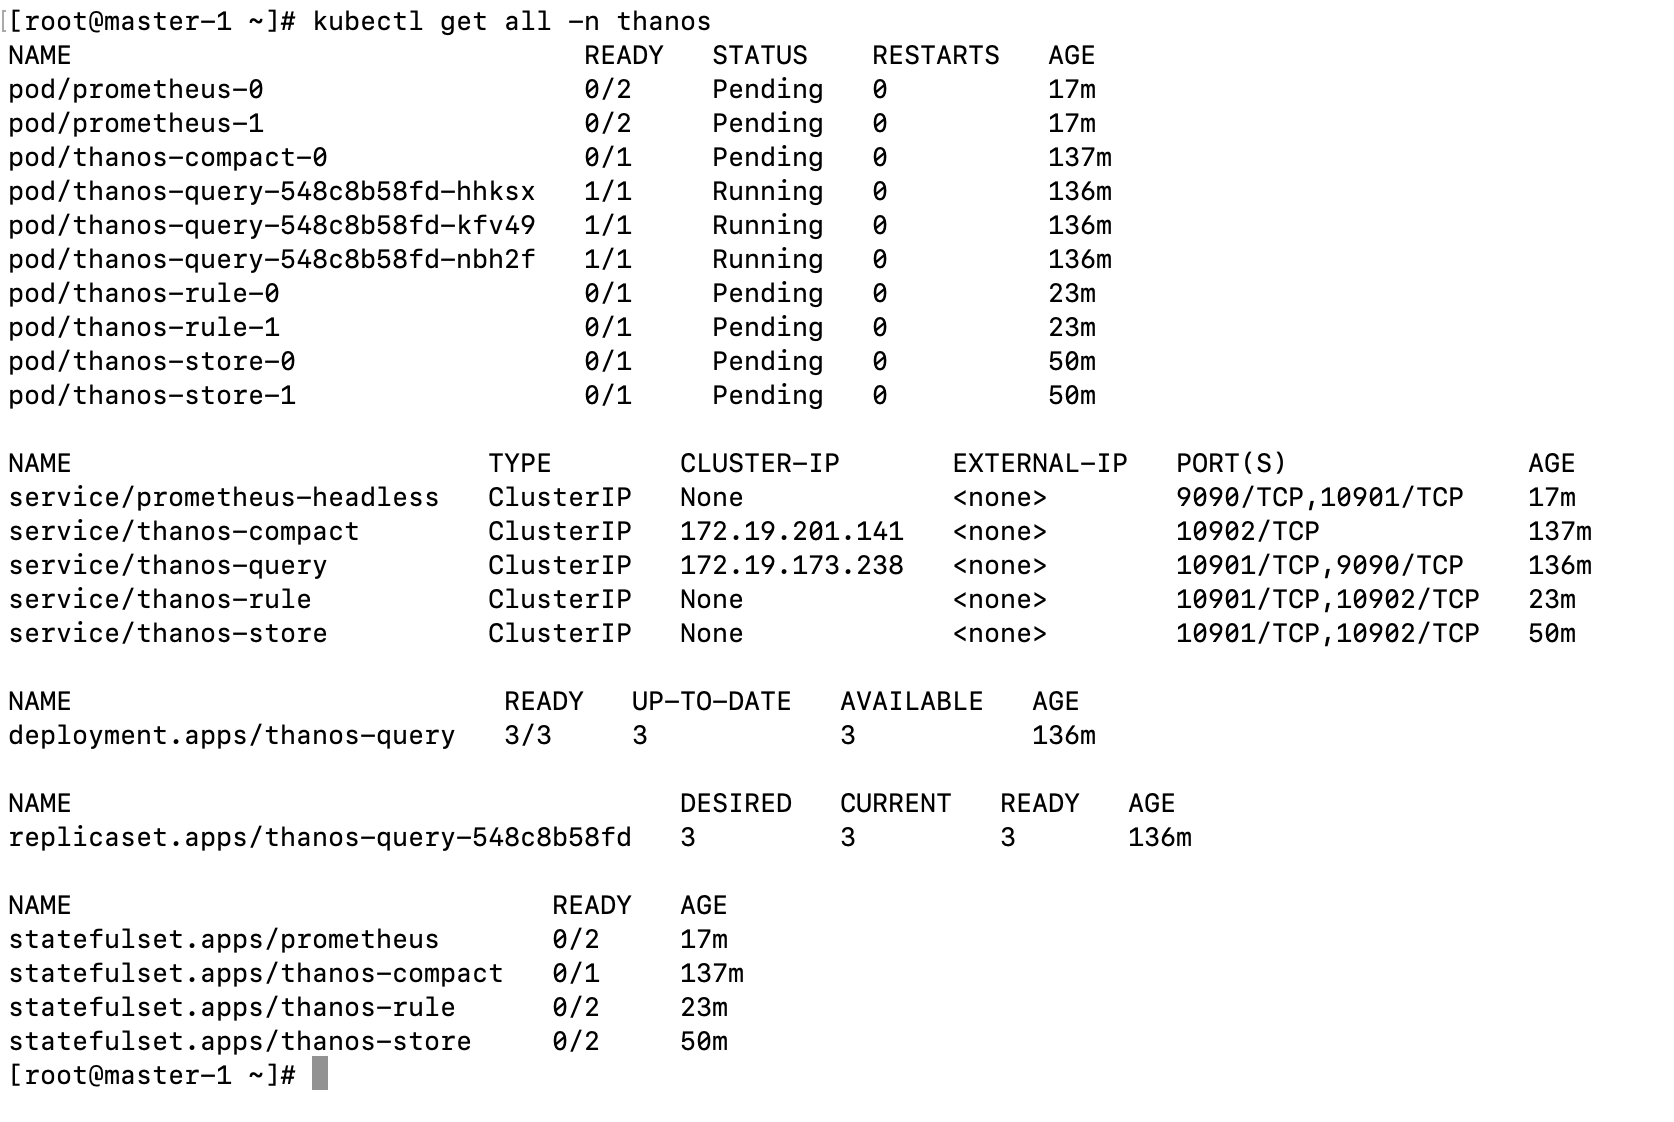
阅读全文
摘要:Thanos常用组件: 1,Thanos Query: 实现了 Prometheus API,将来自下游组件提供的数据进行聚合最终返回给查询数据的 client (如 grafana),类似数据库中间件。 2,Thanos Sidecar: 连接 Prometheus,将其数据提供给 Thanos
阅读全文
 浙公网安备 33010602011771号