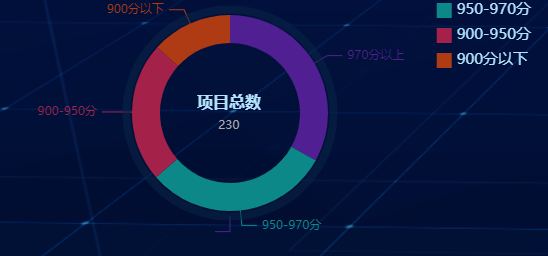
echarts 饼图给外层加边框

在series里面再加一个圆,设置他的位置和边框大小即可。
data() {
    return {
        option: {
            title: {
                show: true,
                text: '项目总数',
                subtext: 230,
                itemGap: 8,
                left: '49%',
                top: '42%',
                textStyle: {
                    color: '#B4E4FF',
                    fontSize: 16,
                },
                textAlign:'center'
            },
            tooltip: {
                trigger: 'item',
                formatter: '{a} <br/>{b}: {c} ({d}%)'
            },
            legend: {
                orient: 'vertical',
                icon: "rect",
                top: 0,
                right: 0,
                itemWidth: 15,
                itemHeight: 15,
                textStyle: {
                    color: '#B4E4FF',
                    fontSize: 15
                },
                data: ['970分以上', '950-970分', '900-950分', '900分以下']
            },
            color : [ '#502092', '#0d8888', '#a4224a', '#af3b14' ],
            graphic: {
                type: 'text',
                style: {
                    textAlign: 'center',
                    fill: 'rgb(149,162,255)',
                    width: 30,
                    height: 30,
                }
            },
            series: [
                {
                    name: '项目分数',
                    type: 'pie',
                    radius: ['50%', '70%'],
                    avoidLabelOverlap: false,
                    labelLine: {
                        show: true
                    },
                    data: [
                        {value: 335, name: '970分以上'},
                        {value: 310, name: '950-970分'},
                        {value: 234, name: '900-950分'},
                        {value: 135, name: '900分以下'},
                    ]
                },
                {
                    name: '外边框',
                    type: 'pie',
                    clockWise: false,
                    radius: ['74%', '74%'],//边框大小
                    center: ['50%', '50%'],//边框位置
                    data: [{
                        value: 10,
                        itemStyle: {
                            normal: {
                                borderWidth: 8,//设置边框粗细
                                borderColor: 'rgb(9,37,71, 0.5)'//边框颜色
                            }
                        }
                    }]
                },
            ]
        },
    };


