压测筑基-性能监控
1、性能监控配置
除了在终端中查看性能测试过程和结果汇总数据之外,我们还可以通过配置 Prometheus + Grafana 看板,实现 Web 化的实时监控指标展示。
2、配置Prometheus 和 pushgateway
在官网 Download | Prometheus 下载 prometheus 与 pushgateway,并进行如下配置。
Pushgateway 不需要修改任何配置文件,直接运行可执行文件即可启动,默认端口号为 9091,如需更改端口号,需启动时指定。启动 Pushgateway:
./pushgateway --web.listen-address=":9091"
prometheus 配置,打开安装根目录 选择prometheus.yml 文件进行如下修改
  scrape_interval:     15s # By default, scrape targets every 15 seconds.
  evaluation_interval: 15s # Evaluate rules every 15 seconds.
  # Attach these extra labels to all timeseries collected by this Prometheus instance.
  external_labels:
    monitor: 'codelab-monitor'

rule_files:
  - 'prometheus.rules.yml'

scrape_configs:
  - job_name: 'prometheus'
    # Override the global default and scrape targets from this job every 5 seconds.
    scrape_interval: 5s

    static_configs:
      - targets: ['localhost:9090']

  - job_name: 'pushgateway'  # metrics_path defaults to '/metrics'  # scheme defaults to 'http'.
    scrape_interval: 3s
    static_configs:
      - targets: ['localhost:9091']
        labels:
          instance: httprunner
注意:Pushgateway 的 scrape_interval 需要与 HttpRunner 上报数据频率保持一致,即设置为 3s。
启动 Prometheus Server:
./prometheus --config.file=prometheus.yml
3、配置httprunner
在使用 hrp boom 启动性能测试时通过 prometheus-gateway 参数设置 Pushgateway 地址即可,如 --prometheus-gateway=":9091"。在性能过程中,HttpRunner 会以 3s 的数据上报间隔将性能测试指标上报到 Pushgateway。
hrp boom .\demo.json --spawn-count 100 --spawn-rate 10 --prometheus-gateway="localhost:9091"
4、配置Grafana
下载安装 Grafana | Prometheus
安装后进入bin目录依次启动,启动后
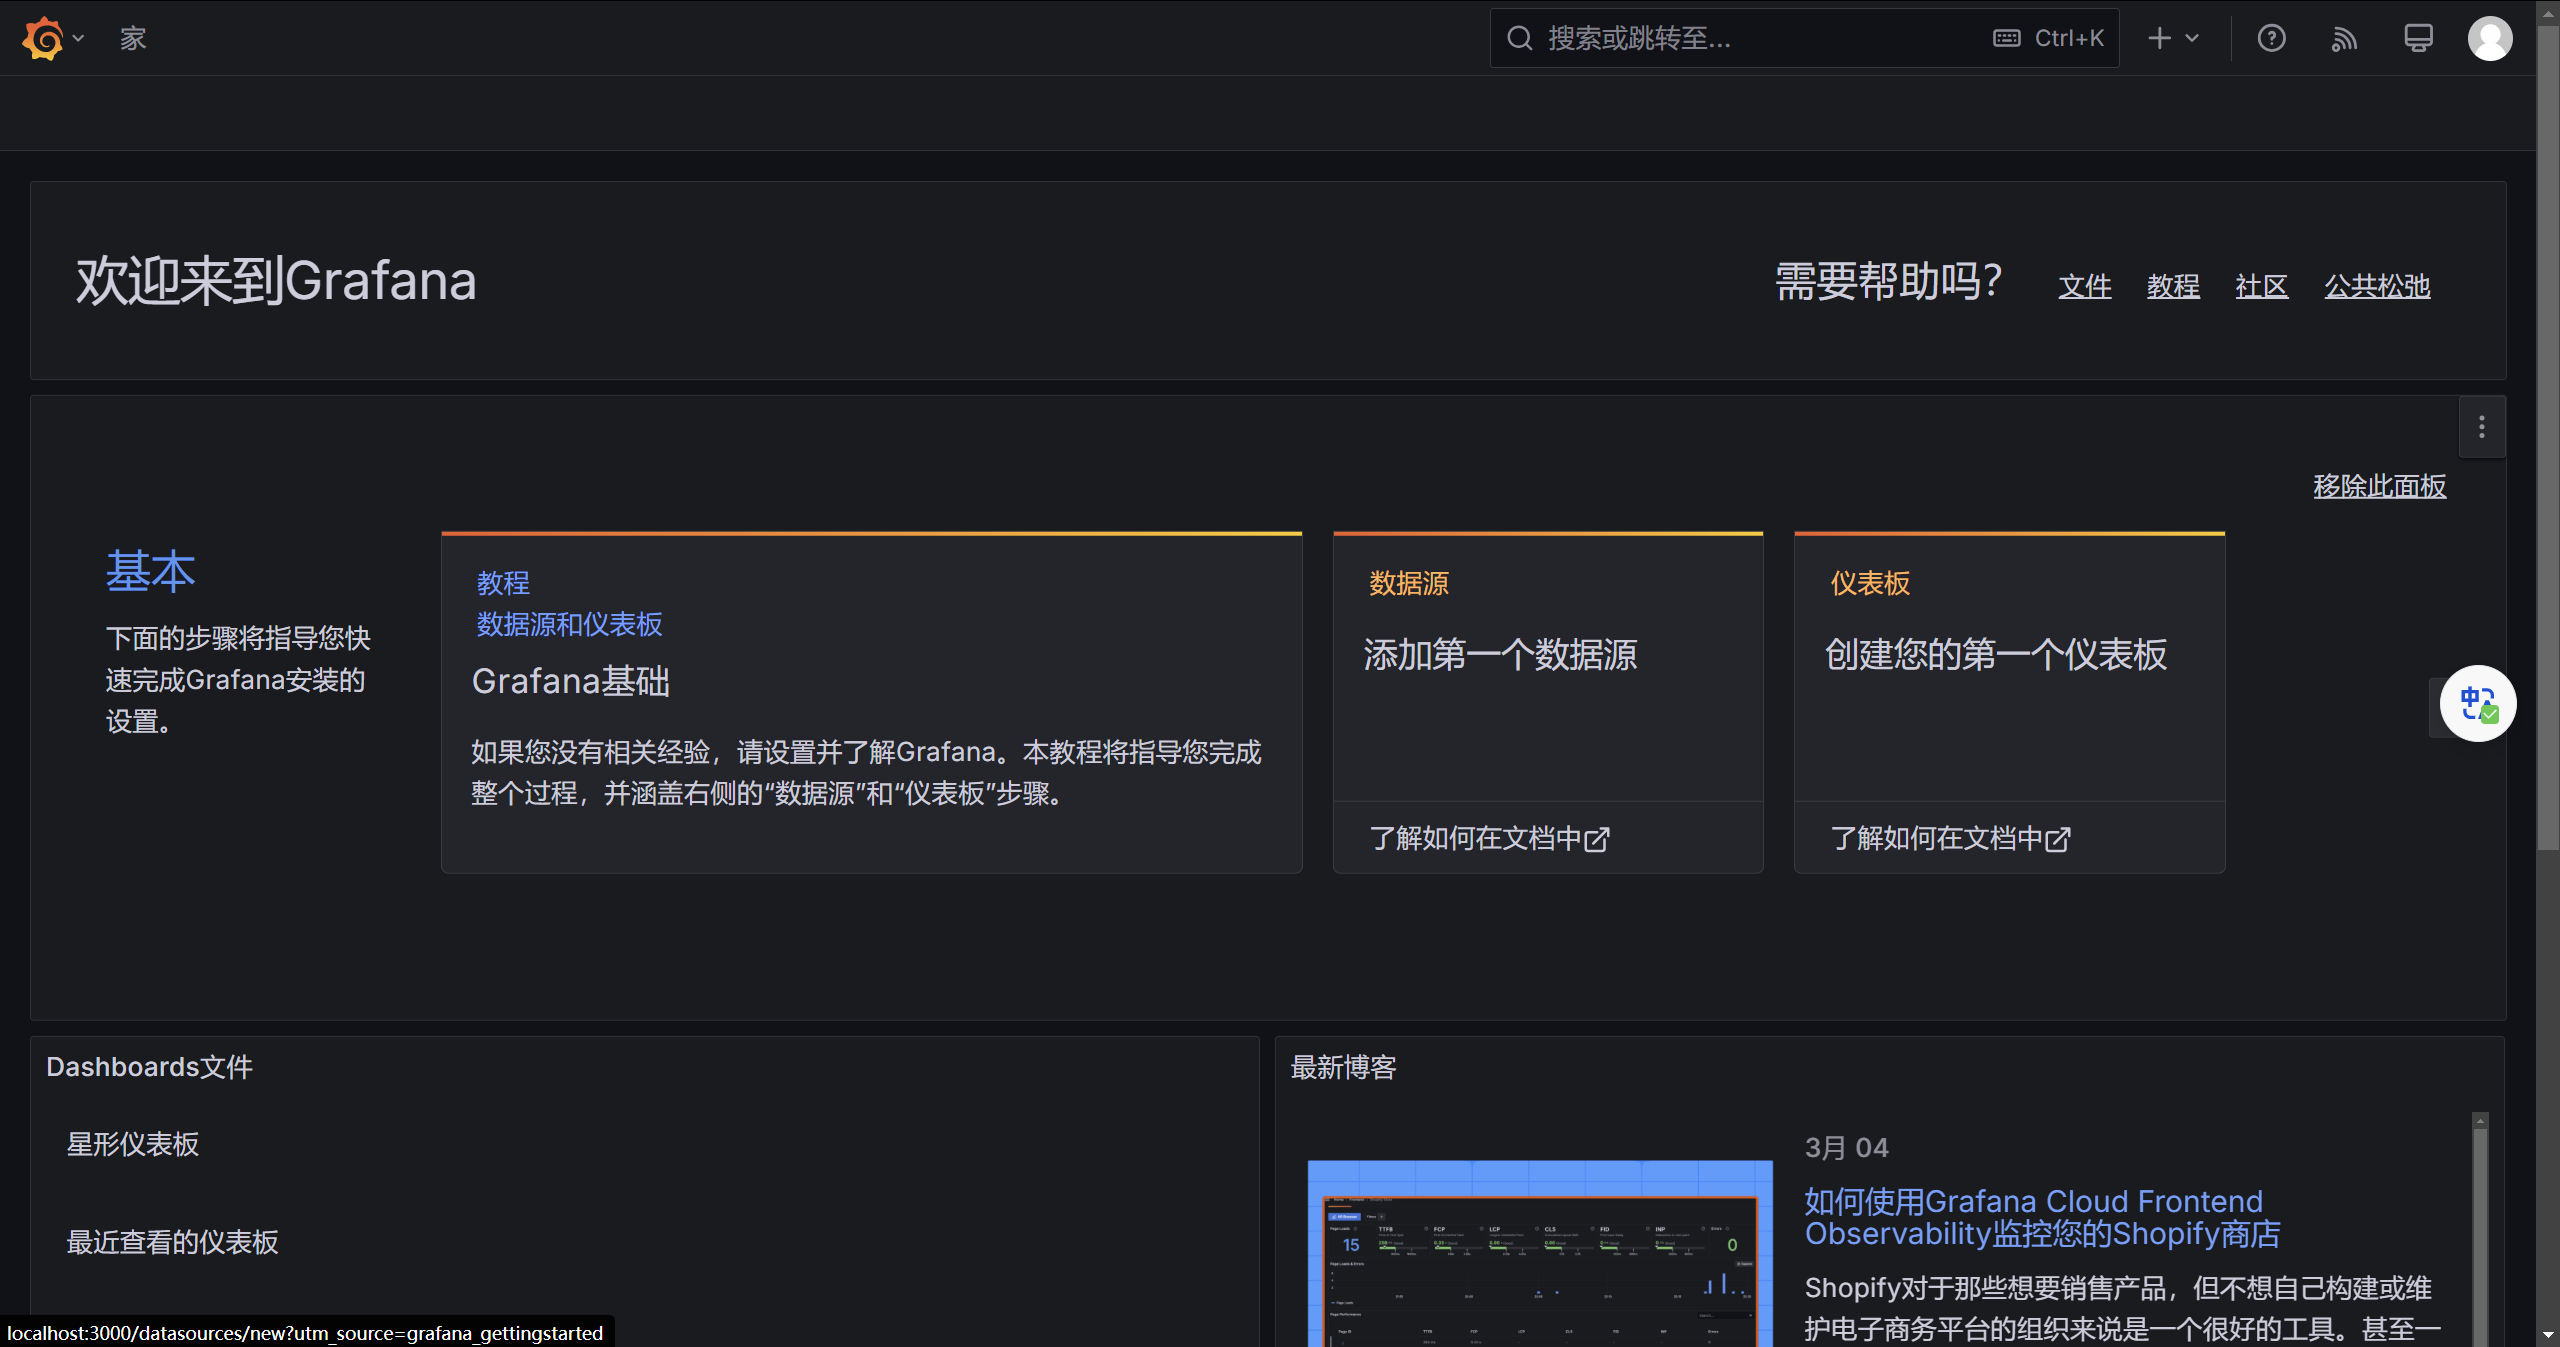
默认情况下,Grafana将侦听http://localhost:3000。默认登录名为“admin”/“admin”。
接下来配置 Prometheus 数据源
在Grafana中创建Prometheus数据源:
点击侧边栏中的“齿轮”打开配置菜单。
点击“数据源”。
点击“添加数据源”。
选择“Prometheus”作为类型。
设置适当的Prometheus服务器URL(例如http://localhost:9090/)
根据需要调整其他数据源设置(例如,选择正确的访问方法)。
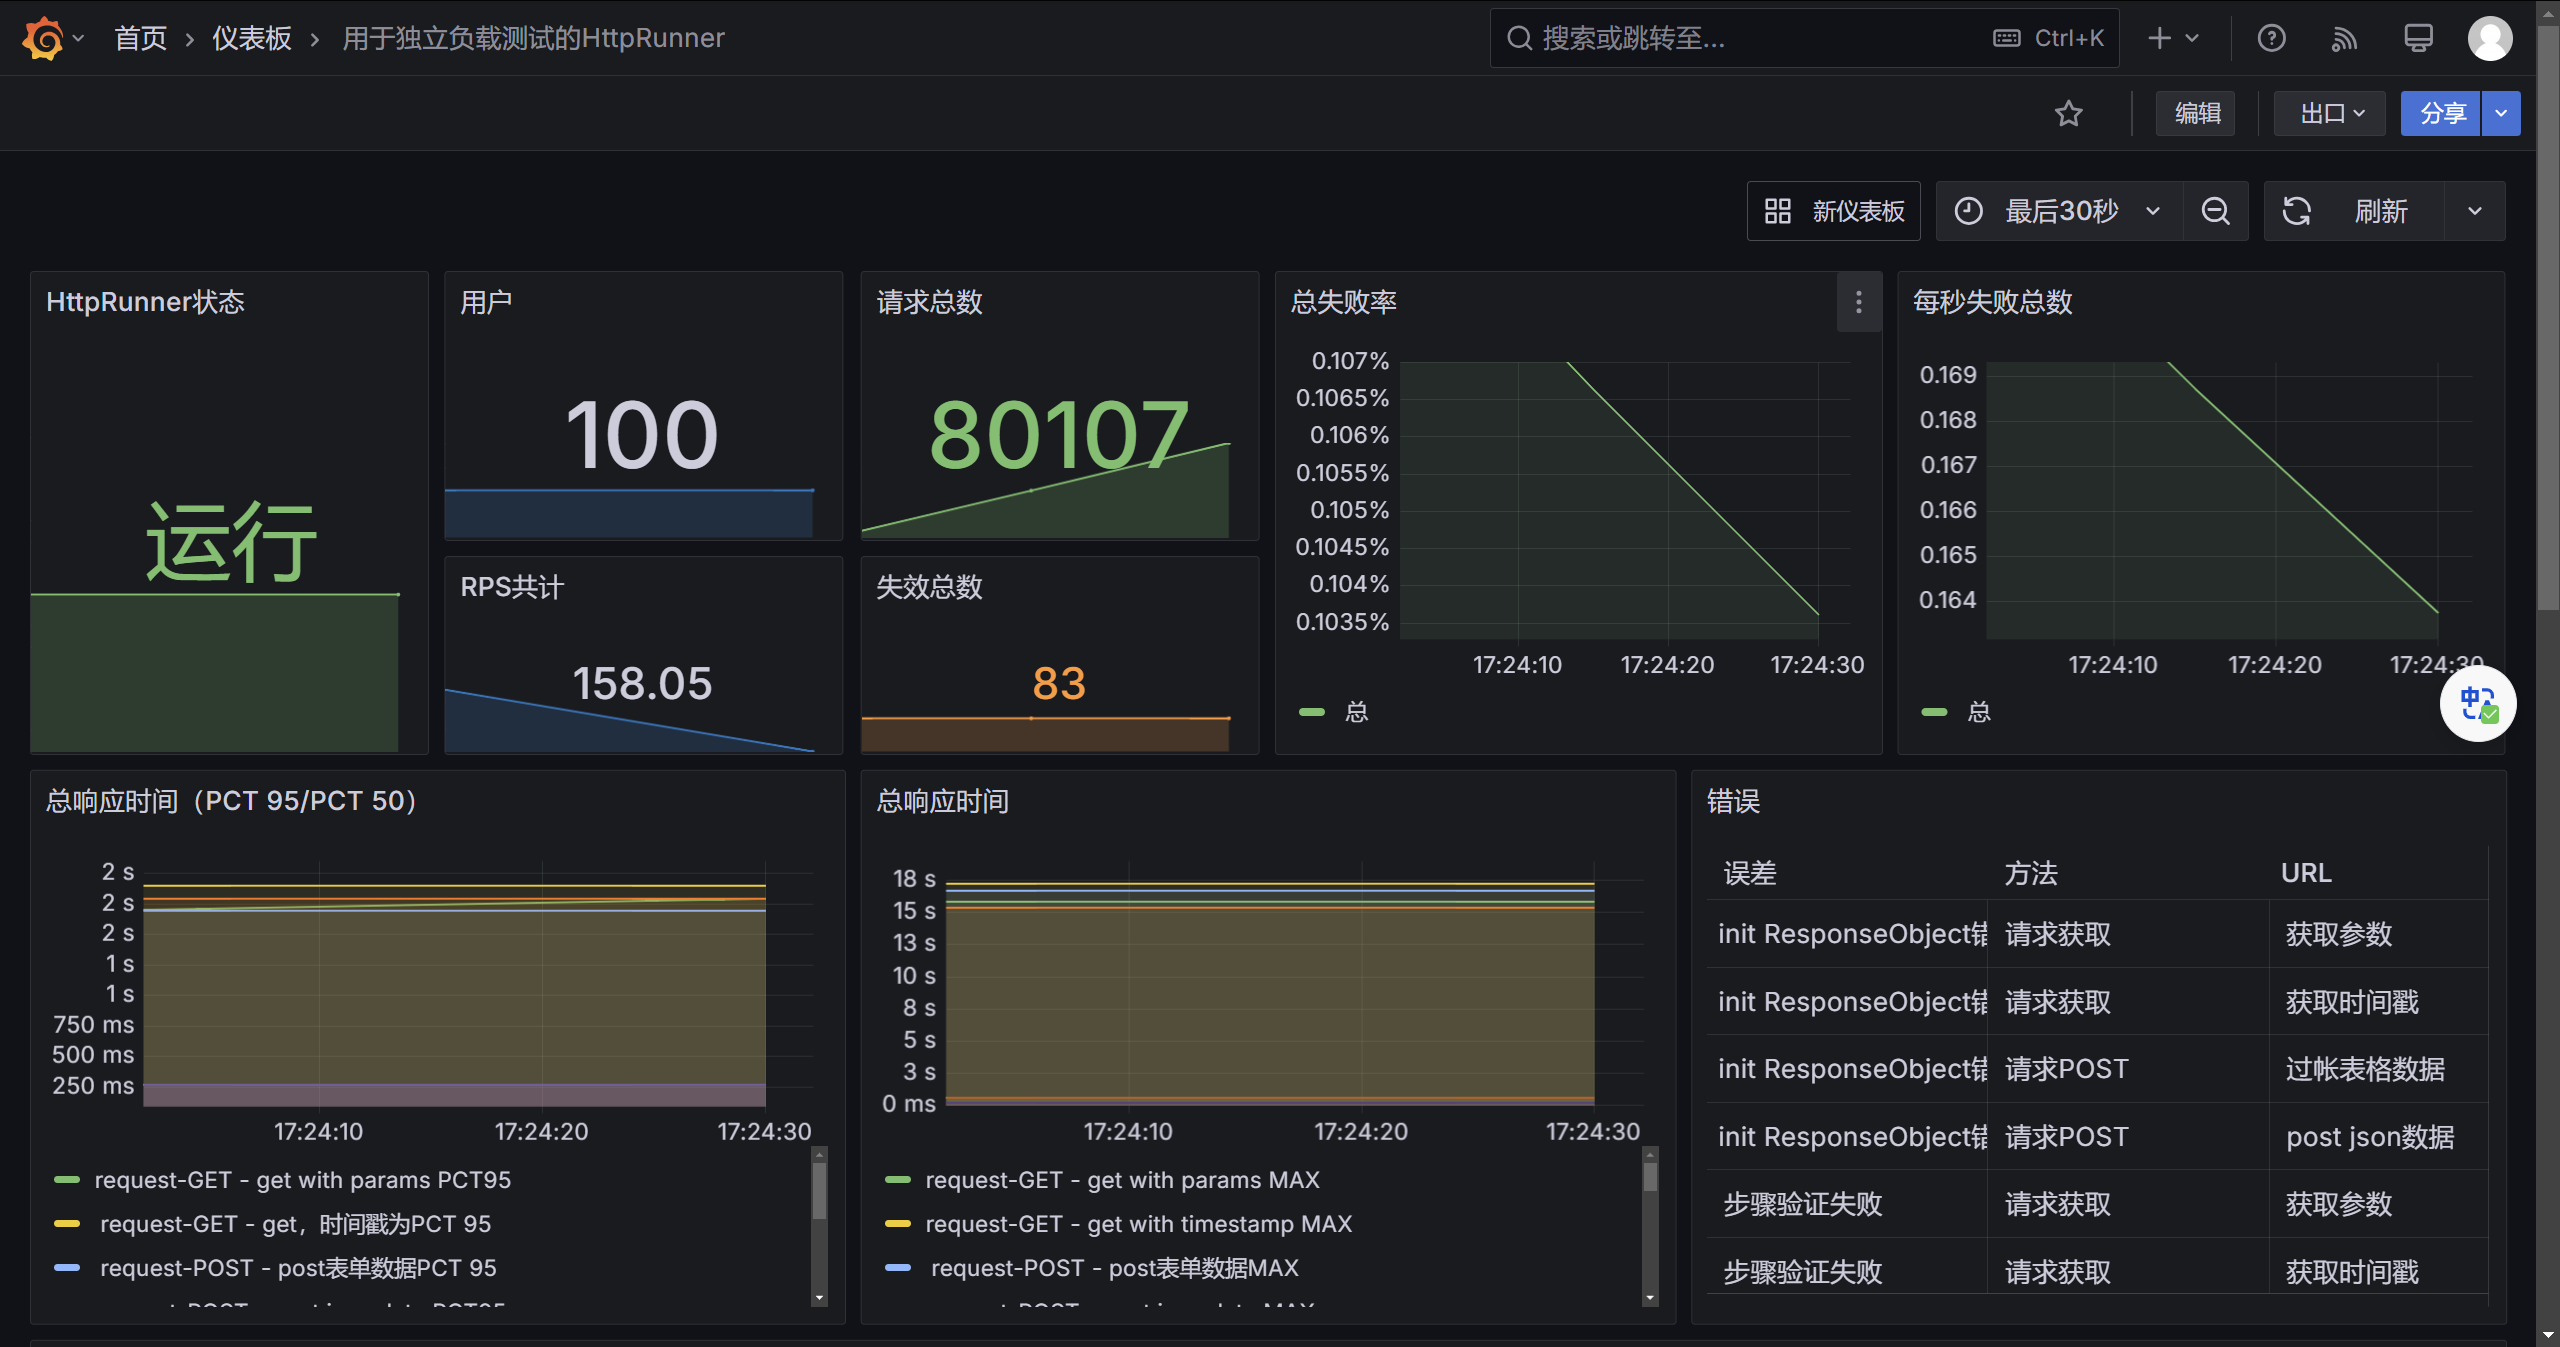
使用官方仪表板
单机模式:https://httprunner.com/examples/grafana-standalone-template.json
分布式模式:https://httprunner.com/examples/grafana-distributed-templete.json

 浙公网安备 33010602011771号