
p-norm/p范数
计算公式
p范数(p-norm):p的取值范围是[1.inf),p在范围(0,1)内并不是范数,因为违反三角不等式(||x+y||≤||x||+||y||)
\[||x||_{p}=(\sum_{i=1}^{n}|x_{i}|^{p})^{\frac{1}{p}}
\]
单位球
范数≤1的所有向量的集合称为范数的单位球
\[B=\{x\in{R^{n}}|||x||\leq{1}\}
\]
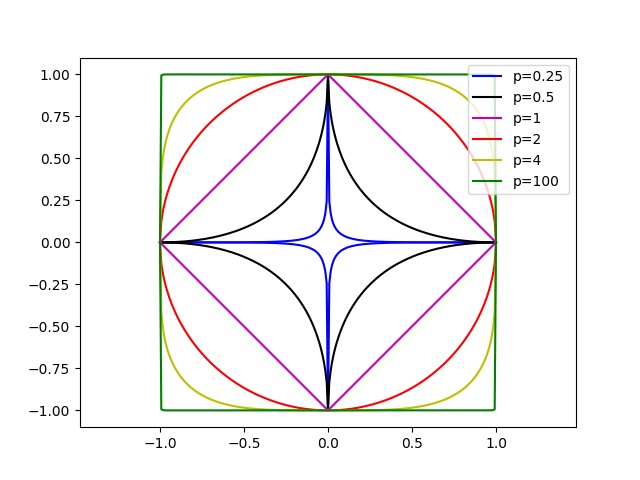
单位球绘图(二维)
import numpy as np
import matplotlib.pyplot as plt

r = 1
linestyle = ['b-','k-','m-','r-','y-','g-']
p_values = (0.25, 0.5, 1, 2, 4, 100)
for i,p in enumerate(p_values):
    x = np.arange(-r,r+1e-5,1/128.0)
    y = (r**p - (abs(x)**p))**(1.0/p)
    plt.plot(x, y, linestyle[i], label=f'p={p}')
    plt.plot(x, -y, linestyle[i])
plt.axis('equal')
plt.legend()
plt.savefig('p-norm.jpg')
plt.show()
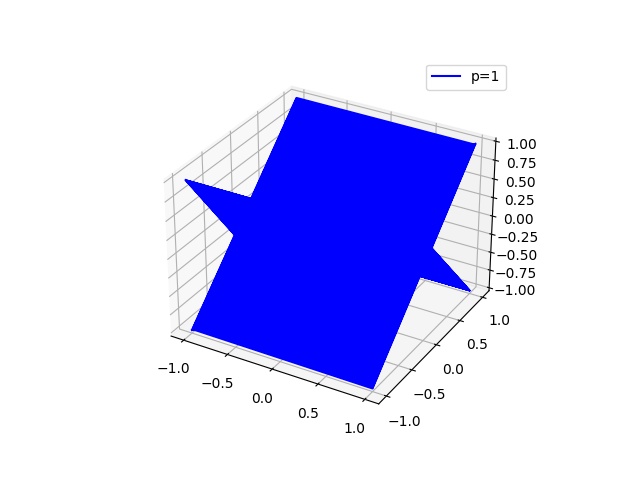
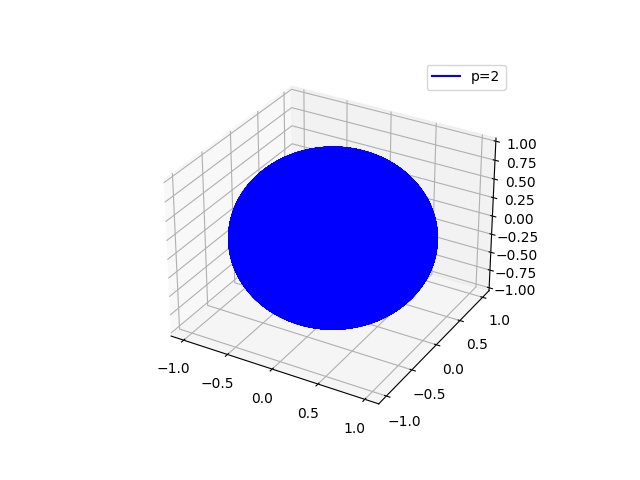
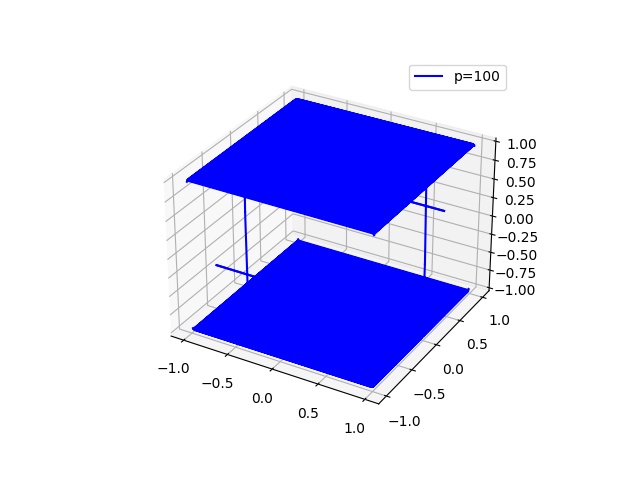
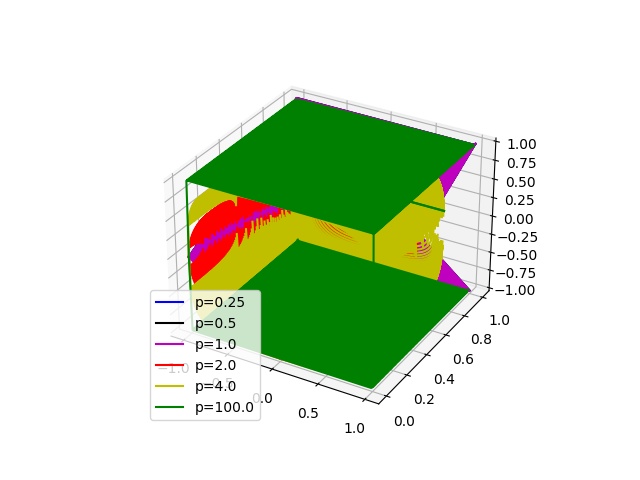
三维
r = 1
linestyle = ['b-', 'k-', 'm-', 'r-', 'y-', 'g-']
p_values = [0.25, 0.5, 1.0, 2.0, 4.0, 100.0]
x = np.arange(-r, r+1e-5, 1/128.0)
lenght1 = len(x)
y = np.arange(0, r+1e-5, 1/128.0)
length2 = len(y)
x = np.tile(x, length2)
y = y.repeat(lenght1)

fig = plt.figure()
ax = fig.gca(projection='3d')
for i, p in enumerate(p_values):
    z = (r**p - (abs(x)**p) - (abs(y)**p))**(1.0/p)
    ax.plot(x, y, z, linestyle[i], label=f'p={p}')
    ax.plot(x, y, -z, linestyle[i])

ax.legend()
plt.savefig('p-norm.jpg')
plt.show()

行动是治愈恐惧的良药,而犹豫拖延将不断滋养恐惧。

 浙公网安备 33010602011771号