3.读取CSV文件并进行可视化处理
import csv
import matplotlib.pyplot as plt
from datetime import datetime
plt.rcParams['font.sans-serif']=['SimHei'] #用来正常显示中文标签
plt.rcParams['axes.unicode_minus']=False #用来正常显示负号
filename = 'sitka_weather_07-2018_simple.csv'
highs = []
dates = []
with open(filename) as f:
reader = csv.reader(f)
header_row = next(reader)
# print(header_row)
for row in reader:
current_time = datetime.strptime(row[2],'%Y-%m-%d')
high = int(row[5])
highs.append(high)
dates.append(current_time)
print(highs)
# for index,column_header in enumerate(header_row):
# print(index,column_header)
fig ,ax =plt.subplots()
ax.plot(dates,highs,c='red')
fig.autofmt_xdate() #用来获取倾斜的标签,防止标签遮挡
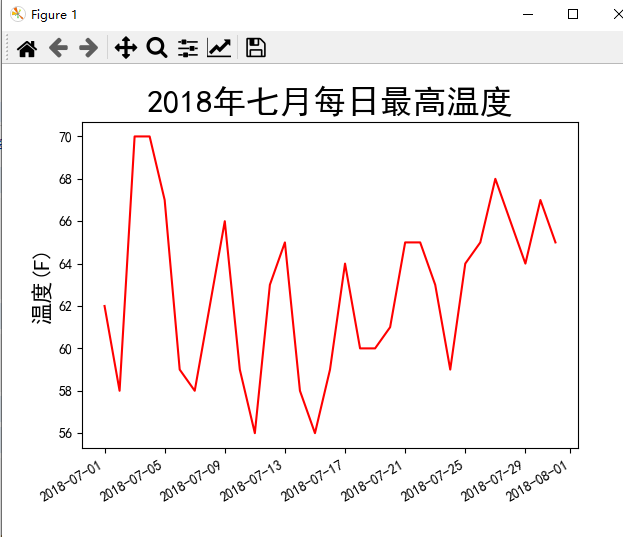
ax.set_title("2018年七月每日最高温度",fontsize=24)
ax.set_xlabel('',fontsize='16')
ax.set_ylabel('温度(F)',fontsize='16')
plt.show()
可视化效果:
import csv
import matplotlib.pyplot as plt
from datetime import datetime
plt.rcParams['font.sans-serif']=['SimHei'] #用来正常显示中文标签
plt.rcParams['axes.unicode_minus']=False #用来正常显示负号
filename = 'Data/sitka_weather_2018_simple.csv'
highs = []
dates = []
lows = []
with open(filename) as f:
reader = csv.reader(f)
header_row = next(reader)
# print(header_row)
for row in reader:
current_time = datetime.strptime(row[2],'%Y-%m-%d')
high = int(row[5])
low = int(row[6])
highs.append(high)
dates.append(current_time)
lows.append(low)
print(highs)
# for index,column_header in enumerate(header_row):
# print(index,column_header)
fig ,ax =plt.subplots()
ax.plot(dates,highs,c='red',alpha=0.5)
ax.plot(dates,lows,c='red',alpha=0.5) #alpha参数设置颜色透明度
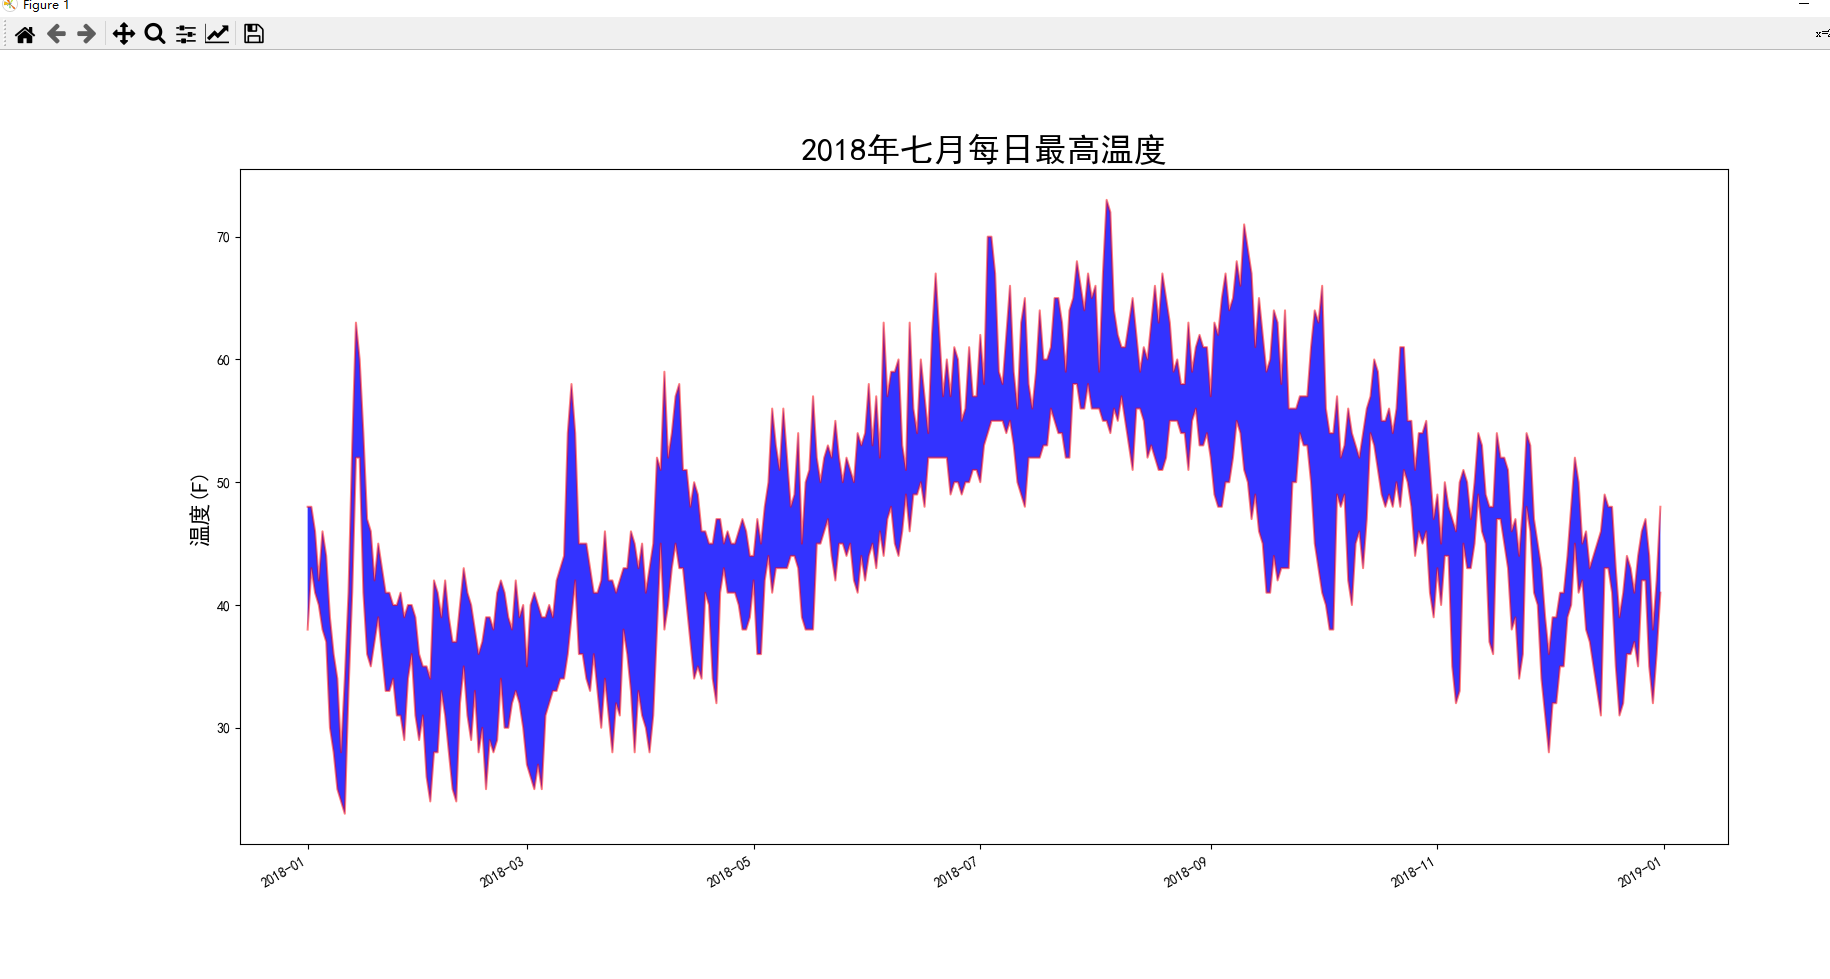
ax.fill_between(dates,highs,lows,facecolor='blue',alpha=0.8) #指定出填充区域
fig.autofmt_xdate() #用来获取倾斜的标签,防止标签遮挡
ax.set_title("2018年七月每日最高温度",fontsize=24)
ax.set_xlabel('',fontsize='16')
ax.set_ylabel('温度(F)',fontsize='16')
plt.show()
可视化:
本文来自博客园,作者:TCcjx,转载请注明原文链接:https://www.cnblogs.com/tccjx/p/16908787.html

 浙公网安备 33010602011771号