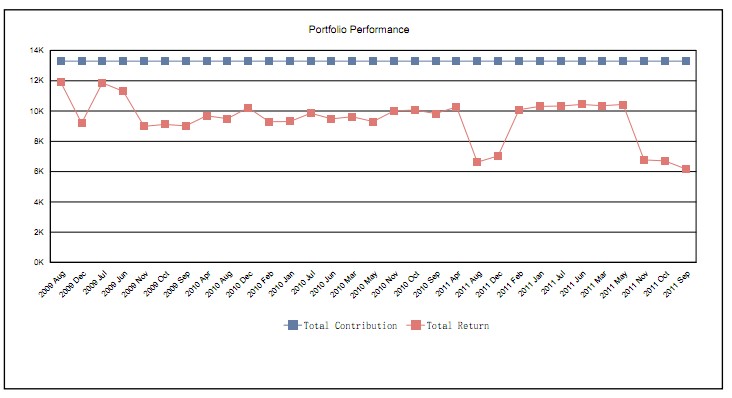
水晶报表 X轴自定义时间格式方案
2012-06-07 17:01 朱峰(Peter.zhu) 阅读(352) 评论(0) 编辑 收藏 举报
This solution can work for you ... IF ... you are able to design your report in the following fashion.
1 - Group on the date field you need.
2 - On the Insert Group screen after you have selected the date field, the third dropdown titled "The section will be printed" ... select "for each month".
3 - Click on the second tab of the Insert Group screen labeled "Options".
4 - Click the checkbox for "Customize Group Name Field".
5 - Select the second radio button labeled "Use a Formula as Group Name".
6 - Click the Conditional Format button to the right.
7 - Enter a formula like:
MonthName (Month ({Orders.Order Date}), True) &
'-' &
ToText (Year ({Orders.Order Date}), 0, '')
8 - Click OK to accept the settings.
9 - Now add your chart. By grouping on the raw field, your chart elements will remain sorted on the numeric elements (the dates), but their labels will be in the format you requested in your posting.

