
Java通过JFreeChart实现(饼图、柱状图、层叠柱状图、折线图、散点图、雷达图、环形图、仪表盘图、XY图)生成图片和下载
目录
2.3 GeneratePieChartUtil 饼图生成工具类
1、添加依赖
<!-- Hutool工具包 -->
<dependency>
	<groupId>cn.hutool</groupId>
	<artifactId>hutool-all</artifactId>
	<version>5.6.2</version>
</dependency>
<!-- JFreeChart图表库 -->
<dependency>
	<groupId>org.jfree</groupId>
	<artifactId>jfreechart</artifactId>
	<version>1.5.3</version>
</dependency>
2、工具类
2.1 JFreeChart工具类
package com.shucha.deveiface.biz.utils;

/**
 * @author tqf
 * @Description JFreeChart工具类
 * @Version 1.0
 * @since 2022-06-07 09:40
 */
import cn.hutool.core.util.StrUtil;
import org.jfree.chart.*;
import org.jfree.chart.axis.ValueAxis;
import org.jfree.chart.labels.*;
import org.jfree.chart.plot.*;
import org.jfree.chart.renderer.category.*;
import org.jfree.chart.renderer.xy.XYLineAndShapeRenderer;
import org.jfree.chart.ui.*;
import org.jfree.data.category.DefaultCategoryDataset;
import org.jfree.data.general.DefaultPieDataset;
import org.springframework.core.io.ClassPathResource;

import java.awt.*;
import java.io.File;
import java.io.IOException;
import java.text.NumberFormat;
import java.util.List;

public class JFreeChartUtil {
    public static String NO_DATA_MSG = "数据加载失败";

    /**
     * 生成主题
     * @param fontName 字体名称(默认为宋体)
     * @return
     */
    public static StandardChartTheme createChartTheme(String fontName) throws Exception {
        StandardChartTheme theme = new StandardChartTheme("unicode") {
            public void apply(JFreeChart chart) {
                chart.getRenderingHints().put(RenderingHints.KEY_TEXT_ANTIALIASING,
                        RenderingHints.VALUE_TEXT_ANTIALIAS_OFF);
                super.apply(chart);
            }
        };
        theme.setExtraLargeFont(getDefaultFont(Font.PLAIN, 20f));
        theme.setLargeFont(getDefaultFont(Font.PLAIN, 14f));
        theme.setRegularFont(getDefaultFont(Font.PLAIN, 12f));
        theme.setSmallFont(getDefaultFont(Font.PLAIN, 10f));
        return theme;
    }

    /**
     * 获取默认字体
     * @param style
     * @param size  字体大小
     * @return
     * @throws Exception
     */
    public static Font getDefaultFont(int style, Float size) throws Exception {
        //如 果不使用Font,中文将显示不出来
        Font font = new Font("新宋体", Font.BOLD, 15);
        return font;
    }

    /**
     * 创建饼图数据集合
     * @param legendNameList 图例名称列表
     * @param dataList       数据列表
     * @return
     */
    public static DefaultPieDataset createDefaultPieDataset(List<String> legendNameList, List<Object> dataList) {
        DefaultPieDataset dataset = new DefaultPieDataset();
        //图例名称列表或数据列表为空
        if (legendNameList == null || legendNameList.size() <= 0 || dataList == null || dataList.size() <= 0) {
            return dataset;
        }
        for (int i = 0; i < legendNameList.size() && legendNameList.size() == dataList.size(); i++) {
            String value = dataList.get(i).toString();
            dataset.setValue(legendNameList.get(i), Double.valueOf(value));
        }
        return dataset;
    }

    /**
     * 设置饼状图渲染
     */
    public static void setPieRender(Plot plot) {
        plot.setNoDataMessage(NO_DATA_MSG);
        plot.setInsets(new RectangleInsets(10, 10, 5, 10));
        PiePlot piePlot = (PiePlot) plot;
        piePlot.setInsets(new RectangleInsets(0, 0, 0, 0));
        piePlot.setCircular(true);// 圆形

        // 简单标签
        piePlot.setLabelGap(0.01);
        piePlot.setInteriorGap(0.05D);
        // 图例形状
        piePlot.setLegendItemShape(new Rectangle(10, 10));
        piePlot.setIgnoreNullValues(true);
        // 去掉标签背景色
        piePlot.setLabelBackgroundPaint(null);
        //去掉图表背景颜色
        piePlot.setBackgroundPaint(null);
        // 去掉阴影
        piePlot.setLabelShadowPaint(null);
        // 去掉边框
        piePlot.setLabelOutlinePaint(null);
        piePlot.setShadowPaint(null);
        // 显示标签数据
        piePlot.setLabelGenerator(new StandardPieSectionLabelGenerator("{0}:{2}"));
    }

    /**
     * 创建类别数据集合(柱形图、折线图)
     * @param legendNameList 图例名称列表
     * @param xAxisNameList  x轴名称列表
     * @param dataList       数据列表
     * @return
     */
    public static DefaultCategoryDataset createDefaultCategoryDataset(List<String> legendNameList, List<String> xAxisNameList
            , List<List<Object>> dataList) {
        DefaultCategoryDataset dataset = new DefaultCategoryDataset();
        //图例名称列表、x轴名称列表或数据列表为空
        if (xAxisNameList == null || xAxisNameList.size() <= 0 || legendNameList == null || legendNameList.size() <= 0
                || dataList == null || dataList.size() <= 0) {
            return dataset;
        }
        for (int yAxisIndex = 0; yAxisIndex < legendNameList.size() && legendNameList.size() == dataList.size(); yAxisIndex++) {
            String legendName = legendNameList.get(yAxisIndex);
            List<Object> rowList = dataList.get(yAxisIndex);
            //该组数据不存在或该组数据总数不等于x轴数据数量
            if (rowList == null || rowList.size() != xAxisNameList.size()) {
                continue;
            }
            for (int xAxisIndex = 0; xAxisIndex < rowList.size(); xAxisIndex++) {
                String value = rowList.get(xAxisIndex).toString();
                dataset.setValue(Double.parseDouble(value), legendName, xAxisNameList.get(xAxisIndex));
            }
        }
        return dataset;
    }

    /**
     * 设置柱状图渲染
     * @param plot
     * @param isShowDataLabels 显示数据值标记
     */
    public static void setBarRenderer(CategoryPlot plot, boolean isShowDataLabels) {
        plot.setNoDataMessage(NO_DATA_MSG);
        plot.setInsets(new RectangleInsets(10, 10, 5, 10));
        BarRenderer renderer = (BarRenderer) plot.getRenderer();
        // 设置柱子最大宽度
        renderer.setMaximumBarWidth(0.175);
        //设置图表背景颜色(透明)
        plot.setBackgroundPaint(null);
        //显示数据值标记
        if (isShowDataLabels) {
            renderer.setDefaultItemLabelsVisible(true);
        }
        renderer.setDefaultItemLabelGenerator(new StandardCategoryItemLabelGenerator());
        //注意:此句很关键,若无此句,那数字的显示会被覆盖,给人数字没有显示出来的问题
        renderer.setDefaultPositiveItemLabelPosition(new ItemLabelPosition(
                ItemLabelAnchor.OUTSIDE12, TextAnchor.BASELINE_CENTER));

        setXAixs(plot);
        setYAixs(plot);
    }

    /**
     * 设置折线图样式
     * @param plot
     * @param isShowDataLabels 是否显示数据标签
     * @param isShapesVisible  是否显示数据点
     */
    public static void setLineRender(CategoryPlot plot, boolean isShowDataLabels, boolean isShapesVisible) {
        plot.setNoDataMessage(NO_DATA_MSG);
        plot.setInsets(new RectangleInsets(10, 10, 0, 10), false);
        LineAndShapeRenderer renderer = (LineAndShapeRenderer) plot.getRenderer();
        //设置图表背景颜色(透明)
        plot.setBackgroundPaint(null);
        renderer.setDefaultStroke(new BasicStroke(1.5F));
        //显示数据标签
        if (isShowDataLabels) {
            renderer.setDefaultItemLabelsVisible(true);
            renderer.setDefaultItemLabelGenerator(new StandardCategoryItemLabelGenerator(StandardCategoryItemLabelGenerator.DEFAULT_LABEL_FORMAT_STRING,
                    NumberFormat.getInstance()));
            // 位置
            renderer.setDefaultPositiveItemLabelPosition(new ItemLabelPosition(ItemLabelAnchor.OUTSIDE1, TextAnchor.BOTTOM_CENTER));
        }
        // 数据点绘制形状
        renderer.setDefaultShapesVisible(isShapesVisible);
        setXAixs(plot);
        setYAixs(plot);

    }

    /**
     * 设置散点图样式
     * @param plot
     */
    public static void setScatterRender(XYPlot plot) {
        plot.setNoDataMessage(NO_DATA_MSG);
        plot.setInsets(new RectangleInsets(10, 10, 0, 10), false);
        //设置图表背景颜色(透明)
        plot.setBackgroundPaint(null);
        setXAixs(plot);
        setYAixs(plot);
    }

    /**
     * 设置类别图表(CategoryPlot) X坐标轴线条颜色和样式
     * @param plot
     */
    public static void setXAixs(CategoryPlot plot) {
        Color lineColor = new Color(31, 121, 170);
        // X坐标轴颜色
        plot.getDomainAxis().setAxisLinePaint(lineColor);
        // X坐标轴标记|竖线颜色
        plot.getDomainAxis().setTickMarkPaint(lineColor);

    }

    /**
     * 设置图表(XYPlot) X坐标轴线条颜色和样式
     * @param plot
     */
    public static void setXAixs(XYPlot plot) {
        Color lineColor = new Color(31, 121, 170);
        // X坐标轴颜色
        plot.getDomainAxis().setAxisLinePaint(lineColor);
        // X坐标轴标记|竖线颜色
        plot.getDomainAxis().setTickMarkPaint(lineColor);
        // x轴网格线条
        plot.setDomainGridlinePaint(new Color(192, 192, 192));
    }

    /**
     * 设置类别图表(CategoryPlot) Y坐标轴线条颜色和样式 同时防止数据无法显示
     * @param plot
     */
    public static void setYAixs(CategoryPlot plot) {
        Color lineColor = new Color(192, 208, 224);
        ValueAxis axis = plot.getRangeAxis();
        // Y坐标轴颜色
        axis.setAxisLinePaint(lineColor);
        // Y坐标轴标记|竖线颜色
        axis.setTickMarkPaint(lineColor);
        // 隐藏Y刻度
        axis.setAxisLineVisible(false);
        axis.setTickMarksVisible(false);
        // Y轴网格线条
        plot.setRangeGridlinePaint(new Color(192, 192, 192));
        plot.setRangeGridlineStroke(new BasicStroke(1));
        // 设置顶部Y坐标轴间距,防止数据无法显示
        plot.getRangeAxis().setUpperMargin(0.1);
        // 设置底部Y坐标轴间距
        plot.getRangeAxis().setLowerMargin(0.1);

    }

    /**
     * 设置图表(XYPlot) Y坐标轴线条颜色和样式 同时防止数据无法显示
     * @param plot
     */
    public static void setYAixs(XYPlot plot) {
        Color lineColor = new Color(192, 208, 224);
        ValueAxis axis = plot.getRangeAxis();
        // Y坐标轴颜色
        axis.setAxisLinePaint(lineColor);
        // Y坐标轴标记|竖线颜色
        axis.setTickMarkPaint(lineColor);
        // 隐藏Y刻度
        axis.setAxisLineVisible(false);
        axis.setTickMarksVisible(false);
        // Y轴网格线条
        plot.setRangeGridlinePaint(new Color(192, 192, 192));
        // 设置顶部Y坐标轴间距,防止数据无法显示
        plot.getRangeAxis().setUpperMargin(0.1);
        // 设置底部Y坐标轴间距
        plot.getRangeAxis().setLowerMargin(0.1);
    }
}
2.2 GenerateChartUtil 图表生成工具类
package com.shucha.deveiface.biz.utils;

/**
 * @author tqf
 * @Description 图表生成工具类
 * @Version 1.0
 * @since 2022-06-07 09:43
 */

import cn.hutool.core.collection.CollectionUtil;
import cn.hutool.core.util.StrUtil;
import org.jfree.chart.ChartFactory;
import org.jfree.chart.ChartUtils;
import org.jfree.chart.JFreeChart;
import org.jfree.chart.StandardChartTheme;
import org.jfree.chart.axis.CategoryAxis;
import org.jfree.chart.axis.CategoryLabelPositions;
import org.jfree.chart.axis.NumberAxis;
import org.jfree.chart.axis.ValueAxis;
import org.jfree.chart.block.BlockBorder;
import org.jfree.chart.labels.ItemLabelAnchor;
import org.jfree.chart.labels.ItemLabelPosition;
import org.jfree.chart.labels.StandardCategoryItemLabelGenerator;
import org.jfree.chart.plot.CategoryPlot;
import org.jfree.chart.plot.PiePlot3D;
import org.jfree.chart.renderer.category.CategoryItemRenderer;
import org.jfree.chart.ui.RectangleEdge;
import org.jfree.chart.ui.TextAnchor;
import org.jfree.chart.util.Rotation;
import org.jfree.data.general.DefaultPieDataset;
import org.jfree.data.xy.XYDataset;

import java.awt.*;
import java.io.ByteArrayOutputStream;
import java.io.IOException;
import java.io.OutputStream;
import java.text.DecimalFormat;
import java.text.NumberFormat;
import java.util.List;

public class GenerateChartUtil {

    /**
     * 生成柱状图(返回JFreeChart)
     *
     * @param chartTitle     图表标题
     * @param legendNameList 图例名称列表
     * @param xAxisNameList  x轴名称列表
     * @param dataList       数据列表
     * @param theme          主题(null代表默认主题)
     * @param yAxisTitle     y轴标题
     * @param xAxisTitle     x轴标题
     * @param yAxisMinValue   y轴最小值(可以为空)
     * @param yAxisMaxValue   y轴最大值(可以为空)
     * @param legendColorList 图例背景颜色(可以为空)
     * @param barLabelVisible 是否显示柱体标签(可以为空)
     * @param barLabelFormat  柱体标签格式(可以为空)
     * @return
     */
    public static JFreeChart createBarChart(String chartTitle, List<String> legendNameList, List<String> xAxisNameList
            , List<List<Object>> dataList, StandardChartTheme theme, String yAxisTitle, String xAxisTitle, Double yAxisMinValue
            , Double yAxisMaxValue, List<Color> legendColorList, Boolean barLabelVisible, String barLabelFormat) throws Exception {
        //设置主题,防止中文乱码
        theme = theme == null ? JFreeChartUtil.createChartTheme("") : theme;
        ChartFactory.setChartTheme(theme);
        //创建柱状图
        JFreeChart chart = ChartFactory.createBarChart(chartTitle, xAxisTitle, yAxisTitle
                , JFreeChartUtil.createDefaultCategoryDataset(legendNameList, xAxisNameList, dataList));
        // 设置抗锯齿,防止字体显示不清楚
        chart.setTextAntiAlias(false);
        // 对柱子进行渲染
        JFreeChartUtil.setBarRenderer(chart.getCategoryPlot(), true);CategoryPlot plot = (CategoryPlot) chart.getPlot();
        CategoryAxis categoryAxis = plot.getDomainAxis();
        // 最大换行数
        categoryAxis.setMaximumCategoryLabelLines(10);
        //y轴
        ValueAxis valueAxis = chart.getCategoryPlot().getRangeAxis();
        if (yAxisMinValue != null) {
            valueAxis.setLowerBound(yAxisMinValue);
        }
        if (yAxisMaxValue != null) {
            valueAxis.setUpperBound(yAxisMaxValue);
        }
        CategoryItemRenderer customBarRenderer = plot.getRenderer();
        //显示每个柱的数值
        if (barLabelVisible != null) {
            customBarRenderer.setDefaultItemLabelsVisible(barLabelVisible);
            //柱体数值格式
            if (StrUtil.isNotEmpty(barLabelFormat)) {
                customBarRenderer.setDefaultItemLabelGenerator(new StandardCategoryItemLabelGenerator(barLabelFormat, NumberFormat.getInstance()));
            }
        }
        //设置系列柱体背景颜色
        if (CollectionUtil.isNotEmpty(legendColorList)) {
            for (int i = 0; i < legendNameList.size() && i < legendColorList.size(); i++) {
                Color color = legendColorList.get(i);
                if (color == null) {
                    continue;
                }
                customBarRenderer.setSeriesPaint(i, color);
            }
        }
        // 设置标注无边框
        chart.getLegend().setFrame(new BlockBorder(Color.WHITE));
        // 标注位于上侧
        chart.getLegend().setPosition(RectangleEdge.TOP);
        return chart;
    }

    /**
     * 生成柱状图(返回outputStream)
     *
     * @param chartTitle     图表标题
     * @param legendNameList 图例名称列表
     * @param xAxisNameList  x轴名称列表
     * @param dataList       数据列表
     * @param theme          主题(null代表默认主题)
     * @param yAxisTitle     y轴标题
     * @param xAxisTitle     x轴标题
     * @param outputStream   输出流
     * @param width          宽度
     * @param height         高度
     * @param yAxisMinValue   y轴最小值(可以为空)
     * @param yAxisMaxValue   y轴最大值(可以为空)
     * @param legendColorList 图例背景颜色(可以为空)
     * @param barLabelVisible 是否显示柱体标签(可以为空)
     * @param barLabelFormat  柱体标签格式(可以为空)
     * @return
     */
    public static void createBarChart(OutputStream outputStream, String chartTitle, List<String> legendNameList, List<String> xAxisNameList
            , List<List<Object>> dataList, StandardChartTheme theme, String yAxisTitle, String xAxisTitle, int width, int height
            , Double yAxisMinValue, Double yAxisMaxValue, List<Color> legendColorList, Boolean barLabelVisible, String barLabelFormat) throws Exception {
        JFreeChart chart = createBarChart(chartTitle, legendNameList, xAxisNameList, dataList, theme, yAxisTitle, xAxisTitle
                , yAxisMinValue, yAxisMaxValue, legendColorList, barLabelVisible, barLabelFormat);
        try {
            ChartUtils.writeChartAsJPEG(outputStream, 1.0f, chart, width, height, null);
        } catch (IOException e) {
            e.printStackTrace();
        }
    }

    /**
     * 生成柱状图(返回byte[])
     *
     * @param chartTitle     图表标题
     * @param legendNameList 图例名称列表
     * @param xAxisNameList  x轴名称列表
     * @param dataList       数据列表
     * @param theme          主题(null代表默认主题)
     * @param yAxisTitle     y轴标题
     * @param xAxisTitle     x轴标题
     * @param width          宽度
     * @param height         高度
     * @param yAxisMinValue   y轴最小值(可以为空)
     * @param yAxisMaxValue   y轴最大值(可以为空)
     * @param legendColorList 图例背景颜色(可以为空)
     * @param barLabelVisible 是否显示柱体标签(可以为空)
     * @param barLabelFormat  柱体标签格式(可以为空)
     * @return
     */
    public static byte[] createBarChart(String chartTitle, List<String> legendNameList, List<String> xAxisNameList
            , List<List<Object>> dataList, StandardChartTheme theme, String yAxisTitle, String xAxisTitle, int width, int height
            , Double yAxisMinValue , Double yAxisMaxValue, List<Color> legendColorList, Boolean barLabelVisible, String barLabelFormat) throws Exception {
        ByteArrayOutputStream bas = new ByteArrayOutputStream();
        createBarChart(bas, chartTitle, legendNameList, xAxisNameList, dataList, theme, yAxisTitle, xAxisTitle, width, height
                , yAxisMinValue, yAxisMaxValue, legendColorList, barLabelVisible, barLabelFormat);
        byte[] byteArray = bas.toByteArray();
        return byteArray;
    }

    /**
     * 生成柱堆叠状图(返回JFreeChart)
     *
     * @param chartTitle     图表标题
     * @param legendNameList 图例名称列表
     * @param xAxisNameList  x轴名称列表
     * @param dataList       数据列表
     * @param theme          主题(null代表默认主题)
     * @param yAxisTitle     y轴标题
     * @param xAxisTitle     x轴标题
     * @return
     */
    public static JFreeChart createStackedBarChart(String chartTitle, List<String> legendNameList, List<String> xAxisNameList
            , List<List<Object>> dataList, StandardChartTheme theme, String yAxisTitle, String xAxisTitle) throws Exception {
        //设置主题,防止中文乱码
        theme = theme == null ? JFreeChartUtil.createChartTheme("") : theme;
        ChartFactory.setChartTheme(theme);
        //创建堆叠柱状图
        JFreeChart chart = ChartFactory.createStackedBarChart(chartTitle, xAxisTitle, yAxisTitle
                , JFreeChartUtil.createDefaultCategoryDataset(legendNameList, xAxisNameList, dataList));
        // 设置抗锯齿,防止字体显示不清楚
        chart.setTextAntiAlias(false);
        // 对柱子进行渲染
        JFreeChartUtil.setBarRenderer(chart.getCategoryPlot(), true);
        // 设置标注无边框
        chart.getLegend().setFrame(new BlockBorder(Color.WHITE));
        // 标注位于上侧
        chart.getLegend().setPosition(RectangleEdge.TOP);
        return chart;
    }

    /**
     * 生成堆叠柱状图(返回outputStream)
     *
     * @param chartTitle     图表标题
     * @param legendNameList 图例名称列表
     * @param xAxisNameList  x轴名称列表
     * @param dataList       数据列表
     * @param theme          主题(null代表默认主题)
     * @param yAxisTitle     y轴标题
     * @param xAxisTitle     x轴标题
     * @param outputStream   输出流
     * @param width          宽度
     * @param height         高度
     * @return
     */
    public static void createStackedBarChart(OutputStream outputStream, String chartTitle, List<String> legendNameList, List<String> xAxisNameList
            , List<List<Object>> dataList, StandardChartTheme theme, String yAxisTitle, String xAxisTitle, int width, int height
    ) throws Exception {
        JFreeChart chart = createStackedBarChart(chartTitle, legendNameList, xAxisNameList, dataList, theme, yAxisTitle, xAxisTitle);
        try {
            ChartUtils.writeChartAsJPEG(outputStream, 1.0f, chart, width, height, null);
        } catch (IOException e) {
            e.printStackTrace();
        }
    }

    /**
     * 生成堆叠柱状图(返回byte[])
     *
     * @param chartTitle     图表标题
     * @param legendNameList 图例名称列表
     * @param xAxisNameList  x轴名称列表
     * @param dataList       数据列表
     * @param theme          主题(null代表默认主题)
     * @param yAxisTitle     y轴标题
     * @param xAxisTitle     x轴标题
     * @param width          宽度
     * @param height         高度
     * @return
     */
    public static byte[] createStackedBarChart(String chartTitle, List<String> legendNameList, List<String> xAxisNameList
            , List<List<Object>> dataList, StandardChartTheme theme, String yAxisTitle, String xAxisTitle, int width, int height) throws Exception {
        ByteArrayOutputStream bas = new ByteArrayOutputStream();
        createStackedBarChart(bas, chartTitle, legendNameList, xAxisNameList, dataList, theme, yAxisTitle, xAxisTitle, width, height);
        byte[] byteArray = bas.toByteArray();
        return byteArray;
    }

    /**
     * 生成折线图(返回JFreeChart)
     *
     * @param chartTitle     图表标题
     * @param legendNameList 图例名称列表
     * @param xAxisNameList  x轴名称列表
     * @param dataList       数据列表
     * @param theme          主题(null代表默认主题)
     * @param yAxisTitle     y轴标题
     * @param xAxisTitle     x轴标题
     * @return
     */
    public static JFreeChart createLineChart(String chartTitle, List<String> legendNameList, List<String> xAxisNameList
            , List<List<Object>> dataList, StandardChartTheme theme, String yAxisTitle, String xAxisTitle) throws Exception {
        //设置主题,防止中文乱码
        theme = theme == null ? JFreeChartUtil.createChartTheme("") : theme;
        ChartFactory.setChartTheme(theme);
        //创建折线图
        JFreeChart chart = ChartFactory.createLineChart(chartTitle, xAxisTitle, yAxisTitle
                , JFreeChartUtil.createDefaultCategoryDataset(legendNameList, xAxisNameList, dataList));
        // 设置抗锯齿,防止字体显示不清楚
        chart.setTextAntiAlias(false);
        // 对折现进行渲染
        JFreeChartUtil.setLineRender(chart.getCategoryPlot(), true, true);
        // 设置标注无边框
        chart.getLegend().setFrame(new BlockBorder(Color.WHITE));
        // 标注位于上侧
        chart.getLegend().setPosition(RectangleEdge.TOP);
        return chart;
    }

    /**
     * 生成折线图(返回outputStream)
     *
     * @param chartTitle     图表标题
     * @param legendNameList 图例名称列表
     * @param xAxisNameList  x轴名称列表
     * @param dataList       数据列表
     * @param theme          主题(null代表默认主题)
     * @param yAxisTitle     y轴标题
     * @param xAxisTitle     x轴标题
     * @param outputStream   输出流
     * @param width          宽度
     * @param height         高度
     * @return
     */
    public static void createLineChart(OutputStream outputStream, String chartTitle, List<String> legendNameList, List<String> xAxisNameList
            , List<List<Object>> dataList, StandardChartTheme theme, String yAxisTitle, String xAxisTitle, int width, int height
    ) throws Exception {
        JFreeChart chart = createLineChart(chartTitle, legendNameList, xAxisNameList, dataList, theme, yAxisTitle, xAxisTitle);
        try {
            ChartUtils.writeChartAsJPEG(outputStream, 1.0f, chart, width, height, null);
        } catch (IOException e) {
            e.printStackTrace();
        }
    }

    /**
     * 生成折线图(返回byte[])
     *
     * @param chartTitle     图表标题
     * @param legendNameList 图例名称列表
     * @param xAxisNameList  x轴名称列表
     * @param dataList       数据列表
     * @param theme          主题(null代表默认主题)
     * @param yAxisTitle     y轴标题
     * @param xAxisTitle     x轴标题
     * @param width          宽度
     * @param height         高度
     * @return
     */
    public static byte[] createLineChart(String chartTitle, List<String> legendNameList, List<String> xAxisNameList
            , List<List<Object>> dataList, StandardChartTheme theme, String yAxisTitle, String xAxisTitle, int width, int height) throws Exception {
        ByteArrayOutputStream bas = new ByteArrayOutputStream();
        createLineChart(bas, chartTitle, legendNameList, xAxisNameList, dataList, theme, yAxisTitle, xAxisTitle, width, height);
        byte[] byteArray = bas.toByteArray();
        return byteArray;
    }

    /**
     * 生成散点图(返回JFreeChart)
     *
     * @param chartTitle 图表标题
     * @param dataset    数据集
     * @param theme      主题(null代表默认主题)
     * @param yAxisTitle y轴标题
     * @param xAxisTitle x轴标题
     * @return
     */
    public static JFreeChart createScatterPlot(String chartTitle
            , XYDataset dataset, StandardChartTheme theme, String yAxisTitle, String xAxisTitle) throws Exception {
        //设置主题,防止中文乱码
        theme = theme == null ? JFreeChartUtil.createChartTheme("") : theme;
        ChartFactory.setChartTheme(theme);
        //创建散点图
        JFreeChart chart = ChartFactory.createScatterPlot(chartTitle, xAxisTitle, yAxisTitle
                , dataset);
        // 设置抗锯齿,防止字体显示不清楚
        chart.setTextAntiAlias(false);
        //散点图渲染
        JFreeChartUtil.setScatterRender(chart.getXYPlot());
        // 设置标注无边框
        chart.getLegend().setFrame(new BlockBorder(Color.WHITE));
        // 标注位于上侧
        chart.getLegend().setPosition(RectangleEdge.TOP);
        return chart;
    }

    /**
     * 生成散点图(返回outputStream)
     *
     * @param chartTitle   图表标题
     * @param dataset      数据集
     * @param theme        主题(null代表默认主题)
     * @param yAxisTitle   y轴标题
     * @param xAxisTitle   x轴标题
     * @param outputStream 输出流
     * @param width        宽度
     * @param height       高度
     * @return
     */
    public static void createScatterPlot(OutputStream outputStream, String chartTitle, XYDataset dataset, StandardChartTheme theme
            , String yAxisTitle, String xAxisTitle, int width, int height
    ) throws Exception {
        JFreeChart chart = createScatterPlot(chartTitle, dataset, theme, yAxisTitle, xAxisTitle);
        try {
            ChartUtils.writeChartAsJPEG(outputStream, 1.0f, chart, width, height, null);
        } catch (IOException e) {
            e.printStackTrace();
        }
    }

    /**
     * 生成散点图(返回byte[])
     *
     * @param chartTitle 图表标题
     * @param dataset    数据集
     * @param theme      主题(null代表默认主题)
     * @param yAxisTitle y轴标题
     * @param xAxisTitle x轴标题
     * @param width      宽度
     * @param height     高度
     * @return
     */
    public static byte[] createScatterPlot(String chartTitle, XYDataset dataset, StandardChartTheme theme, String yAxisTitle
            , String xAxisTitle, int width, int height) throws Exception {
        ByteArrayOutputStream bas = new ByteArrayOutputStream();
        createScatterPlot(bas, chartTitle, dataset, theme, yAxisTitle, xAxisTitle, width, height);
        byte[] byteArray = bas.toByteArray();
        return byteArray;
    }
}
2.3 GeneratePieChartUtil 饼图生成工具类
package com.shucha.deveiface.biz.utils;

/**
 * @author tqf
 * @Description 饼图生成工具类
 * @Version 1.0
 * @since 2022-06-07 09:50
 */
import cn.hutool.core.collection.CollectionUtil;
import org.jfree.chart.ChartFactory;
import org.jfree.chart.ChartUtils;
import org.jfree.chart.JFreeChart;
import org.jfree.chart.StandardChartTheme;
import org.jfree.chart.block.BlockBorder;
import org.jfree.chart.plot.PieLabelLinkStyle;
import org.jfree.chart.plot.PiePlot;
import org.jfree.chart.plot.PiePlot3D;
import org.jfree.chart.ui.RectangleEdge;
import org.jfree.chart.util.Rotation;

import java.awt.*;
import java.io.ByteArrayOutputStream;
import java.io.IOException;
import java.io.OutputStream;
import java.util.List;

public class GeneratePieChartUtil {
    /**
     * 生成饼图(返回JFreeChart)
     *
     * @param chartTitle         图表标题
     * @param legendNameList     图例名称列表
     * @param dataList           数据列表
     * @param theme              主题(null代表默认主题)
     * @param legendColorList    图例背景颜色列表(为空,使用默认背景颜色)
     * @param explodePercentList 偏离百分比数据
     * @return
     */
    public static JFreeChart createPieChart(String chartTitle, List<String> legendNameList, List<Object> dataList, StandardChartTheme theme
            , List<Color> legendColorList, List<Double> explodePercentList) throws Exception {
        //设置主题,防止中文乱码
        theme = theme == null ? JFreeChartUtil.createChartTheme("") : theme;
        ChartFactory.setChartTheme(theme);
        //创建饼图
        JFreeChart chart = ChartFactory.createPieChart(chartTitle, JFreeChartUtil.createDefaultPieDataset(legendNameList, dataList));
        // 设置抗锯齿,防止字体显示不清楚
        chart.setTextAntiAlias(false);
        PiePlot piePlot = (PiePlot) chart.getPlot();
        //边框线为白色
        piePlot.setOutlinePaint(Color.white);
        //连接线类型为直线
        piePlot.setLabelLinkStyle(PieLabelLinkStyle.QUAD_CURVE);
        // 对饼图进行渲染
        JFreeChartUtil.setPieRender(chart.getPlot());
        // 设置标注无边框
        chart.getLegend().setFrame(new BlockBorder(Color.WHITE));
        // 标注位于右侧
        chart.getLegend().setPosition(RectangleEdge.RIGHT);

        //设置图例背景颜色(饼图)
        if (CollectionUtil.isNotEmpty(legendColorList)) {
            for (int i = 0; i < legendNameList.size() && i < legendColorList.size(); i++) {
                Color color = legendColorList.get(i);
                if (color == null) {
                    continue;
                }
                piePlot.setSectionPaint(legendNameList.get(i), color);
            }
        }
        //设置偏离百分比
        if (CollectionUtil.isNotEmpty(explodePercentList)) {
            for (int i = 0; i < legendNameList.size() && i < explodePercentList.size(); i++) {
                piePlot.setExplodePercent(legendNameList.get(i), explodePercentList.get(i));
            }
        }
        return chart;
    }

    /**
     * 生成饼图(返回byte[])
     *
     * @param chartTitle         图表标题
     * @param legendNameList     图例名称列表
     * @param dataList           数据列表
     * @param width              宽度
     * @param height             高度
     * @param theme              主题(null代表默认主题)
     * @param legendColorList    图例背景颜色列表(为空,使用默认背景颜色)
     * @param explodePercentList 偏离百分比数据
     * @return
     */
    public static byte[] createPieChart(String chartTitle, List<String> legendNameList, List<Object> dataList, int width, int height
            , StandardChartTheme theme, List<Color> legendColorList, List<Double> explodePercentList) throws Exception {
        ByteArrayOutputStream bas = new ByteArrayOutputStream();
        createPieChart(bas, chartTitle, legendNameList, dataList, width, height, theme, legendColorList, explodePercentList);
        byte[] byteArray = bas.toByteArray();
        return byteArray;
    }

    /**
     * 生成饼图(返回outputStream)
     *
     * @param outputStream       输出流
     * @param chartTitle         图表标题
     * @param legendNameList     图例名称列表
     * @param dataList           数据列表
     * @param width              宽度
     * @param height             高度
     * @param theme              主题(null代表默认主题)
     * @param legendColorList    图例背景颜色列表(为空,使用默认背景颜色)
     * @param explodePercentList 偏离百分比数据
     * @return
     */
    public static void createPieChart(OutputStream outputStream, String chartTitle, List<String> legendNameList, List<Object> dataList
            , int width, int height, StandardChartTheme theme, List<Color> legendColorList, List<Double> explodePercentList) throws Exception {
        JFreeChart chart = createPieChart(chartTitle, legendNameList, dataList, theme, legendColorList, explodePercentList);
        try {
            ChartUtils.writeChartAsJPEG(outputStream, 1.0f, chart, width, height, null);
        } catch (IOException e) {
            e.printStackTrace();
        }
    }

    /**
     * 生成3D饼图(返回JFreeChart)
     *
     * @param chartTitle      图表标题
     * @param legendNameList  图例名称列表
     * @param dataList        数据列表
     * @param theme           主题(null代表默认主题)
     * @param alpha           0.5F为半透明,1为不透明,0为全透明
     * @param legendColorList 图例背景颜色列表(为空,使用默认背景颜色)
     * @return
     */
    public static JFreeChart create3DPieChart(String chartTitle, List<String> legendNameList, List<Object> dataList, StandardChartTheme theme
            , float alpha, List<Color> legendColorList) throws Exception {
        //设置主题,防止中文乱码
        theme = theme == null ? JFreeChartUtil.createChartTheme("") : theme;
        ChartFactory.setChartTheme(theme);
        //创建饼图
        JFreeChart chart = ChartFactory.createPieChart3D(chartTitle, JFreeChartUtil.createDefaultPieDataset(legendNameList, dataList)
                , true, true, true);
        // 设置抗锯齿,防止字体显示不清楚
        chart.setTextAntiAlias(false);
        // 设置标注无边框
        chart.getLegend().setFrame(new BlockBorder(Color.WHITE));
        // 标注位于右侧
        chart.getLegend().setPosition(RectangleEdge.RIGHT);
        PiePlot3D pieplot3d = (PiePlot3D) chart.getPlot();
        //设置方向为”顺时针方向“
        pieplot3d.setDirection(Rotation.CLOCKWISE);
        //设置透明度,0.5F为半透明,1为不透明,0为全透明
        pieplot3d.setForegroundAlpha(alpha);
        //边框线为白色
        pieplot3d.setOutlinePaint(Color.white);
        //连接线类型为直线
        pieplot3d.setLabelLinkStyle(PieLabelLinkStyle.QUAD_CURVE);
        //设置图例背景颜色(饼图)
        if (CollectionUtil.isNotEmpty(legendColorList)) {
            for (int i = 0; i < legendNameList.size() && i < legendColorList.size(); i++) {
                pieplot3d.setSectionPaint(legendNameList.get(i), legendColorList.get(i));
            }
        }
        // 对饼图进行渲染
        JFreeChartUtil.setPieRender(chart.getPlot());
        return chart;
    }

    /**
     * 生成3D饼图(返回byte[])
     *
     * @param chartTitle      图表标题
     * @param legendNameList  图例名称列表
     * @param dataList        数据列表
     * @param width           宽度
     * @param height          高度
     * @param theme           主题(null代表默认主题)
     * @param alpha           0.5F为半透明,1为不透明,0为全透明
     * @param legendColorList 图例背景颜色列表(为空,使用默认背景颜色)
     * @return
     */
    public static byte[] create3DPieChart(String chartTitle, List<String> legendNameList, List<Object> dataList, int width, int height
            , StandardChartTheme theme, float alpha, List<Color> legendColorList) throws Exception {
        ByteArrayOutputStream bas = new ByteArrayOutputStream();
        create3DPieChart(bas, chartTitle, legendNameList, dataList, width, height, theme, alpha, legendColorList);
        byte[] byteArray = bas.toByteArray();
        return byteArray;
    }

    /**
     * 生成3D饼图(返回outputStream)
     *
     * @param outputStream    输出流
     * @param chartTitle      图表标题
     * @param legendNameList  图例名称列表
     * @param dataList        数据列表
     * @param width           宽度
     * @param height          高度
     * @param theme           主题(null代表默认主题)
     * @param alpha           0.5F为半透明,1为不透明,0为全透明
     * @param legendColorList 图例背景颜色列表(为空,使用默认背景颜色)
     * @return
     */
    public static void create3DPieChart(OutputStream outputStream, String chartTitle, List<String> legendNameList, List<Object> dataList
            , int width, int height, StandardChartTheme theme, float alpha, List<Color> legendColorList) throws Exception {
        JFreeChart chart = create3DPieChart(chartTitle, legendNameList, dataList, theme, alpha, legendColorList);
        try {
            ChartUtils.writeChartAsJPEG(outputStream, 1.0f, chart, width, height, null);
        } catch (IOException e) {
            e.printStackTrace();
        }
    }
}
3、生成图片到本地测试代码类
package com.shucha.deveiface.biz.test;
import com.shucha.deveiface.biz.utils.GenerateChartUtil;
import com.shucha.deveiface.biz.utils.GeneratePieChartUtil;
import com.shucha.deveiface.biz.utils.JFreeChartUtil;
import org.apache.poi.hssf.usermodel.HSSFClientAnchor;
import org.apache.poi.hssf.usermodel.HSSFPatriarch;
import org.apache.poi.hssf.usermodel.HSSFSheet;
import org.apache.poi.hssf.usermodel.HSSFWorkbook;
import org.jfree.chart.*;
import org.jfree.chart.block.BlockBorder;
import org.jfree.chart.labels.StandardPieSectionLabelGenerator;
import org.jfree.chart.plot.*;
import org.jfree.chart.plot.dial.*;
import org.jfree.chart.title.LegendTitle;
import org.jfree.chart.title.TextTitle;
import org.jfree.chart.ui.GradientPaintTransformType;
import org.jfree.chart.ui.RectangleEdge;
import org.jfree.chart.ui.StandardGradientPaintTransformer;
import org.jfree.data.Range;
import org.jfree.data.category.DefaultCategoryDataset;
import org.jfree.data.general.DefaultPieDataset;
import org.jfree.data.general.DefaultValueDataset;
import org.jfree.data.general.PieDataset;
import org.jfree.data.xy.XYSeries;
import org.jfree.data.xy.XYSeriesCollection;
import java.awt.*;
import java.io.ByteArrayOutputStream;
import java.io.File;
import java.io.FileOutputStream;
import java.io.IOException;
import java.text.NumberFormat;
import java.util.ArrayList;
import java.util.Arrays;
import java.util.List;
import java.util.Random;
/**
* @author tqf
* @Description
* @Version 1.0
* @since 2022-06-07 09:46
*/
public class JFreeChartTest {
/**
* 生成的图片存放地址
*/
public static String imagePath = "D://123//jfree//1";
public static void main(String[] args) throws Exception {
// 生成饼图
testPie();
// 生成3D饼图
testPie3D();
// 生成柱状图
testBarChart();
// 层叠柱状图
stackedBarChart();
// 生成折线图
lineChart();
// 生成散点图
scatterPlot();
// 生成雷达图
radar();
// 生成环形图
ringChart();
// 生成仪表盘
meter();
meter2();
// 生成XY图
xyImage();
}
/**
* 生成饼图
*/
public static void testPie() throws Exception {
//图例名称列表
List<String> legendNameList = new ArrayList<>(Arrays.asList("一级", "二级", "三级", "四级", "五级"));
//数据列表
List<Object> dataList = new ArrayList<>(Arrays.asList(1, 3, 5, 6, 2));
//图例背景颜色列表
List<Color> legendColorList = new ArrayList<>(Arrays.asList(Color.YELLOW, Color.GRAY, Color.green, Color.cyan, Color.ORANGE));
//偏离百分比数据
List<Double> explodePercentList = new ArrayList<>(Arrays.asList(0.1, 0.1, 0.1, 0.1, 0.1));
JFreeChart chart = GeneratePieChartUtil.createPieChart("各级占比情况", legendNameList, dataList
,JFreeChartUtil.createChartTheme("宋体"), legendColorList, explodePercentList);
//在D盘目录下生成图片
File p = new File(imagePath);
if (!p.exists()) {
p.mkdirs();
}
String imageName = System.currentTimeMillis() + "_饼图" + ".jpeg";
File file = new File(p.getPath() + "/" + imageName);
try {
if(file.exists()) {
file.delete();
}
ChartUtils.saveChartAsJPEG(file, chart, 800, 600);
} catch (IOException e) {
e.printStackTrace();
}
}
/**
* 生成3D饼图
* @throws Exception
*/
public static void testPie3D() throws Exception {
//图例名称列表
List<String> legendNameList = new ArrayList<>(Arrays.asList("一级", "二级", "三级", "四级", "五级"));
//数据列表
List<Object> dataList = new ArrayList<>(Arrays.asList(1, 3, 5, 6, 2));
//图例背景颜色列表
List<Color> legendColorList = new ArrayList<>(Arrays.asList(Color.YELLOW, Color.GRAY, Color.green, Color.cyan, Color.ORANGE));
JFreeChart chart = GeneratePieChartUtil.create3DPieChart("各级占比情况", legendNameList, dataList
, JFreeChartUtil.createChartTheme("宋体"), 1f, legendColorList);
//在D盘目录下生成图片
File p = new File(imagePath);
if (!p.exists()) {
p.mkdirs();
}
String imageName = System.currentTimeMillis() + "_3D饼图" + ".jpeg";
File file = new File(p.getPath() + "/" + imageName);
try {
if(file.exists()) {
file.delete();
}
ChartUtils.saveChartAsJPEG(file, chart, 800, 600);
} catch (IOException e) {
e.printStackTrace();
}
}
/**
* 生成柱状图
*/
public static void testBarChart() throws Exception {
//x轴名称列表
List<String> xAxisNameList = new ArrayList<>(Arrays.asList("一级", "二级", "三级", "四级", "五级"));
//图例名称列表
List<String> legendNameList = new ArrayList<>(Arrays.asList("李四", "张三"));
//数据列表
List<List<Object>> dataList = new ArrayList<>();
dataList.add(new ArrayList<>(Arrays.asList(100, 90, 5, 6, 2)));
dataList.add(new ArrayList<>(Arrays.asList(2, 0, 3, 4, 5)));
//图例背景颜色
List<Color> legendColorList = new ArrayList<>(Arrays.asList(new Color(65, 105, 225)));
JFreeChart chart = GenerateChartUtil.createBarChart("各级变化图", legendNameList, xAxisNameList
, dataList, JFreeChartUtil.createChartTheme("宋体"), "y轴", "x轴",
0d, 100d, legendColorList, true, "{2}%");
//在D盘目录下生成图片
File p = new File(imagePath);
if (!p.exists()) {
p.mkdirs();
}
String imageName = System.currentTimeMillis() + "_柱状图" + ".jpeg";
File file = new File(p.getPath() + "/" + imageName);
try {
if(file.exists()) {
file.delete();
}
ChartUtils.saveChartAsJPEG(file, chart, 800, 600);
} catch (IOException e) {
e.printStackTrace();
}
}
/**
* 层叠柱状图
*/
public static void stackedBarChart() throws Exception {
//x轴名称列表
List<String> xAxisNameList = new ArrayList<>(Arrays.asList("一级", "二级", "三级", "四级", "五级"));
//图例名称列表
List<String> legendNameList = new ArrayList<>(Arrays.asList("李四", "张三"));
//数据列表
List<List<Object>> dataList = new ArrayList<>();
dataList.add(new ArrayList<>(Arrays.asList(1, 3, 5, 6, 2)));
dataList.add(new ArrayList<>(Arrays.asList(2, 1, 3, 4, 5)));
// 返回outputStream
//GenerateChartUtil.createStackedBarChart(response.getOutputStream(), "各级变化图", legendNameList, xAxisNameList
// , dataList, JFreeChartUtil.createChartTheme("宋体"), "y轴", "x轴", 600, 400);
// 返回JFreeChart
JFreeChart chart = GenerateChartUtil.createStackedBarChart("各级变化图", legendNameList, xAxisNameList
, dataList, JFreeChartUtil.createChartTheme("宋体"), "y轴", "x轴");
//在D盘目录下生成图片
File p = new File(imagePath);
if (!p.exists()) {
p.mkdirs();
}
String imageName = System.currentTimeMillis() + "_层叠柱状图" + ".jpeg";
File file = new File(p.getPath() + "/" + imageName);
try {
if(file.exists()) {
file.delete();
}
ChartUtils.saveChartAsJPEG(file, chart, 800, 600);
} catch (IOException e) {
e.printStackTrace();
}
}
/**
* 生成折线图
*/
public static void lineChart() throws Exception {
//x轴名称列表
List<String> xAxisNameList = new ArrayList<>(Arrays.asList("一级", "二级", "三级", "四级", "五级"));
//图例名称列表
List<String> legendNameList = new ArrayList<>(Arrays.asList("李四", "张三","王五"));
//数据列表
List<List<Object>> dataList = new ArrayList<>();
dataList.add(new ArrayList<>(Arrays.asList(1, 3, 5, 6, 2)));
dataList.add(new ArrayList<>(Arrays.asList(2, 1, 3, 4, 5)));
dataList.add(new ArrayList<>(Arrays.asList(5, 8, 4, 6, 4)));
// 返回outputStream
//GenerateChartUtil.createLineChart(response.getOutputStream(), "各级变化图", legendNameList, xAxisNameList
// , dataList, JFreeChartUtil.createChartTheme("宋体"), "y轴", "x轴", 600, 400);
JFreeChart chart = GenerateChartUtil.createLineChart("各级变化图", legendNameList, xAxisNameList
, dataList, JFreeChartUtil.createChartTheme("宋体"), "y轴", "x轴");
//在D盘目录下生成图片
File p = new File(imagePath);
if (!p.exists()) {
p.mkdirs();
}
String imageName = System.currentTimeMillis() + "_折线图" + ".jpeg";
File file = new File(p.getPath() + "/" + imageName);
try {
if(file.exists()) {
file.delete();
}
ChartUtils.saveChartAsJPEG(file, chart, 800, 600);
} catch (IOException e) {
e.printStackTrace();
}
}
/**
* 生成散点图
*/
public static void scatterPlot() throws Exception {
//设置散点图数据集
//设置第一个
/*XYSeries firefox = new XYSeries("火狐浏览器");
firefox.add(1.0, 1.0);
firefox.add(2.0, 4.0);
firefox.add(3.0, 3.0);
//设置第二个
XYSeries chrome = new XYSeries("谷歌浏览器");
chrome.add(1.0, 4.0);
chrome.add(2.0, 5.0);
chrome.add(3.0, 6.0);
//设置第三个
XYSeries ie = new XYSeries("IE刘浏览器");
ie.add(3.0, 4.0);
ie.add(4.0, 5.0);
ie.add(5.0, 4.0);
//添加到数据集
XYSeriesCollection dataset = new XYSeriesCollection();
dataset.addSeries(firefox);
dataset.addSeries(chrome);
dataset.addSeries(ie);*/
XYSeriesCollection dataset = new XYSeriesCollection();
String nameArray[] = {"火狐","谷歌","IE","360浏览器"};
double value[][] = {{1,2},{2,4},{3,5},{1,4},{2,5},{3,6},{3,4},{4,5},{5,4},{3,6},{4,6},{5,9}};
int data =0;
for (int i=0; i<nameArray.length;i++) {
XYSeries firefox = new XYSeries(nameArray[i]);
for (int j=0;j<3;j++) {
firefox.add(value[data][0],value[data][1]);
data++;
}
dataset.addSeries(firefox);
}
// 返回outputStream
// GenerateChartUtil.createScatterPlot(response.getOutputStream(), "各级变化图", dataset
// , JFreeChartUtil.createChartTheme("宋体"), "y轴", "x轴", 600, 400);
JFreeChart chart = GenerateChartUtil.createScatterPlot("各级变化图", dataset
, JFreeChartUtil.createChartTheme("宋体"), "y轴", "x轴");
//在D盘目录下生成图片
File p = new File(imagePath);
if (!p.exists()) {
p.mkdirs();
}
String imageName = System.currentTimeMillis() + "_散点图" + ".jpeg";
File file = new File(p.getPath() + "/" + imageName);
try {
if(file.exists()) {
file.delete();
}
ChartUtils.saveChartAsJPEG(file, chart, 800, 600);
} catch (IOException e) {
e.printStackTrace();
}
}
/**
* 生成雷达图
*/
public static void radar() throws IOException {
/* DefaultCategoryDataset dataset = new DefaultCategoryDataset();
String group1 = "华为";
dataset.addValue(5, group1, "w1");
dataset.addValue(6, group1, "w2");
dataset.addValue(4, group1, "w3");
dataset.addValue(2, group1, "w4");
dataset.addValue(5, group1, "w5");
dataset.addValue(5, group1, "w6");
dataset.addValue(5, group1, "w7");
dataset.addValue(8, group1, "w8");
group1 = "苹果 ";
dataset.addValue(2, group1, "w1");
dataset.addValue(4, group1, "w2");
dataset.addValue(4, group1, "w3");
dataset.addValue(5, group1, "w4");
dataset.addValue(5, group1, "w5");
dataset.addValue(8, group1, "w6");
dataset.addValue(9, group1, "w7");
dataset.addValue(8, group1, "w8");*/
DefaultCategoryDataset dataset = new DefaultCategoryDataset();
String nameArray[]= {"华为","苹果","小米"};
Random r = new Random();
for (int i=0;i<nameArray.length;i++) {
for (int j=1;j<9;j++){
// 生成[0,10]区间的整数
int value = r.nextInt(10) * 2;
dataset.addValue(value, nameArray[i], "w"+j);
}
}
SpiderWebPlot spiderwebplot = new SpiderWebPlot(dataset);
JFreeChart chart = new JFreeChart("Test", TextTitle.DEFAULT_FONT, spiderwebplot, false);
LegendTitle legendtitle = new LegendTitle(spiderwebplot);
legendtitle.setPosition(RectangleEdge.TOP);
chart.addSubtitle(legendtitle);
//在D盘目录下生成图片
File p = new File(imagePath);
if (!p.exists()) {
p.mkdirs();
}
String imageName = System.currentTimeMillis() + "_雷达图" + ".jpeg";
File file = new File(p.getPath() + "/" + imageName);
try {
if(file.exists()) {
file.delete();
}
ChartUtils.saveChartAsJPEG(file, chart, 800, 600);
} catch (IOException e) {
e.printStackTrace();
}
// 下方是生成的图片插入到excel文件中
// excel2003工作表
HSSFWorkbook wb = new HSSFWorkbook();
// 创建工作表
HSSFSheet sheet = wb.createSheet("Sheet 1");
// 创建字节输出流
ByteArrayOutputStream byteArrayOut = new ByteArrayOutputStream();
// 读取chart信息至字节输出流
ChartUtils.writeChartAsPNG(byteArrayOut, chart, 600, 300);
// 画图的顶级管理器,一个sheet只能获取一个(一定要注意这点)
HSSFPatriarch patriarch = sheet.createDrawingPatriarch();
// anchor主要用于设置图片的属性
HSSFClientAnchor anchor = new HSSFClientAnchor(0, 0, 0, 0, (short) 2, (short) 1, (short) 12, (short) 15);
// anchor.setAnchorType(3);
// 插入图片
patriarch.createPicture(anchor, wb.addPicture(byteArrayOut.toByteArray(), HSSFWorkbook.PICTURE_TYPE_PNG));
// excel2003后缀
FileOutputStream fileOut = new FileOutputStream("D://雷达图.xls");
wb.write(fileOut);
fileOut.close();
}
/**
* 生成环形图
*/
public static void ringChart() {
DefaultPieDataset dataSet = new DefaultPieDataset();
//使用循环向数据集合中添加数据
int i,j;
String []a={"Java","VC","C++","数据结构","计算机网络"};
int []b={1964,820,825,960,1000};
for(i=0,j=0;i<a.length&&j<b.length;i++,j++){
dataSet.setValue(a[i],b[j]);
}
StandardChartTheme mChartTheme = new StandardChartTheme("CN");
mChartTheme.setLargeFont(new Font("黑体", Font.BOLD, 14)); // Y柱标签字体(浓度(单位:ppm))
mChartTheme.setExtraLargeFont(new Font("宋体", Font.PLAIN, 20)); //标题 (二氧化碳浓度趋势分析图)
//应用主题样式
ChartFactory.setChartTheme(mChartTheme);
//定义图标对象
JFreeChart chart = ChartFactory.createRingChart ("环形图",// 报表题目,字符串类型
dataSet, // 获得数据集
true, // 显示图例
false, // 不用生成工具
false // 不用生成URL地址
);
//图表
RingPlot ringplot=(RingPlot) chart.getPlot();
ringplot.setLabelFont(new Font("宋体", Font.BOLD, 14));
//用来显示标注的注解,{0}:{1}用来设置显示的格式
ringplot.setLabelGenerator(new StandardPieSectionLabelGenerator("{0}:{1}"));
// ringplot.setBackgroundPaint(Color.gray);//设置背景色
//设置简单标签
ringplot.setSimpleLabels(true);
//标题
TextTitle texttitle=chart.getTitle();
texttitle.setFont(new Font("宋体", Font.BOLD, 30));
//图示
LegendTitle legendtitle =chart.getLegend();
legendtitle.setItemFont(new Font("宋体", Font.BOLD, 14));
/*ChartFrame mChartFrame = new ChartFrame("环形图", chart);
mChartFrame.pack();
mChartFrame.setVisible(true);*/
//在D盘目录下生成图片
File p = new File(imagePath);
if (!p.exists()) {
p.mkdirs();
}
String imageName = System.currentTimeMillis() + "_环形图" + ".jpeg";
File file = new File(p.getPath() + "/" + imageName);
try {
if(file.exists()) {
file.delete();
}
ChartUtils.saveChartAsJPEG(file, chart, 800, 600);
} catch (IOException e) {
e.printStackTrace();
}
}
/**
* 生成仪表盘图
*/
public static void meter(){
DefaultValueDataset data = new DefaultValueDataset(32.0);
MeterPlot plot = new MeterPlot(data);
plot.setDialShape(DialShape.CHORD);
plot.setDialBackgroundPaint(Color.WHITE);
plot.setRange(new Range(0, 120));
plot.setDialOutlinePaint(Color.GRAY);
plot.setNeedlePaint(Color.BLACK);
plot.setTickLabelsVisible(true);
plot.setTickLabelPaint(Color.BLACK);
plot.setTickPaint(Color.GRAY);
plot.setTickLabelFormat(NumberFormat.getNumberInstance());
plot.setTickSize(10);
plot.setValuePaint(Color.BLACK);
plot.addInterval(new MeterInterval("Low", new Range(0, 70), null, null,new Color(128, 255, 128,90) ));
plot.addInterval(new MeterInterval("Normal", new Range(70, 100), null, null, new Color(255, 255, 128,90)));
plot.addInterval(new MeterInterval("High", new Range(100, 120), null, null, new Color(255, 128, 128,90)));
//创建chart,最后一个参数决定是否显示图例
final JFreeChart chart = new JFreeChart("Meter Chart", JFreeChart.DEFAULT_TITLE_FONT, plot, true);
//在D盘目录下生成图片
File p = new File(imagePath);
if (!p.exists()) {
p.mkdirs();
}
String imageName = System.currentTimeMillis() + "_仪表盘" + ".jpeg";
File file = new File(p.getPath() + "/" + imageName);
try {
if(file.exists()) {
file.delete();
}
ChartUtils.saveChartAsJPEG(file, chart, 800, 600);
} catch (IOException e) {
e.printStackTrace();
}
}
/**
* 生成仪表盘
*/
public static void meter2(){
//1,数据集合对象 此处为DefaultValueDataset
DefaultValueDataset dataset = new DefaultValueDataset();
// 当前指针指向的位置,即:我们需要显示的数据
dataset.setValue(12D);
/**
* 获取图表区域对象
*
* A. setDataSet(int index, DataSet dataSet);
* 为表盘设定使用的数据集,通常一个表盘上可能存在多个指针,
* 因此需要制定该数据集与哪个指针相互关联。
* 可以将指针想象成数据集的一种体现方式。
*/
DialPlot dialplot = new DialPlot();
dialplot.setView(0.0D, 0.0D, 1.0D, 1.0D);
dialplot.setDataset(0,dataset);
/**
* 开始设置显示框架结构
* B. setDailFrame(DailFrame dailFrame);设置表盘的底层面板图像,通常表盘是整个仪表的最底层。
*/
DialFrame dialframe =new StandardDialFrame();
dialplot.setDialFrame(dialframe);
/**
* 结束设置显示框架结构DialCap
* C. setBackground(Color color);设置表盘的颜色,可以采用Java内置的颜色控制方式来调用该方法。
*/
GradientPaint gradientpaint = new GradientPaint(new Point(), new Color(255, 255, 255), new Point(), new Color(170, 170, 220));
DialBackground dialbackground = new DialBackground(gradientpaint);
dialbackground.setGradientPaintTransformer(new StandardGradientPaintTransformer(GradientPaintTransformType.VERTICAL));
dialplot.setBackground(dialbackground);
// 设置显示在表盘中央位置的信息
DialTextAnnotation dialtextannotation = new DialTextAnnotation("温度");
dialtextannotation.setFont(new Font("Dialog", 1, 14));
dialtextannotation.setRadius(0.69999999999999996D);
dialplot.addLayer(dialtextannotation);
DialValueIndicator dialvalueindicator = new DialValueIndicator(0);
dialplot.addLayer(dialvalueindicator);
// 根据表盘的直径大小(0.75),设置总刻度范围
/**
* E. addScale(int index, DailScale dailScale);
* 用于设定表盘上的量程,index指明该量程属于哪一个指针所指向的数据集,
* DailScale指明该量程的样式,如量程的基本单位等信息。
*
* StandardDialScale(double lowerBound, double upperBound, double startAngle,
* double extent, double majorTickIncrement, int minorTickCount)
* new StandardDialScale(-40D, 60D, -120D, -300D,30D);
*/
//
StandardDialScale standarddialscale =new StandardDialScale();
standarddialscale.setLowerBound(-40D);
standarddialscale.setUpperBound(60D);
standarddialscale.setStartAngle(-120D);
standarddialscale.setExtent(-300D);
standarddialscale.setTickRadius(0.88D);
standarddialscale.setTickLabelOffset(0.14999999999999999D);
standarddialscale.setTickLabelFont(new Font("Dialog", 0, 14));
dialplot.addScale(0, standarddialscale);
/**
* F. addLayer(DailRange dailRange);
* 用于设定某一特定量程的特殊表现,通常位于量程之下,如红色范围标注,绿色范围标注等。
* 在调用该方法之前需要设定DailRange的一些信息,包括位置信息,颜色信息等等。
*/
//设置刻度范围(红色)
StandardDialRange standarddialrange = new StandardDialRange(40D, 60D, Color.red);
standarddialrange.setInnerRadius(0.52000000000000002D);
standarddialrange.setOuterRadius(0.55000000000000004D);
dialplot.addLayer(standarddialrange);
//设置刻度范围(橘黄色)
StandardDialRange standarddialrange1 = new StandardDialRange(10D, 40D, Color.orange);
standarddialrange1.setInnerRadius(0.52000000000000002D);
standarddialrange1.setOuterRadius(0.55000000000000004D);
dialplot.addLayer(standarddialrange1);
//设置刻度范围(绿色)
StandardDialRange standarddialrange2 = new StandardDialRange(-40D, 10D, Color.green);
standarddialrange2.setInnerRadius(0.52000000000000002D);
standarddialrange2.setOuterRadius(0.55000000000000004D);
dialplot.addLayer(standarddialrange2);
/**
* 设置指针
* G. addPointer(DailPointer dailPointer);
* 用于设定表盘使用的指针样式,JFreeChart中有很多可供选择指针样式,
* 用户可以根据使用需要,采用不同的DailPoint的实现类来调用该方法
*/
DialPointer.Pointer pointer = new DialPointer.Pointer(); //内部内
dialplot.addPointer(pointer); //addLayer(pointer);
/**
* 实例化DialCap
* H. setCap(DailCap dailCap);设定指针上面的盖帽的样式。
*/
DialCap dialcap = new DialCap();
dialcap.setRadius(0.10000000000000001D);
dialplot.setCap(dialcap);
//生成chart对象
JFreeChart jfreechart = new JFreeChart(dialplot);
//设置标题
jfreechart.setTitle("设备取水温度采样");
//在D盘目录下生成图片
File p = new File(imagePath);
if (!p.exists()) {
p.mkdirs();
}
String imageName = System.currentTimeMillis() + "_仪表盘2" + ".jpeg";
File file = new File(p.getPath() + "/" + imageName);
try {
if(file.exists()) {
file.delete();
}
ChartUtils.saveChartAsJPEG(file, jfreechart, 500, 500);
} catch (IOException e) {
e.printStackTrace();
}
/* ChartFrame frame = new ChartFrame("CityInfoPort公司组织架构图 ", jfreechart,true);
frame.pack();
//屏幕居中
RefineryUtilities.centerFrameOnScreen(frame);
frame.setVisible(true);*/
}
/**
* 生成XY图
*/
public static void xyImage() throws Exception {
/*final XYSeries firefox = new XYSeries( "火狐" );
firefox.add( 1.0 , 1.0 );
firefox.add( 2.0 , 4.0 );
firefox.add( 3.0 , 3.0 );
final XYSeries chrome = new XYSeries( "谷歌" );
chrome.add( 1.0 , 4.0 );
chrome.add( 2.0 , 5.0 );
chrome.add( 3.0 , 6.0 );
final XYSeries iexplorer = new XYSeries( "IE" );
iexplorer.add( 3.0 , 4.0 );
iexplorer.add( 4.0 , 5.0 );
iexplorer.add( 5.0 , 4.0 );
final XYSeriesCollection dataset = new XYSeriesCollection( );
dataset.addSeries( firefox );
dataset.addSeries( chrome );
dataset.addSeries( iexplorer );*/
XYSeriesCollection dataset = new XYSeriesCollection();
String nameArray[] = {"火狐","谷歌","IE","360浏览器"};
double value[][] = {{1,2},{2,4},{3,5},{1,4},{2,5},{3,6},{3,4},{4,5},{5,4},{3,6},{4,6},{5,9}};
int data =0;
for (int i=0; i<nameArray.length;i++) {
XYSeries firefox = new XYSeries(nameArray[i]);
for (int j=0;j<3;j++) {
firefox.add(value[data][0],value[data][1]);
data++;
}
dataset.addSeries(firefox);
}
JFreeChart chart = ChartFactory.createXYLineChart(
"浏览器使用情况统计",
"类别",
"分数",
dataset,
PlotOrientation.VERTICAL,
true,
true,
false);
chart.getTitle().setFont(JFreeChartUtil.getDefaultFont(0,15f));
//设置提示条字体
Font font = new Font("宋体", Font.BOLD, 15);
chart.getLegend().setItemFont(font);
// 标注位于上侧
// chart.getLegend().setPosition(RectangleEdge.TOP);
// 设置标注无边框
chart.getLegend().setFrame(new BlockBorder(Color.WHITE));
// 得到图块,准备设置标签的字体
XYPlot plot = (XYPlot) chart.getPlot();
//设置plot的背景色透明度
plot.setBackgroundAlpha(0.0f);
// 设置网格横线颜色
plot.setRangeGridlinePaint(Color.gray);
// 设置网格横线大小
plot.setDomainGridlineStroke(new BasicStroke(0.2F));
plot.setRangeGridlineStroke(new BasicStroke(0.2F));
int width = 640;
int height = 480;
//在D盘目录下生成图片
File p = new File(imagePath);
if (!p.exists()) {
p.mkdirs();
}
String imageName = System.currentTimeMillis() + "_XY图" + ".jpeg";
File file = new File(p.getPath() + "/" + imageName);
try {
if(file.exists()) {
file.delete();
}
ChartUtils.saveChartAsJPEG(file, chart, width, height);
} catch (IOException e) {
e.printStackTrace();
}
}
}3.1 生成饼图
3.1.1 调用方法
    /**
     * 生成饼图
     */
    public static void testPie() throws Exception {
        //图例名称列表
        List<String> legendNameList = new ArrayList<>(Arrays.asList("一级", "二级", "三级", "四级", "五级"));
        //数据列表
        List<Object> dataList = new ArrayList<>(Arrays.asList(1, 3, 5, 6, 2));
        //图例背景颜色列表
        List<Color> legendColorList = new ArrayList<>(Arrays.asList(Color.YELLOW, Color.GRAY, Color.green, Color.cyan, Color.ORANGE));
        //偏离百分比数据
        List<Double> explodePercentList = new ArrayList<>(Arrays.asList(0.1, 0.1, 0.1, 0.1, 0.1));
        JFreeChart chart = GeneratePieChartUtil.createPieChart("各级占比情况", legendNameList, dataList
                ,JFreeChartUtil.createChartTheme("宋体"), legendColorList, explodePercentList);
        //在D盘目录下生成图片
        File p = new File(imagePath);
        if (!p.exists()) {
            p.mkdirs();
        }
        String imageName = System.currentTimeMillis() + "_饼图" + ".jpeg";
        File file = new File(p.getPath() + "/" + imageName);
        try {
            if(file.exists()) {
                file.delete();
            }
            ChartUtils.saveChartAsJPEG(file, chart, 800, 600);
        } catch (IOException e) {
            e.printStackTrace();
        }
    }
3.1.2 生成图片效果
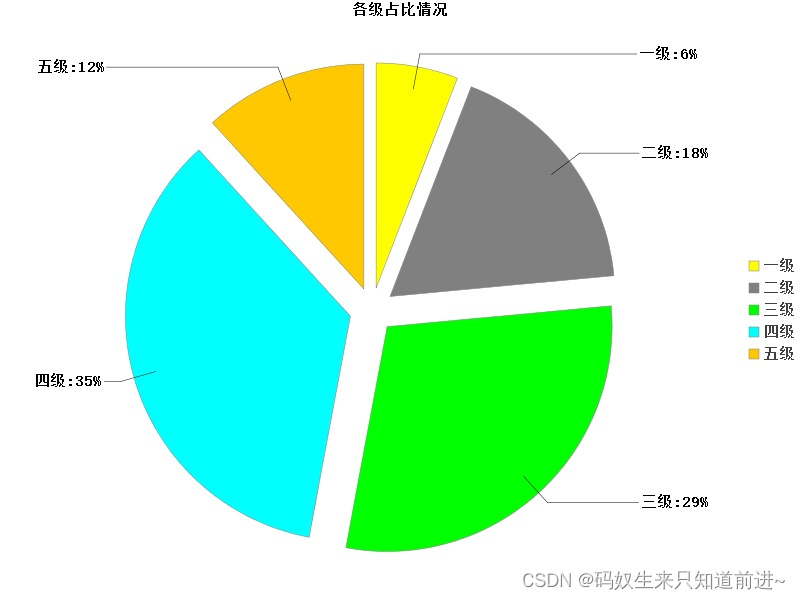
PS:生成的饼图不需要中间的间隙,就注释掉 设置偏离百分比代码
3.2 生成3D饼图
3.2.1 调用方法
/**
* 生成3D饼图
* @throws Exception
*/
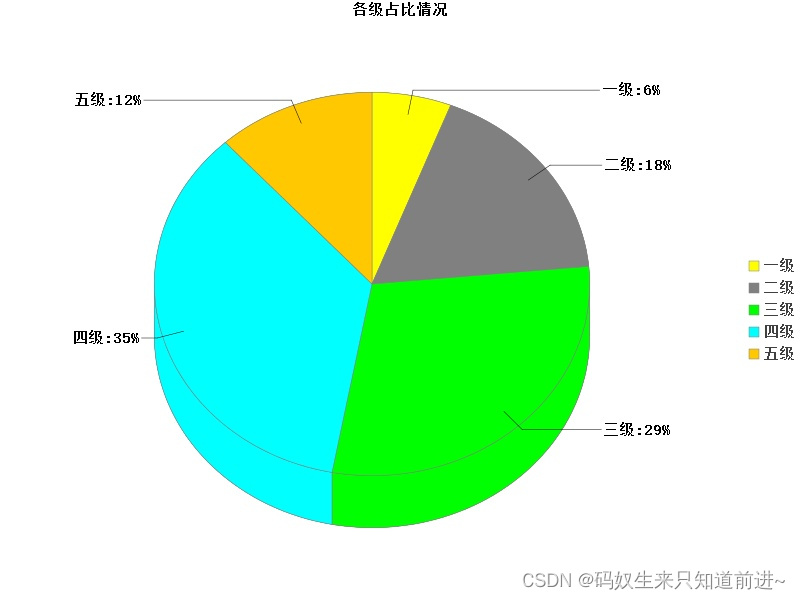
public static void testPie3D() throws Exception {
//图例名称列表
List<String> legendNameList = new ArrayList<>(Arrays.asList("一级", "二级", "三级", "四级", "五级"));
//数据列表
List<Object> dataList = new ArrayList<>(Arrays.asList(1, 3, 5, 6, 2));
//图例背景颜色列表
List<Color> legendColorList = new ArrayList<>(Arrays.asList(Color.YELLOW, Color.GRAY, Color.green, Color.cyan, Color.ORANGE));
JFreeChart chart = GeneratePieChartUtil.create3DPieChart("各级占比情况", legendNameList, dataList
, JFreeChartUtil.createChartTheme("宋体"), 1f, legendColorList);
//在D盘目录下生成图片
File p = new File(imagePath);
if (!p.exists()) {
p.mkdirs();
}
String imageName = System.currentTimeMillis() + "_3D饼图" + ".jpeg";
File file = new File(p.getPath() + "/" + imageName);
try {
if(file.exists()) {
file.delete();
}
ChartUtils.saveChartAsJPEG(file, chart, 800, 600);
} catch (IOException e) {
e.printStackTrace();
}
}3.2.2 生成图片效果
3.3 生成柱状图
3.3.1 调用方法
/**
* 生成柱状图
*/
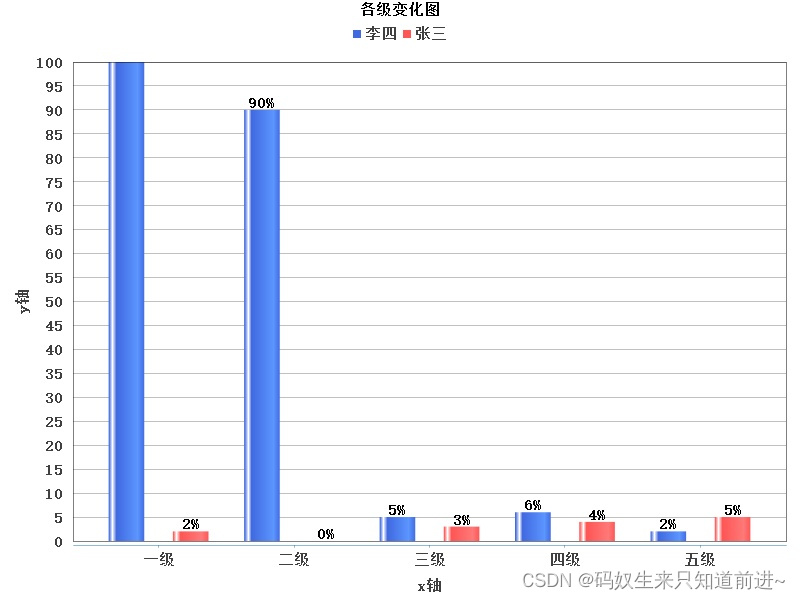
public static void testBarChart() throws Exception {
//x轴名称列表
List<String> xAxisNameList = new ArrayList<>(Arrays.asList("一级", "二级", "三级", "四级", "五级"));
//图例名称列表
List<String> legendNameList = new ArrayList<>(Arrays.asList("李四", "张三"));
//数据列表
List<List<Object>> dataList = new ArrayList<>();
dataList.add(new ArrayList<>(Arrays.asList(100, 90, 5, 6, 2)));
dataList.add(new ArrayList<>(Arrays.asList(2, 0, 3, 4, 5)));
//图例背景颜色
List<Color> legendColorList = new ArrayList<>(Arrays.asList(new Color(65, 105, 225)));
JFreeChart chart = GenerateChartUtil.createBarChart("各级变化图", legendNameList, xAxisNameList
, dataList, JFreeChartUtil.createChartTheme("宋体"), "y轴", "x轴",
0d, 100d, legendColorList, true, "{2}%");
//在D盘目录下生成图片
File p = new File(imagePath);
if (!p.exists()) {
p.mkdirs();
}
String imageName = System.currentTimeMillis() + "_柱状图" + ".jpeg";
File file = new File(p.getPath() + "/" + imageName);
try {
if(file.exists()) {
file.delete();
}
ChartUtils.saveChartAsJPEG(file, chart, 800, 600);
} catch (IOException e) {
e.printStackTrace();
}
}3.3.2 生成图片效果
3.4 生成折线图
3.4.1 调用方法
    /**
     * 生成折线图
     */
    public static void lineChart() throws Exception {
        //x轴名称列表
        List<String> xAxisNameList = new ArrayList<>(Arrays.asList("一级", "二级", "三级", "四级", "五级"));
        //图例名称列表
        List<String> legendNameList = new ArrayList<>(Arrays.asList("李四", "张三","王五"));
        //数据列表
        List<List<Object>> dataList = new ArrayList<>();
        dataList.add(new ArrayList<>(Arrays.asList(1, 3, 5, 6, 2)));
        dataList.add(new ArrayList<>(Arrays.asList(2, 1, 3, 4, 5)));
        dataList.add(new ArrayList<>(Arrays.asList(5, 8, 4, 6, 4)));

        // 返回outputStream
        //GenerateChartUtil.createLineChart(response.getOutputStream(), "各级变化图", legendNameList, xAxisNameList
               // , dataList, JFreeChartUtil.createChartTheme("宋体"), "y轴", "x轴", 600, 400);

        JFreeChart chart = GenerateChartUtil.createLineChart("各级变化图", legendNameList, xAxisNameList
                , dataList, JFreeChartUtil.createChartTheme("宋体"), "y轴", "x轴");
        //在D盘目录下生成图片
        File p = new File(imagePath);
        if (!p.exists()) {
            p.mkdirs();
        }
        String imageName = System.currentTimeMillis() + "_折线图" + ".jpeg";
        File file = new File(p.getPath() + "/" + imageName);
        try {
            if(file.exists()) {
                file.delete();
            }
            ChartUtils.saveChartAsJPEG(file, chart, 800, 600);
        } catch (IOException e) {
            e.printStackTrace();
        }
    }
3.4.2 生成图片效果

3.5 生成层叠柱状图
3.5.1 调用方法
/**
* 层叠柱状图
*/
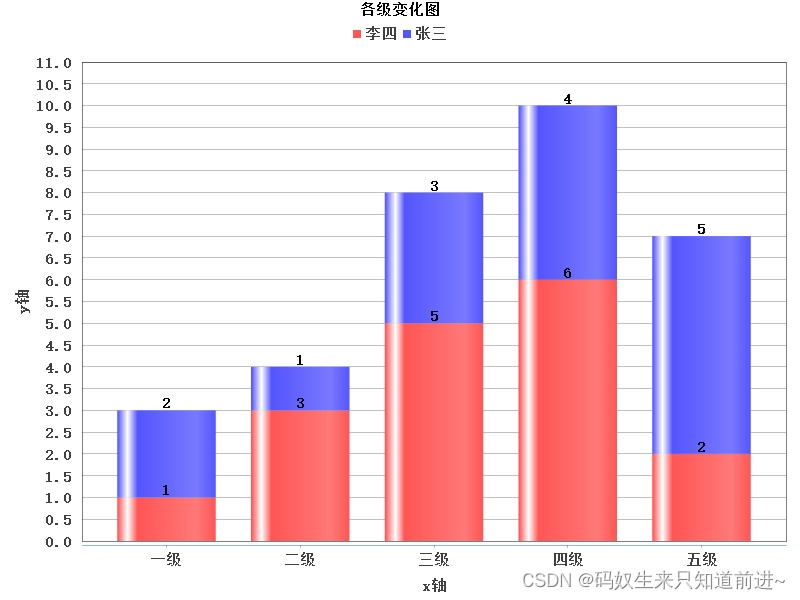
public static void stackedBarChart() throws Exception {
//x轴名称列表
List<String> xAxisNameList = new ArrayList<>(Arrays.asList("一级", "二级", "三级", "四级", "五级"));
//图例名称列表
List<String> legendNameList = new ArrayList<>(Arrays.asList("李四", "张三"));
//数据列表
List<List<Object>> dataList = new ArrayList<>();
dataList.add(new ArrayList<>(Arrays.asList(1, 3, 5, 6, 2)));
dataList.add(new ArrayList<>(Arrays.asList(2, 1, 3, 4, 5)));
// 返回outputStream
//GenerateChartUtil.createStackedBarChart(response.getOutputStream(), "各级变化图", legendNameList, xAxisNameList
// , dataList, JFreeChartUtil.createChartTheme("宋体"), "y轴", "x轴", 600, 400);
// 返回JFreeChart
JFreeChart chart = GenerateChartUtil.createStackedBarChart("各级变化图", legendNameList, xAxisNameList
, dataList, JFreeChartUtil.createChartTheme("宋体"), "y轴", "x轴");
//在D盘目录下生成图片
File p = new File(imagePath);
if (!p.exists()) {
p.mkdirs();
}
String imageName = System.currentTimeMillis() + "_层叠柱状图" + ".jpeg";
File file = new File(p.getPath() + "/" + imageName);
try {
if(file.exists()) {
file.delete();
}
ChartUtils.saveChartAsJPEG(file, chart, 800, 600);
} catch (IOException e) {
e.printStackTrace();
}
}3.5.2 生成图片效果
3.6 生成散点图
3.6.1 调用方法
    /**
     * 生成散点图
     */
    public static void scatterPlot() throws Exception {
        //设置散点图数据集
        //设置第一个
        XYSeries firefox = new XYSeries("火狐浏览器");
        firefox.add(1.0, 1.0);
        firefox.add(2.0, 4.0);
        firefox.add(3.0, 3.0);
        //设置第二个
        XYSeries chrome = new XYSeries("谷歌浏览器");
        chrome.add(1.0, 4.0);
        chrome.add(2.0, 5.0);
        chrome.add(3.0, 6.0);
        //设置第三个
        XYSeries ie = new XYSeries("IE刘浏览器");
        ie.add(3.0, 4.0);
        ie.add(4.0, 5.0);
        ie.add(5.0, 4.0);
        //添加到数据集
        XYSeriesCollection dataset = new XYSeriesCollection();
        dataset.addSeries(firefox);
        dataset.addSeries(chrome);
        dataset.addSeries(ie);
        // 返回outputStream
        // GenerateChartUtil.createScatterPlot(response.getOutputStream(), "各级变化图", dataset
                // , JFreeChartUtil.createChartTheme("宋体"), "y轴", "x轴", 600, 400);

        JFreeChart chart = GenerateChartUtil.createScatterPlot("各级变化图", dataset
                , JFreeChartUtil.createChartTheme("宋体"), "y轴", "x轴");
        //在D盘目录下生成图片
        File p = new File(imagePath);
        if (!p.exists()) {
            p.mkdirs();
        }
        String imageName = System.currentTimeMillis() + "_散点图" + ".jpeg";
        File file = new File(p.getPath() + "/" + imageName);
        try {
            if(file.exists()) {
                file.delete();
            }
            ChartUtils.saveChartAsJPEG(file, chart, 800, 600);
        } catch (IOException e) {
            e.printStackTrace();
        }
    }
3.6.2 生成图片效果

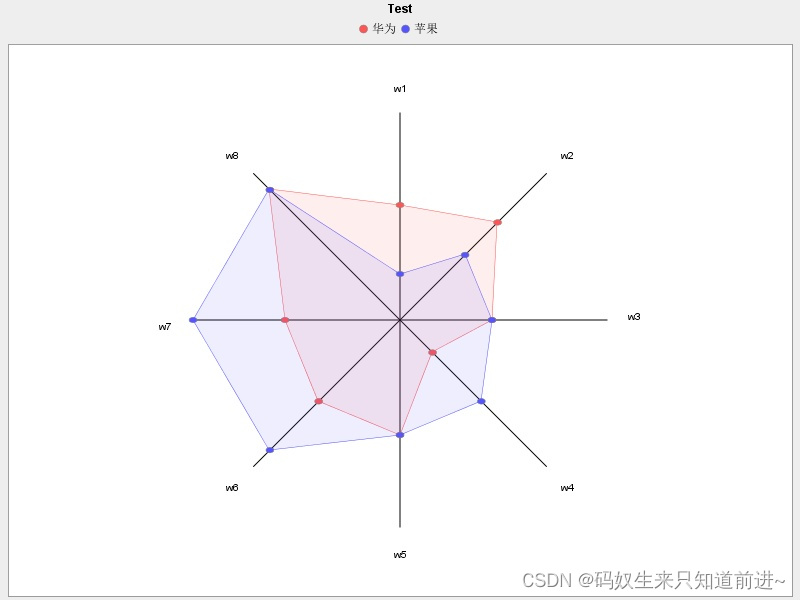
3.7 雷达图
3.7.1 调用方法
/**
     * 生成雷达图
     */
    public static void radar() throws IOException {
        DefaultCategoryDataset dataset = new DefaultCategoryDataset();
        String group1 = "华为";
        dataset.addValue(5, group1, "w1");
        dataset.addValue(6, group1, "w2");
        dataset.addValue(4, group1, "w3");
        dataset.addValue(2, group1, "w4");
        dataset.addValue(5, group1, "w5");
        dataset.addValue(5, group1, "w6");
        dataset.addValue(5, group1, "w7");
        dataset.addValue(8, group1, "w8");
        group1 = "苹果 ";
        dataset.addValue(2, group1, "w1");
        dataset.addValue(4, group1, "w2");
        dataset.addValue(4, group1, "w3");
        dataset.addValue(5, group1, "w4");
        dataset.addValue(5, group1, "w5");
        dataset.addValue(8, group1, "w6");
        dataset.addValue(9, group1, "w7");
        dataset.addValue(8, group1, "w8");

        SpiderWebPlot spiderwebplot = new SpiderWebPlot(dataset);

        JFreeChart chart = new JFreeChart("Test", TextTitle.DEFAULT_FONT, spiderwebplot, false);
        LegendTitle legendtitle = new LegendTitle(spiderwebplot);
        legendtitle.setPosition(RectangleEdge.TOP);
        chart.addSubtitle(legendtitle);

        //在D盘目录下生成图片
        File p = new File(imagePath);
        if (!p.exists()) {
            p.mkdirs();
        }
        String imageName = System.currentTimeMillis() + "_雷达图" + ".jpeg";
        File file = new File(p.getPath() + "/" + imageName);
        try {
            if(file.exists()) {
                file.delete();
            }
            ChartUtils.saveChartAsJPEG(file, chart, 800, 600);
        } catch (IOException e) {
            e.printStackTrace();
        }
        // 下方是生成的图片插入到excel文件中
        // excel2003工作表
        HSSFWorkbook wb = new HSSFWorkbook();
        // 创建工作表
        HSSFSheet sheet = wb.createSheet("Sheet 1");
        // 创建字节输出流
        ByteArrayOutputStream byteArrayOut = new ByteArrayOutputStream();

        // 读取chart信息至字节输出流
        ChartUtils.writeChartAsPNG(byteArrayOut, chart, 600, 300);
        // 画图的顶级管理器,一个sheet只能获取一个(一定要注意这点)
        HSSFPatriarch patriarch = sheet.createDrawingPatriarch();
        // anchor主要用于设置图片的属性
        HSSFClientAnchor anchor = new HSSFClientAnchor(0, 0, 0, 0, (short) 2, (short) 1, (short) 12, (short) 15);
        // anchor.setAnchorType(3);
        // 插入图片
        patriarch.createPicture(anchor, wb.addPicture(byteArrayOut.toByteArray(), HSSFWorkbook.PICTURE_TYPE_PNG));
        // excel2003后缀
        FileOutputStream fileOut = new FileOutputStream("D://雷达图.xls");
        wb.write(fileOut);
        fileOut.close();
    }
3.7.2 生成图片效果
3.8 环形图
3.8.1 调用方法
/**
     * 生成环形图
     */
    public static void ringChart() {
        DefaultPieDataset dataSet = new DefaultPieDataset();
        //使用循环向数据集合中添加数据
        int i,j;
        String []a={"Java","VC","C++","数据结构","计算机网络"};
        int []b={1964,820,825,960,1000};
        for(i=0,j=0;i<a.length&&j<b.length;i++,j++){
            dataSet.setValue(a[i],b[j]);
        }

        StandardChartTheme mChartTheme = new StandardChartTheme("CN");
        mChartTheme.setLargeFont(new Font("黑体", Font.BOLD, 14)); // Y柱标签字体(浓度(单位:ppm))
        mChartTheme.setExtraLargeFont(new Font("宋体", Font.PLAIN, 20)); //标题 (二氧化碳浓度趋势分析图)
        //应用主题样式
        ChartFactory.setChartTheme(mChartTheme);
        //定义图标对象
        JFreeChart chart = ChartFactory.createRingChart ("环形图",// 报表题目,字符串类型
                dataSet, // 获得数据集
                true, // 显示图例
                false, // 不用生成工具
                false // 不用生成URL地址
        );
        //图表
        RingPlot ringplot=(RingPlot) chart.getPlot();
        ringplot.setLabelFont(new Font("宋体", Font.BOLD, 14));
        //用来显示标注的注解,{0}:{1}用来设置显示的格式
        ringplot.setLabelGenerator(new StandardPieSectionLabelGenerator("{0}:{1}"));
        // ringplot.setBackgroundPaint(Color.gray);//设置背景色
        //设置简单标签
        ringplot.setSimpleLabels(true);
        //标题
        TextTitle texttitle=chart.getTitle();
        texttitle.setFont(new Font("宋体", Font.BOLD, 30));
        //图示
        LegendTitle legendtitle =chart.getLegend();
        legendtitle.setItemFont(new Font("宋体", Font.BOLD, 14));
        /*ChartFrame mChartFrame = new ChartFrame("环形图", chart);
        mChartFrame.pack();
        mChartFrame.setVisible(true);*/

        //在D盘目录下生成图片
        File p = new File(imagePath);
        if (!p.exists()) {
            p.mkdirs();
        }
        String imageName = System.currentTimeMillis() + "_环形图" + ".jpeg";
        File file = new File(p.getPath() + "/" + imageName);
        try {
            if(file.exists()) {
                file.delete();
            }
            ChartUtils.saveChartAsJPEG(file, chart, 800, 600);
        } catch (IOException e) {
            e.printStackTrace();
        }
    }
3.8.2生成图片效果 
3.9 仪表盘
3.9.1 调用方法
/**
     * 生成仪表盘
     */
    public static void meter2(){
        //1,数据集合对象 此处为DefaultValueDataset
        DefaultValueDataset dataset = new DefaultValueDataset();
        //  当前指针指向的位置,即:我们需要显示的数据
        dataset.setValue(12D);
        /**
         *  获取图表区域对象
         *
         * A. setDataSet(int index, DataSet dataSet);
         * 为表盘设定使用的数据集,通常一个表盘上可能存在多个指针,
         * 因此需要制定该数据集与哪个指针相互关联。
         * 可以将指针想象成数据集的一种体现方式。
         */
        DialPlot dialplot = new DialPlot();
        dialplot.setView(0.0D, 0.0D, 1.0D, 1.0D);
        dialplot.setDataset(0,dataset);
        /**
         * 开始设置显示框架结构
         * B. setDailFrame(DailFrame dailFrame);设置表盘的底层面板图像,通常表盘是整个仪表的最底层。
         */
        DialFrame dialframe =new StandardDialFrame();
        dialplot.setDialFrame(dialframe);
        /**
         * 结束设置显示框架结构DialCap
         * C. setBackground(Color color);设置表盘的颜色,可以采用Java内置的颜色控制方式来调用该方法。
         */
        GradientPaint gradientpaint = new GradientPaint(new Point(), new Color(255, 255, 255), new Point(), new Color(170, 170, 220));
        DialBackground dialbackground = new DialBackground(gradientpaint);
        dialbackground.setGradientPaintTransformer(new StandardGradientPaintTransformer(GradientPaintTransformType.VERTICAL));
        dialplot.setBackground(dialbackground);
        //  设置显示在表盘中央位置的信息
        DialTextAnnotation dialtextannotation = new DialTextAnnotation("温度");
        dialtextannotation.setFont(new Font("Dialog", 1, 14));
        dialtextannotation.setRadius(0.69999999999999996D);
        dialplot.addLayer(dialtextannotation);
        DialValueIndicator dialvalueindicator = new DialValueIndicator(0);
        dialplot.addLayer(dialvalueindicator);
        //  根据表盘的直径大小(0.75),设置总刻度范围
        /**
         * E. addScale(int index, DailScale dailScale);
         * 用于设定表盘上的量程,index指明该量程属于哪一个指针所指向的数据集,
         * DailScale指明该量程的样式,如量程的基本单位等信息。
         *
         * StandardDialScale(double lowerBound, double upperBound, double startAngle,
         * double extent, double majorTickIncrement, int minorTickCount)
         * new StandardDialScale(-40D, 60D, -120D, -300D,30D);
         */
        //
        StandardDialScale standarddialscale =new StandardDialScale();
        standarddialscale.setLowerBound(-40D);
        standarddialscale.setUpperBound(60D);
        standarddialscale.setStartAngle(-120D);
        standarddialscale.setExtent(-300D);
        standarddialscale.setTickRadius(0.88D);
        standarddialscale.setTickLabelOffset(0.14999999999999999D);
        standarddialscale.setTickLabelFont(new Font("Dialog", 0, 14));
        dialplot.addScale(0, standarddialscale);
        /**
         * F. addLayer(DailRange dailRange);
         * 用于设定某一特定量程的特殊表现,通常位于量程之下,如红色范围标注,绿色范围标注等。
         * 在调用该方法之前需要设定DailRange的一些信息,包括位置信息,颜色信息等等。
         */
        //设置刻度范围(红色)
        StandardDialRange standarddialrange = new StandardDialRange(40D, 60D, Color.red);
        standarddialrange.setInnerRadius(0.52000000000000002D);
        standarddialrange.setOuterRadius(0.55000000000000004D);
        dialplot.addLayer(standarddialrange);
        //设置刻度范围(橘黄色)
        StandardDialRange standarddialrange1 = new StandardDialRange(10D, 40D, Color.orange);
        standarddialrange1.setInnerRadius(0.52000000000000002D);
        standarddialrange1.setOuterRadius(0.55000000000000004D);
        dialplot.addLayer(standarddialrange1);
        //设置刻度范围(绿色)
        StandardDialRange standarddialrange2 = new StandardDialRange(-40D, 10D, Color.green);
        standarddialrange2.setInnerRadius(0.52000000000000002D);
        standarddialrange2.setOuterRadius(0.55000000000000004D);
        dialplot.addLayer(standarddialrange2);

        /**
         * 设置指针
         * G. addPointer(DailPointer dailPointer);
         * 用于设定表盘使用的指针样式,JFreeChart中有很多可供选择指针样式,
         * 用户可以根据使用需要,采用不同的DailPoint的实现类来调用该方法
         */
        DialPointer.Pointer pointer = new DialPointer.Pointer(); //内部内
        dialplot.addPointer(pointer); //addLayer(pointer);
        /**
         * 实例化DialCap
         * H. setCap(DailCap dailCap);设定指针上面的盖帽的样式。
         */
        DialCap dialcap = new DialCap();
        dialcap.setRadius(0.10000000000000001D);
        dialplot.setCap(dialcap);
        //生成chart对象
        JFreeChart jfreechart = new JFreeChart(dialplot);
        //设置标题
        jfreechart.setTitle("设备取水温度采样");
        //在D盘目录下生成图片
        File p = new File(imagePath);
        if (!p.exists()) {
            p.mkdirs();
        }
        String imageName = System.currentTimeMillis() + "_仪表盘2" + ".jpeg";
        File file = new File(p.getPath() + "/" + imageName);
        try {
            if(file.exists()) {
                file.delete();
            }
            ChartUtils.saveChartAsJPEG(file, jfreechart, 500, 500);
        } catch (IOException e) {
            e.printStackTrace();
        }
       /* ChartFrame frame = new ChartFrame("CityInfoPort公司组织架构图 ", jfreechart,true);
        frame.pack();
        //屏幕居中
        RefineryUtilities.centerFrameOnScreen(frame);
        frame.setVisible(true);*/

    }
3.9.2 生成图片效果

4、项目实际使用
package com.shucha.deveiface.web.controller;

import com.shucha.deveiface.biz.utils.GenerateChartUtil;
import com.shucha.deveiface.biz.utils.GeneratePieChartUtil;
import com.shucha.deveiface.biz.utils.JFreeChartUtil;
import org.jfree.chart.JFreeChart;
import org.jfree.data.xy.XYSeries;
import org.jfree.data.xy.XYSeriesCollection;
import org.springframework.web.bind.annotation.GetMapping;
import org.springframework.web.bind.annotation.RequestMapping;
import org.springframework.web.bind.annotation.RestController;

import javax.servlet.ServletOutputStream;
import javax.servlet.http.HttpServletResponse;
import java.awt.*;
import java.net.URLEncoder;
import java.util.ArrayList;
import java.util.Arrays;
import java.util.List;

/**
 * @author tqf
 * @Description 图表生成图片下载测试
 * @Version 1.0
 * @since 2022-06-07 10:23
 */
@RequestMapping("/jFreeChart")
@RestController
public class JFreeChartController {

    /**
     * 折线图
     * @param response
     */
    @GetMapping("/lineChart")
    public void lineChart(HttpServletResponse response) throws Exception {
        //x轴名称列表
        List<String> xAxisNameList = new ArrayList<>(Arrays.asList("一级", "二级", "三级", "四级", "五级"));
        //图例名称列表
        List<String> legendNameList = new ArrayList<>(Arrays.asList("李四", "张三"));
        //数据列表
        List<List<Object>> dataList = new ArrayList<>();
        dataList.add(new ArrayList<>(Arrays.asList(1, 3, 5, 6, 2)));
        dataList.add(new ArrayList<>(Arrays.asList(2, 1, 3, 4, 5)));
        // 1、下面注释的是直接返回图片到前端
        // GenerateChartUtil.createLineChart(response.getOutputStream(), "各级变化图", legendNameList, xAxisNameList
               // , dataList, JFreeChartUtil.createChartTheme("宋体"), "y轴", "x轴", 600, 400);

        // 下面的是下载生成的图片
        byte[] byteArray = GenerateChartUtil.createLineChart("各级变化图", legendNameList, xAxisNameList
                , dataList, JFreeChartUtil.createChartTheme("宋体"), "y轴", "x轴", 600, 400);

        response.setContentType("application/vnd.ms-image/jpeg");
        response.setCharacterEncoding("utf-8");
        String imageName = System.currentTimeMillis() + "_折线图" + ".jpeg";
        String fileName = URLEncoder.encode(imageName, "UTF-8");
        response.setHeader("Content-disposition", "attachment;filename=" + fileName);
        ServletOutputStream output = response.getOutputStream();
        output.write(byteArray);
        output.flush();
    }

    /**
     * 散点图
     * @param response
     */
    @GetMapping("/scatterPlot")
    public void scatterPlot(HttpServletResponse response) throws Exception {
        //设置散点图数据集
        //设置第一个
        XYSeries firefox = new XYSeries("Firefox");
        firefox.add(1.0, 1.0);
        firefox.add(2.0, 4.0);
        firefox.add(3.0, 3.0);
        //设置第二个
        XYSeries chrome = new XYSeries("Chrome");
        chrome.add(1.0, 4.0);
        chrome.add(2.0, 5.0);
        chrome.add(3.0, 6.0);
        //设置第三个
        XYSeries ie = new XYSeries("IE");
        ie.add(3.0, 4.0);
        ie.add(4.0, 5.0);
        ie.add(5.0, 4.0);
        //添加到数据集
        XYSeriesCollection dataset = new XYSeriesCollection();
        dataset.addSeries(firefox);
        dataset.addSeries(chrome);
        dataset.addSeries(ie);
        // 这个是直接返回图片到前端
        GenerateChartUtil.createScatterPlot(response.getOutputStream(), "各级变化图", dataset
                , JFreeChartUtil.createChartTheme("宋体"), "y轴", "x轴", 600, 400);

        // 下面的是下载生成的图片
        byte[] byteArray = GenerateChartUtil.createScatterPlot("各级变化图", dataset
                , JFreeChartUtil.createChartTheme("宋体"), "y轴", "x轴", 600, 400);

        response.setContentType("application/vnd.ms-image/jpeg");
        response.setCharacterEncoding("utf-8");
        String imageName = System.currentTimeMillis() + "_散点图" + ".jpeg";
        String fileName = URLEncoder.encode(imageName, "UTF-8");
        response.setHeader("Content-disposition", "attachment;filename=" + fileName);
        ServletOutputStream output = response.getOutputStream();
        output.write(byteArray);
        output.flush();
    }

    /**
     * 堆叠柱状图
     * @param response
     */
    @GetMapping("/stackedBarChart")
    public void stackedBarChart(HttpServletResponse response) throws Exception {
        //x轴名称列表
        List<String> xAxisNameList = new ArrayList<>(Arrays.asList("一级", "二级", "三级", "四级", "五级"));
        //图例名称列表
        List<String> legendNameList = new ArrayList<>(Arrays.asList("李四", "张三"));
        //数据列表
        List<List<Object>> dataList = new ArrayList<>();
        dataList.add(new ArrayList<>(Arrays.asList(1, 3, 5, 6, 2)));
        dataList.add(new ArrayList<>(Arrays.asList(2, 1, 3, 4, 5)));
        // 这个是直接返回图片到前端
        GenerateChartUtil.createStackedBarChart(response.getOutputStream(), "各级变化图", legendNameList, xAxisNameList
                , dataList, JFreeChartUtil.createChartTheme("宋体"), "y轴", "x轴", 600, 400);

        // 下面的是下载生成的图片
        byte[] byteArray = GenerateChartUtil.createStackedBarChart("各级变化图", legendNameList, xAxisNameList
                , dataList, JFreeChartUtil.createChartTheme("宋体"), "y轴", "x轴", 600, 400);

        response.setContentType("application/vnd.ms-image/jpeg");
        response.setCharacterEncoding("utf-8");
        String imageName = System.currentTimeMillis() + "_堆叠柱状图" + ".jpeg";
        String fileName = URLEncoder.encode(imageName, "UTF-8");
        response.setHeader("Content-disposition", "attachment;filename=" + fileName);
        ServletOutputStream output = response.getOutputStream();
        output.write(byteArray);
        output.flush();
    }

    /**
     * 柱状图
     * @param response
     */
    @GetMapping("/barChart")
    public void barChart(HttpServletResponse response) throws Exception {
        //x轴名称列表
        List<String> xAxisNameList = new ArrayList<>(Arrays.asList("一级", "二级", "三级", "四级", "五级"));
        //图例名称列表
        List<String> legendNameList = new ArrayList<>(Arrays.asList("李四", "张三"));
        //数据列表
        List<List<Object>> dataList = new ArrayList<>();
        dataList.add(new ArrayList<>(Arrays.asList(100, 90, 5, 6, 2)));
        dataList.add(new ArrayList<>(Arrays.asList(2, 0, 3, 4, 5)));
        //图例背景颜色
        List<Color> legendColorList = new ArrayList<>(Arrays.asList(new Color(65, 105, 225)));

        // 这个是直接返回图片到前端
        GenerateChartUtil.createBarChart(response.getOutputStream(), "各级变化图", legendNameList, xAxisNameList
                , dataList, JFreeChartUtil.createChartTheme("宋体"), "y轴", "x轴"
                , 600, 400, 0d, 100d, legendColorList, true, "{2}%");

        // 下面的是下载生成的图片
        byte[] byteArray = GenerateChartUtil.createBarChart("各级变化图", legendNameList, xAxisNameList
                , dataList, JFreeChartUtil.createChartTheme("宋体"), "y轴", "x轴"
                , 600, 400, 0d, 100d, legendColorList, true, "{2}%");

        response.setContentType("application/vnd.ms-image/jpeg");
        response.setCharacterEncoding("utf-8");
        String imageName = System.currentTimeMillis() + "_堆叠柱状图" + ".jpeg";
        String fileName = URLEncoder.encode(imageName, "UTF-8");
        response.setHeader("Content-disposition", "attachment;filename=" + fileName);
        ServletOutputStream output = response.getOutputStream();
        output.write(byteArray);
        output.flush();
    }

    /**
     * 饼图
     * @param response
     * @throws Exception
     */
    @GetMapping("/pie")
    public void pie(HttpServletResponse response) throws Exception {
        //图例名称列表
        List<String> legendNameList = new ArrayList<>(Arrays.asList("一级", "二级", "三级", "四级", "五级"));
        //数据列表
        List<Object> dataList = new ArrayList<>(Arrays.asList(1, 3, 5, 6, 2));
        //图例背景颜色列表
        List<Color> legendColorList = new ArrayList<>(Arrays.asList(Color.YELLOW, Color.GRAY, Color.green, Color.cyan, Color.ORANGE));
        //偏离百分比数据
        List<Double> explodePercentList = new ArrayList<>(Arrays.asList(0.1, 0.1, 0.1, 0.1, 0.1));

        // 这个是直接返回图片到前端
        GeneratePieChartUtil.createPieChart(response.getOutputStream(),"各级占比情况", legendNameList, dataList
                ,600,400, JFreeChartUtil.createChartTheme("宋体"), legendColorList, explodePercentList);


        // 下面的是下载生成的图片
        byte[] byteArray = GeneratePieChartUtil.createPieChart("各级占比情况", legendNameList, dataList,400,600,
                 JFreeChartUtil.createChartTheme("宋体"), legendColorList, explodePercentList);
        response.setContentType("application/vnd.ms-image/jpeg");
        response.setCharacterEncoding("utf-8");
        String imageName = System.currentTimeMillis() + "_饼图" + ".jpeg";
        String fileName = URLEncoder.encode(imageName, "UTF-8");
        response.setHeader("Content-disposition", "attachment;filename=" + fileName);
        ServletOutputStream output = response.getOutputStream();
        output.write(byteArray);
        output.flush();
    }
}
4.1 折线图下载
    /**
     * 折线图
     * @param response
     */
    @GetMapping("/lineChart")
    public void lineChart(HttpServletResponse response) throws Exception {
        //x轴名称列表
        List<String> xAxisNameList = new ArrayList<>(Arrays.asList("一级", "二级", "三级", "四级", "五级"));
        //图例名称列表
        List<String> legendNameList = new ArrayList<>(Arrays.asList("李四", "张三"));
        //数据列表
        List<List<Object>> dataList = new ArrayList<>();
        dataList.add(new ArrayList<>(Arrays.asList(1, 3, 5, 6, 2)));
        dataList.add(new ArrayList<>(Arrays.asList(2, 1, 3, 4, 5)));
        // 1、下面注释的是直接返回图片到前端
        // GenerateChartUtil.createLineChart(response.getOutputStream(), "各级变化图", legendNameList, xAxisNameList
               // , dataList, JFreeChartUtil.createChartTheme("宋体"), "y轴", "x轴", 600, 400);

        // 下面的是下载生成的图片
        byte[] byteArray = GenerateChartUtil.createLineChart("各级变化图", legendNameList, xAxisNameList
                , dataList, JFreeChartUtil.createChartTheme("宋体"), "y轴", "x轴", 600, 400);

        response.setContentType("application/vnd.ms-image/jpeg");
        response.setCharacterEncoding("utf-8");
        String imageName = System.currentTimeMillis() + "_折线图" + ".jpeg";
        String fileName = URLEncoder.encode(imageName, "UTF-8");
        response.setHeader("Content-disposition", "attachment;filename=" + fileName);
        ServletOutputStream output = response.getOutputStream();
        output.write(byteArray);
        output.flush();
    }
4.2 散点图下载
    /**
     * 散点图
     * @param response
     */
    @GetMapping("/scatterPlot")
    public void scatterPlot(HttpServletResponse response) throws Exception {
        //设置散点图数据集
        //设置第一个
        XYSeries firefox = new XYSeries("Firefox");
        firefox.add(1.0, 1.0);
        firefox.add(2.0, 4.0);
        firefox.add(3.0, 3.0);
        //设置第二个
        XYSeries chrome = new XYSeries("Chrome");
        chrome.add(1.0, 4.0);
        chrome.add(2.0, 5.0);
        chrome.add(3.0, 6.0);
        //设置第三个
        XYSeries ie = new XYSeries("IE");
        ie.add(3.0, 4.0);
        ie.add(4.0, 5.0);
        ie.add(5.0, 4.0);
        //添加到数据集
        XYSeriesCollection dataset = new XYSeriesCollection();
        dataset.addSeries(firefox);
        dataset.addSeries(chrome);
        dataset.addSeries(ie);
        // 这个是直接返回图片到前端
        GenerateChartUtil.createScatterPlot(response.getOutputStream(), "各级变化图", dataset
                , JFreeChartUtil.createChartTheme("宋体"), "y轴", "x轴", 600, 400);

        // 下面的是下载生成的图片
        byte[] byteArray = GenerateChartUtil.createScatterPlot("各级变化图", dataset
                , JFreeChartUtil.createChartTheme("宋体"), "y轴", "x轴", 600, 400);

        response.setContentType("application/vnd.ms-image/jpeg");
        response.setCharacterEncoding("utf-8");
        String imageName = System.currentTimeMillis() + "_散点图" + ".jpeg";
        String fileName = URLEncoder.encode(imageName, "UTF-8");
        response.setHeader("Content-disposition", "attachment;filename=" + fileName);
        ServletOutputStream output = response.getOutputStream();
        output.write(byteArray);
        output.flush();
    }
4.3 堆叠柱状图下载
    /**
     * 堆叠柱状图
     * @param response
     */
    @GetMapping("/stackedBarChart")
    public void stackedBarChart(HttpServletResponse response) throws Exception {
        //x轴名称列表
        List<String> xAxisNameList = new ArrayList<>(Arrays.asList("一级", "二级", "三级", "四级", "五级"));
        //图例名称列表
        List<String> legendNameList = new ArrayList<>(Arrays.asList("李四", "张三"));
        //数据列表
        List<List<Object>> dataList = new ArrayList<>();
        dataList.add(new ArrayList<>(Arrays.asList(1, 3, 5, 6, 2)));
        dataList.add(new ArrayList<>(Arrays.asList(2, 1, 3, 4, 5)));
        // 这个是直接返回图片到前端
        GenerateChartUtil.createStackedBarChart(response.getOutputStream(), "各级变化图", legendNameList, xAxisNameList
                , dataList, JFreeChartUtil.createChartTheme("宋体"), "y轴", "x轴", 600, 400);

        // 下面的是下载生成的图片
        byte[] byteArray = GenerateChartUtil.createStackedBarChart("各级变化图", legendNameList, xAxisNameList
                , dataList, JFreeChartUtil.createChartTheme("宋体"), "y轴", "x轴", 600, 400);

        response.setContentType("application/vnd.ms-image/jpeg");
        response.setCharacterEncoding("utf-8");
        String imageName = System.currentTimeMillis() + "_堆叠柱状图" + ".jpeg";
        String fileName = URLEncoder.encode(imageName, "UTF-8");
        response.setHeader("Content-disposition", "attachment;filename=" + fileName);
        ServletOutputStream output = response.getOutputStream();
        output.write(byteArray);
        output.flush();
    }
4.4 柱状图下载
    /**
     * 柱状图
     * @param response
     */
    @GetMapping("/barChart")
    public void barChart(HttpServletResponse response) throws Exception {
        //x轴名称列表
        List<String> xAxisNameList = new ArrayList<>(Arrays.asList("一级", "二级", "三级", "四级", "五级"));
        //图例名称列表
        List<String> legendNameList = new ArrayList<>(Arrays.asList("李四", "张三"));
        //数据列表
        List<List<Object>> dataList = new ArrayList<>();
        dataList.add(new ArrayList<>(Arrays.asList(100, 90, 5, 6, 2)));
        dataList.add(new ArrayList<>(Arrays.asList(2, 0, 3, 4, 5)));
        //图例背景颜色
        List<Color> legendColorList = new ArrayList<>(Arrays.asList(new Color(65, 105, 225)));

        // 这个是直接返回图片到前端
        GenerateChartUtil.createBarChart(response.getOutputStream(), "各级变化图", legendNameList, xAxisNameList
                , dataList, JFreeChartUtil.createChartTheme("宋体"), "y轴", "x轴"
                , 600, 400, 0d, 100d, legendColorList, true, "{2}%");

        // 下面的是下载生成的图片
        byte[] byteArray = GenerateChartUtil.createBarChart("各级变化图", legendNameList, xAxisNameList
                , dataList, JFreeChartUtil.createChartTheme("宋体"), "y轴", "x轴"
                , 600, 400, 0d, 100d, legendColorList, true, "{2}%");

        response.setContentType("application/vnd.ms-image/jpeg");
        response.setCharacterEncoding("utf-8");
        String imageName = System.currentTimeMillis() + "_堆叠柱状图" + ".jpeg";
        String fileName = URLEncoder.encode(imageName, "UTF-8");
        response.setHeader("Content-disposition", "attachment;filename=" + fileName);
        ServletOutputStream output = response.getOutputStream();
        output.write(byteArray);
        output.flush();
    }
4.5 饼图下载
    /**
     * 饼图
     * @param response
     * @throws Exception
     */
    @GetMapping("/pie")
    public void pie(HttpServletResponse response) throws Exception {
        //图例名称列表
        List<String> legendNameList = new ArrayList<>(Arrays.asList("一级", "二级", "三级", "四级", "五级"));
        //数据列表
        List<Object> dataList = new ArrayList<>(Arrays.asList(1, 3, 5, 6, 2));
        //图例背景颜色列表
        List<Color> legendColorList = new ArrayList<>(Arrays.asList(Color.YELLOW, Color.GRAY, Color.green, Color.cyan, Color.ORANGE));
        //偏离百分比数据
        List<Double> explodePercentList = new ArrayList<>(Arrays.asList(0.1, 0.1, 0.1, 0.1, 0.1));

        // 这个是直接返回图片到前端
        GeneratePieChartUtil.createPieChart(response.getOutputStream(),"各级占比情况", legendNameList, dataList
                ,600,400, JFreeChartUtil.createChartTheme("宋体"), legendColorList, explodePercentList);


        // 下面的是下载生成的图片
        byte[] byteArray = GeneratePieChartUtil.createPieChart("各级占比情况", legendNameList, dataList,400,600,
                 JFreeChartUtil.createChartTheme("宋体"), legendColorList, explodePercentList);
        response.setContentType("application/vnd.ms-image/jpeg");
        response.setCharacterEncoding("utf-8");
        String imageName = System.currentTimeMillis() + "_饼图" + ".jpeg";
        String fileName = URLEncoder.encode(imageName, "UTF-8");
        response.setHeader("Content-disposition", "attachment;filename=" + fileName);
        ServletOutputStream output = response.getOutputStream();
        output.write(byteArray);
        output.flush();
    }
5、参考文章
参考文章地址![]() https://blog.csdn.net/qq_38974638/article/details/118704969整合了一下我项目实际使用
https://blog.csdn.net/qq_38974638/article/details/118704969整合了一下我项目实际使用


【推荐】编程新体验,更懂你的AI,立即体验豆包MarsCode编程助手
【推荐】凌霞软件回馈社区,博客园 & 1Panel & Halo 联合会员上线
【推荐】抖音旗下AI助手豆包,你的智能百科全书,全免费不限次数
【推荐】博客园社区专享云产品让利特惠,阿里云新客6.5折上折
【推荐】轻量又高性能的 SSH 工具 IShell:AI 加持,快人一步
· 一个费力不讨好的项目,让我损失了近一半的绩效!
· 清华大学推出第四讲使用 DeepSeek + DeepResearch 让科研像聊天一样简单!
· 实操Deepseek接入个人知识库
· CSnakes vs Python.NET:高效嵌入与灵活互通的跨语言方案对比
· Plotly.NET 一个为 .NET 打造的强大开源交互式图表库