filebeat收集tomcat,nginx日志发送给redis-->logstash --> elasticsearch实现日志分类缓存及写入到Redis不同的index
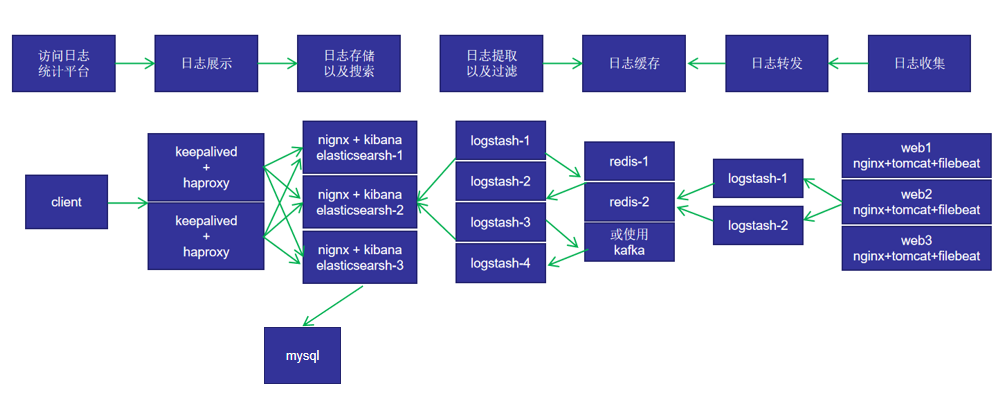
规划图:
架构规划:
在上面的图当中从左向右看,当要访问 ELK 日志统计平台的时候,首先访问的是两台 haproxy+keepalived 做的负载高可用,访问的地址是 keepalived 的 IP,当一台haproxy代理服务器挂掉之后,elasticsearch、kibana也不影响访问,然后 haproxy将请求转发到 nginx,nginx反向代理到本机的kibana,这里用nginx来实现身份验证,防止其他人随意登录kibana删除索引而导致数据丢失。 kibana 再去 elasticsearch 获取数据,elasticsearch 是三台做的集群,数据会随机保存在任意一台 elasticsearch 服务器,redis 服务器做数据的临时保存,避免 web服务器日志量过大的时候造成的数据收集与保存不一致导致的日志丢失,可以临时保存到 redis,redis 可以是集群,然后再由 logstash 服务器在非高峰时期从 redis持续的取出即可,另外有一台 mysql 数据库服务器,用于持久化保存特定的数据,比如状态码、客户端 IP、客户端浏览器版本等等,用于后期按月做数据统计等。 web 服务器的日志由 filebeat 收集之后发送给另外的一台 logstash,再有其写入到 redis 即可完成日志的收集,从图中可以看出,redis 服务器处于前端结合的最中间,其左右都要依赖于 redis 的正常运行,web 服务删个日志经过 filebeat 收集之后通过日志转发层的 logstash 写入到 redis 不同的 key 当中,然后提取层 logstash 再从 redis 将数据提取并安按照不同的类型写入到 elasticsearch 的不同 index 当中,用户最终通过 haproxy代理的nginx、nginx代理的 kibana 查看到收集到的日志的具体内容。
软件介绍:
keepalived:Keepalived的作用是检测服务器的状态,实现高可用集群。如果有一台web服务器宕机,或工作出现故障,Keepalived将检测到,并将有故障的服务器从系统中剔除,同时使用其他服务器代替该服务器的工作,当服务器工作正常后Keepalived自动将服务器加入到服务器群中,这些工作全部自动完成,不需要人工干涉,需要人工做的只是修复故障的服务器。
haproxy:HAProxy是一个企业级反向代理服务,其提供高可用性、负载均衡,以及基于TCP和HTTP的应用程序代理。HAProxy特别适用于那些负载特大的web站点,这些站点通常又需要会话保持或七层处理。HAProxy运行在当前的硬件上,完全可以支持数以万计的并发连接。并且它的运行模式使得它可以很简单安全的整合进您当前的架构中, 同时可以保护你的web服务器不被暴露到网络上。
ELK:ELK 是由 Elasticsearch、Logstash、Kibana 三个开源软件的组成的一个组合体,ELK 是 elastic 公司研发的一套完整的日志收集、分析和展示的企业级解决方案,在这三个软件当中,每个软件用于完成不同的功能,ELK 又称为ELK stack,官方域名为 elastic.co,ELK stack 的主要优点有如下几个:处理方式灵活: elasticsearch 是实时全文索引,具有强大的搜索功能、配置相对简单:elasticsearch 的 API 全部使用 JSON 接口,logstash 使用模块配置,kibana 的配置文件部分更简单、检索性能高效:基于优秀的设计,虽然每次查询都是实时,但是也可以达到百亿级数据的查询秒级响应、集群线性扩展:elasticsearch 和 logstash 都可以灵活线性扩展、前端操作绚丽:kibana 的前端设计比较绚丽,而且操作简单。
Elasticsearch:Elasticsearch 是位于 Elastic Stack 核心的分布式搜索和分析引擎。一个高度可扩展的,可实现数据的实时全文搜索搜索、支持分布式可实现高可用、提供 API 接口,可以处理大规模日志数据,比如 Nginx、Tomcat、系统日志、java日志等功能。
Kibana:Kibana 为 elasticsearch 提供一个查看数据的 web 界面,其主要是通过 elasticsearch 的 API 接口进行数据查找,并进行前端数据可视化的展现,另外还可以针对特定格式的数据生成相应的表格、柱状图、饼图等。
Logstash:Logstash 是一个具有实时传输能力的数据收集引擎,其可以通过插件实现日志收集和转发,支持日志过滤,支持普通 log、自定义 json 格式的日志解析,其可以接收来自不同来源的数据并统一输出到指定的且可以是多个不同目的地。比如:把经过处理的日志发送给 elasticsearch。可以实现rsyslog日志收集,tcp/udp日志收集。
Filebeat:Filebeat 是轻量级单用途的日志收集工具,用于在没有安装 java 的服务器上专门收集日志文件的日志数据,可以将日志转发到 logstash、elasticsearch 或 redis 及 kafka 等场景中进行下一步处理。logstash以来jdk环境,需要消耗500多兆内存,而filebeat不需要jdk环境,只需要十几兆内存。
Redis(Remote Dictionary Server ),即远程字典服务,是一个开源的使用ANSI C语言编写、支持网络、可基于内存亦可持久化的日志型、Key-Value数据库,并提供多种语言的API。这里用作日志缓存。防止很多web服务一下子都向elasticsearch提交日志将elasticsearch的网络资源消耗殆尽。
kafka:Kafka 被称为下一代分布式消息系统,由 scala 和 Java 编写。Kafka用于构建实时数据管道和流应用程序。 它具有水平可伸缩性,容错性,快速性。kafka 通过 O(1)的磁盘数据结构提供消息的持久化,这种结构对于即使数以 TB 的消息存储也能够保持长时间的稳定性能、高吞吐量:即使是非常普通的硬件 Kafka 也可以支持每秒数百万的消息、支持通过 Kafka 服务器分区消息。这里也是用作日志缓存。
nginx:Nginx是一款轻量级的高性能Web 服务器、反向代理服务器、电子邮件(IMAP/POP3)代理服务器。其特点是占有内存少,并发能力强,事实上nginx的并发能力在同类型的网页服务器中表现较好。一般用作处理.jpg,.html,.js,.css等静态文件,单台并发可达到几万(3w-5w的样子)。
tomcat:企业级web应用(java)服务器,Tomcat 服务器是一个免费的开放源代码的Web 应用服务器,属于轻量级应用服务器,在中小型系统和并发访问用户不是很多的场合下被普遍使用,是开发和调试JSP 程序的首选。Tomcat具有处理HTML页面的功能,另外它还是一个Servlet和JSP容器。不过,Tomcat处理静态HTML的能力不如Apache服务器。一般用作处理.jsp等动态文件。单台并发几百(200-400的样子)
mysql:MySQL是一个关系型数据库管理系统,由瑞典MySQL AB 公司开发,属于 Oracle 旗下产品。MySQL 是最流行的关系型数据库管理系统之一,在 WEB 应用方面,MySQL是最好的 RDBMS (Relational Database Management System,关系数据库管理系统) 应用软件之一。这里用来持久化日志保存重要数据,比如状态码、客户端 IP、客户端浏览器版本等等,用于后期按月做数据统计等。
部署环境:
centos8系统,最小化安装,已完成yum源,关闭防火墙firewalld,关闭selinux,时间同步等。此次实验使用elasticsearch、logstash、kibana、filebeat 均为7.12.1版本,在官网下载。
https://www.elastic.co/cn/downloads/past-releases
IP 主机名 服务
10.0.0.150 host1 elasticsearch、kibana、logstash(redis-to-elasticsearch)
10.0.0.160 host2 elasticsearch、kibana、redis/kafka
10.0.0.170 host3 elasticsearch、kibana、logstash(filebeat-to-redis)
10.0.0.180 host4 nginx,tomcat,filebeat
10.0.0.190 host5 keepalived haproxy
10.0.0.200 host6 mariadb
实施步骤:
1.#在150,160,170三台服务器搭建elasticsearch集群。
1.1#因为 elasticsearch 服务运行需要 java 环境,因此两台 elasticsearch 服务器需要安装 java 环境。Elasticsearch 与 JDK 版本对应关系: https://www.elastic.co/cn/support/matrix#matrix_jvm
[root@host1 ~]#yum install -y java-1.8.0-openjdk
1.2#修改elasticsearch服务配置文件
[root@host1 ~]#yum -y localinstall elasticsearch-7.12.1-x86_64.rpm
[root@host1 ~]#grep -v "^#" /etc/elasticsearch/elasticsearch.yml
cluster.name: elk-cluster #ELK 的集群名称,名称相同即属于是同一个集群
node.name: elk-node1 #当前节点在集群内的节点名称
path.data: /elk/data #ES 数据保存目录
path.logs: /elk/logs #ES 日志保存目
bootstrap.memory_lock: true #服务启动的时候锁定足够的内存,防止数据写入
network.host: 0.0.0.0 #监听 IP
http.port: 9200 #监听端口
discovery.seed_hosts: ["10.0.0.150", "10.0.0.160", "10.0.0.170"]
#集群中 node 节点发现列表
cluster.initial_master_nodes: ["10.0.0.150", "10.0.0.160", "10.0.0.170"]
#集群初始化那些节点可以被选举为 master
action.destructive_requires_name: true
#设置是否可以通过正则或者_all 删除或者关闭索引库,默认 true 表示必须需要显式指定索引库名称,生产环境建议设置为 true,删除索引库的时候必须指定,否则可能会误删索引库中的索引库。
1.3#修改内存限制,并同步配置文件
内存锁定的配置参数:https://discuss.elastic.co/t/memory-lock-not-working/70576
[root@host1 ~]#vim /usr/lib/systemd/system/elasticsearch.service
LimitMEMLOCK=infinity #添加此行,无限制使用内存
[root@host1 ~]#vim /etc/elasticsearch/jvm.options
-Xms2g
-Xmx2g
#官方配置文档最大建议 30G 以内
#打开文件限制,在文件最下面添加
root soft core unlimited
root hard core unlimited
root soft nproc 1000000
root hard nproc 1000000
root soft nofile 1000000
root hard nofile 1000000
root soft memlock 32000
root hard memlock 32000
root soft msgqueue 8192000
root hard msgqueue 8192000
elasticsearch soft core unlimited
elasticsearch hard core unlimited
elasticsearch soft nproc 1000000
elasticsearch hard nproc 1000000
elasticsearch soft nofile 1000000
elasticsearch hard nofile 1000000
elasticsearch soft memlock 32000
elasticsearch hard memlock 32000
elasticsearch soft msgqueue 8192000
elasticsearch hard msgqueue 8192000
#在host2,host3上一样安装elasticsearch后,将以上配置文件 scp 到 host2,host3 并修改自己的 node 名称
[root@host2 ~]#yum -y localinstall elasticsearch-7.12.1-x86_64.rpm
[root@host3 ~]#yum -y localinstall elasticsearch-7.12.1-x86_64.rpm
[root@host1 ~]#scp /etc/elasticsearch/elasticsearch.yml 10.0.0.160:/etc/elasticsearch/elasticsearch.yml
[root@host1 ~]#scp /etc/elasticsearch/elasticsearch.yml 10.0.0.170:/etc/elasticsearch/elasticsearch.yml
[root@host2 ~]#vim /etc/elasticsearch/elasticsearch.yml
node.name: elk-node2
[root@host3 ~]#vim /etc/elasticsearch/elasticsearch.yml
node.name: elk-node3
1.4#更改目录权限
各服务器创建数据和日志目录并修改目录权限为 elasticsearch
[root@host1 ~]#mkdir /elk/{data,logs} -p
[root@host1 ~]#chown elasticsearch.elasticsearch /elk/ -R
[root@host1 ~]#ll /elk/
total 0
drwxr-xr-x 2 elasticsearch elasticsearch 6 Sep 8 18:04 data
drwxr-xr-x 2 elasticsearch elasticsearch 6 Sep 8 18:04 logs
[root@host2 ~]#mkdir /elk/{data,logs} -p
[root@host2 ~]#chown elasticsearch.elasticsearch /elk/ -R
[root@host2 ~]#ll /elk/
total 0
drwxr-xr-x 2 elasticsearch elasticsearch 6 Sep 8 18:03 data
drwxr-xr-x 2 elasticsearch elasticsearch 6 Sep 8 18:03 logs
[root@host3 ~]#mkdir /elk/{data,logs} -p
[root@host3 ~]#chown elasticsearch.elasticsearch /elk/ -R
[root@host3 ~]#ll /elk/
total 0
drwxr-xr-x 2 elasticsearch elasticsearch 6 Sep 8 18:04 data
drwxr-xr-x 2 elasticsearch elasticsearch 6 Sep 8 18:04 logs
1.5#启动 elasticsearch 服务并验证
[root@host1 ~]#systemctl restart elasticsearch.service
[root@host1 ~]#systemctl enable elasticsearch.service
1.6#启动失败,查看/elk/logs/elk-cluster.log日志文件报错:memory locking requested for elasticsearch process but memory is not locked
#解决方法如下:
修改文件 /etc/systemd/system.conf ,分别修改以下内容。
DefaultLimitNOFILE=65536
DefaultLimitNPROC=32000
DefaultLimitMEMLOCK=infinity
#重启系统,启动es即可
1.7#启动成功,验证端口和网页访问。
[root@host1 ~]#ss -tnl
State Recv-Q Send-Q Local Address:Port Peer Address:Port
LISTEN 0 128 *:9200 #用户访问端口 *:*
LISTEN 0 128 *:9300 #集群内通信端口,比如master选举 *:*
#浏览器访问成功。
http://10.0.0.150:9200/
http://10.0.0.160:9200/
http://10.0.0.170:9200/
#浏览器返回结果如下:
{
"name" : "elk-node3",
"cluster_name" : "elk-cluster",
"cluster_uuid" : "CuWkkLLqQJ61oNMQ5i0Dpw",
"version" : {
"number" : "7.12.1",
"build_flavor" : "default",
"build_type" : "rpm",
"build_hash" : "3186837139b9c6b6d23c3200870651f10d3343b7",
"build_date" : "2021-04-20T20:56:39.040728659Z",
"build_snapshot" : false,
"lucene_version" : "8.8.0",
"minimum_wire_compatibility_version" : "6.8.0",
"minimum_index_compatibility_version" : "6.0.0-beta1"
},
"tagline" : "You Know, for Search"
}
1.8#为elasticsearch 安装图形化索引插件head
在elasticsearch 5.x 版本以后不再支持直接安装 head 插件,而是需要通过启动一个服务方式,git 地址:https://github.com/mobz/elasticsearch-head
#修改三台elasticsearch服务配置文件,开启跨域访问支持。
[root@host1 ~]#vim /etc/elasticsearch/elasticsearch.yml
[root@host1 ~]#systemctl restart elasticsearch.service
#安装5.x版本的head插件
#NPM 的全称是 Node Package Manager,是随同 NodeJS 一起安装的包管理和分发工具,它很方便让 JavaScript 开发者下载、安装、上传以及管理已经安装的包。
[root@host1 ~]#yum install -y npm git
[root@host1 ~]#cd /usr/local/src/
[root@host1 src]#git clone https://github.com/mobz/elasticsearch-head.git
Cloning into 'elasticsearch-head'...
remote: Enumerating objects: 4377, done.
remote: Counting objects: 100% (40/40), done.
remote: Compressing objects: 100% (27/27), done.
remote: Total 4377 (delta 12), reused 34 (delta 12), pack-reused 4337
Receiving objects: 100% (4377/4377), 2.54 MiB | 667.00 KiB/s, done.
Resolving deltas: 100% (2429/2429), done.
[root@host1 src]#cd elasticsearch-head/
[root@host1 elasticsearch-head]#npm install grunt -save
[root@host1 elasticsearch-head]#ll node_modules/grunt
[root@host1 elasticsearch-head]#npm install
[root@host1 elasticsearch-head]#npm run start&
#或者使用docker 版本启动 head 插件:
[root@linux-host1 ~]#yum install docker -y
[root@linux-host1 ~]#systemctl start docker && systemctl enable docker
[root@linux-host1 ~]#docker run -d -p 9100:9100 mobz/elasticsearch-head:5-alpine
2.#在10.0.0.150上安装logstash,复用主机,也可以新机器单独安装
logstash依赖jdk环境,此节点已经安装
[root@host1 ~]#yum localinstall logstash-7.12.1-x86_64.rpm -y
3.#在10.0.0.160上安装redis,复用主机,也可以新机器单独安装
[root@host2 ~]#yum install -y redis
[root@host2 ~]#vim /etc/redis.conf
bind 0.0.0.0 修改监听地址
requirepass 123456 设置redis账户密码
[root@host2 ~]#systemctl enable --now redis
[root@host2 ~]#systemctl is-active redis
active
[root@host2 ~]#ss -tnl
State Recv-Q Send-Q Local Address:Port Peer Address:Port
LISTEN 0 128 0.0.0.0:6379 0.0.0.0:*
4.#在10.0.0.180上安装nginx,tomcat,filebeat
#yum安装nginx
[root@host4 ~]#yum install -y nginx
#修改日志为json格式
vi /etc/nginx/nginx.conf
log_format jsonlog '{"@timestamp":"$time_iso8601",'
'"host":"$server_addr",'
'"clientip":"$remote_addr",'
'"size":$body_bytes_sent,'
'"responsetime":$request_time,'
'"upstreamtime":"$upstream_response_time",'
'"upstreamhost":"$upstream_addr",'
'"http_host":"$host",'
'"url":"$uri",'
'"domain":"$host",'
'"xff":"$http_x_forwarded_for",'
'"referer":"$http_referer",'
'"status":"$status"}';
access_log /var/log/nginx/access.log jsonlog;
[root@host4 ~]#systemctl enable --now nginx
Created symlink /etc/systemd/system/multi-user.target.wants/nginx.service → /usr/lib/systemd/system/nginx.service.
#验证日志格式
[root@host4 ~]#curl localhost
[root@host4 ~]#cat /var/log/nginx/access.log
{"@timestamp":"2022-09-08T20:11:38+08:00","host":"::1","clientip":"::1","size":4057,"responsetime":0.000,"upstreamtime":"-","upstreamhost":"-","http_host":"localhost","url":"/index.html","domain":"localhost","xff":"-","referer":"-","status":"200"}
#包安装tomcat
[root@host4 ~]#ls jdk-8u212-linux-x64.tar.gz apache-tomcat-8.5.82.tar.gz
apache-tomcat-8.5.82.tar.gz jdk-8u212-linux-x64.tar.gz
[root@host4 ~]#cat tomcatinstall.sh
#!/bin/bash
#================================================================
# Copyright (C) 2022 IEucd Inc. All rights reserved.
#
# 文件名称:tomcatinstall.sh
# 创 建 者:TanLiang
# 创建日期:2022年09月08日
# 描 述:This is a test file
#
#================================================================
. /etc/init.d/functions
DIR=`pwd`
JDK_FILE="jdk-8u212-linux-x64.tar.gz"
TOMCAT_FILE="apache-tomcat-8.5.82.tar.gz"
JDK_DIR="/usr/local"
TOMCAT_DIR="/usr/local"
install_jdk(){
if ! [ -f "$DIR/$JDK_FILE" ];then
action "$JDK_FILE 文件不存在" false
exit;
else
[ -d "$JDK_DIR" ] || mkdir -pv $JDK_DIR
fi
tar xvf $DIR/$JDK_FILE -C $JDK_DIR
cd $JDK_DIR && ln -s jdk1.8.* jdk
cat > /etc/profile.d/jdk.sh <<EOF
export JAVA_HOME=$JDK_DIR/jdk
export JRE_HOME=\$JAVA_HOME/jre
export CLASSPATH=\$JAVA_HOME/lib/:\$JRE_HOME/lib/
export PATH=\$PATH:\$JAVA_HOME/bin
EOF
. /etc/profile.d/jdk.sh
java -version && action "JDK 安装完成" || { action "JDK 安装失败" false ; exit; }
}
install_tomcat(){
if ! [ -f "$DIR/$TOMCAT_FILE" ];then
action "$TOMCAT_FILE 文件不存在" false
exit;
elif [ -d $TOMCAT_DIR/tomcat ];then
action "TOMCAT 已经安装" false
exit
else
[ -d "$TOMCAT_DIR" ] || mkdir -pv $TOMCAT_DIR
fi
tar xf $DIR/$TOMCAT_FILE -C $TOMCAT_DIR
cd $TOMCAT_DIR && ln -s apache-tomcat-*/ tomcat
echo "PATH=$TOMCAT_DIR/tomcat/bin:"'$PATH' > /etc/profile.d/tomcat.sh
id tomcat &> /dev/null || useradd -r -s /sbin/nologin tomcat
cat > $TOMCAT_DIR/tomcat/conf/tomcat.conf <<EOF
JAVA_HOME=$JDK_DIR/jdk
EOF
chown -R tomcat.tomcat $TOMCAT_DIR/tomcat/
cat > /lib/systemd/system/tomcat.service <<EOF
[Unit]
Description=Tomcat
#After=syslog.target network.target remote-fs.target nss-lookup.target
After=syslog.target network.target
[Service]
Type=forking
EnvironmentFile=$TOMCAT_DIR/tomcat/conf/tomcat.conf
ExecStart=$TOMCAT_DIR/tomcat/bin/startup.sh
ExecStop=$TOMCAT_DIR/tomcat/bin/shutdown.sh
RestartSec=3
PrivateTmp=true
User=tomcat
Group=tomcat
[Install]
WantedBy=multi-user.target
EOF
systemctl daemon-reload
systemctl enable --now tomcat.service
systemctl is-active tomcat.service &> /dev/null && action "TOMCAT 安装完成" || {
action "TOMCAT 安装失败" false ; exit; }
}
install_jdk
install_tomcat
[root@host4 ~]#bash tomcatinstall.sh
JDK 安装完成 [ OK ]
Created symlink /etc/systemd/system/multi-user.target.wants/tomcat.service → /usr/lib/systemd/system/tomcat.service.
TOMCAT 安装完成 [ OK ]
#修改tomcat日志格式为json
[root@host4 ~]#vim /usr/local/tomcat/conf/server.xml
<Valve className="org.apache.catalina.valves.AccessLogValve" directory="logs"
prefix="localhost_access_log" suffix=".txt"
pattern="{"client":"%h", "client user":"%l", "authenticated":"%u", "access time":"%t", "method":"%r", "status":"%s", "send bytes":"%b", "Query?string":"%q", "partner":"%{Referer}i", "Agent version":"%{User-Agent}i"}"/>
</Host>
</Engine>
</Service>
</Server>
#验证日志格式
[root@host4 ~]#systemctl restart tomcat
[root@host4 ~]#curl localhost:8080
[root@host4 ~]#cat /usr/local/tomcat/logs/localhost_access_log.2022-09-08.txt
0:0:0:0:0:0:0:1 - - [08/Sep/2022:20:15:37 +0800] "GET / HTTP/1.1" 200 11230
{"client":"0:0:0:0:0:0:0:1", "client user":"-", "authenticated":"-", "access time":"[08/Sep/2022:20:16:34 +0800]", "method":"GET / HTTP/1.1", "status":"200", "send bytes":"11230", "Query?string":"", "partner":"-", "Agent version":"curl/7.61.1"}
#安装filebeat
[root@host4 ~]#yum -y localinstall filebeat-7.12.1-x86_64.rpm
5.#配置filebeat收集tomcat,nginx日志
https://www.elastic.co/guide/en/beats/filebeat/7.12/command-line-options.html
[root@host4 ~]#vim /etc/filebeat/filebeat.yml
[root@host4 ~]#grep -v "#" /etc/filebeat/filebeat.yml |grep -v "^$"
filebeat.inputs:
- type: log
enabled: true
paths:
- /var/log/nginx/access.log
fields:
type: nginx-log-10.0.0.180
- type: log
enabled: true
paths:
- /usr/local/tomcat/logs/localhost_access_log.*.txt
fields:
type: tomcat-log-10.0.0.180
filebeat.config.modules:
path: ${path.config}/modules.d/*.yml
reload.enabled: false
setup.template.settings:
index.number_of_shards: 1
setup.kibana:
output.redis:
hosts: ["10.0.0.160"]
password: "123456"
key: "filebeat-nginx-tomcat-log"
db: 1
timeout: 5
processors:
- add_host_metadata:
when.not.contains.tags: forwarded
- add_cloud_metadata: ~
- add_docker_metadata: ~
- add_kubernetes_metadata: ~
#重启filebeat服务
[root@host4 ~]#systemctl restart filebeat
6.#访问网页来生成新的日志
[root@host4 ~]#curl localhost
[root@host4 ~]#curl localhost:8080
#或者浏览器访问http://10.0.0.180、http://10.0.0.180:8080
[root@host4 ~]#tail -n 1 /var/log/nginx/access.log
{"@timestamp":"2022-09-08T20:19:54+08:00","host":"10.0.0.180","clientip":"10.0.0.1","size":3971,"responsetime":0.000,"upstreamtime":"-","upstreamhost":"-","http_host":"10.0.0.180","url":"/404.html","domain":"10.0.0.180","xff":"-","referer":"http://10.0.0.180/","status":"404"}
[root@host4 ~]#echo 1 >> /var/log/nginx/access.log
[root@host4 ~]#tail -n 1 /usr/local/tomcat/logs/localhost_access_log.2022-09-08.txt
{"client":"10.0.0.1", "client user":"-", "authenticated":"-", "access time":"[08/Sep/2022:20:19:48 +0800]", "method":"GET /favicon.ico HTTP/1.1", "status":"200", "send bytes":"21630", "Query?string":"", "partner":"http://10.0.0.180:8080/", "Agent version":"Mozilla/5.0 (Windows NT 10.0; WOW64) AppleWebKit/537.36 (KHTML, like Gecko) Chrome/103.0.0.0 Safari/537.36"}
[root@host4 ~]#echo 1 >> /usr/local/tomcat/logs/localhost_access_log.2022-09-08.txt
7.#在logstash服务器将redis的日志分类,并且发送给elasticsearch
[root@host2 ~]#redis-cli -a 123456 -h 10.0.0.160
10.0.0.160:6379[1]> keys *
1) "filebeat-nginx-tomcat-log"
10.0.0.160:6379[1]> RPOP filebeat-nginx-tomcat-log
"{\"@timestamp\":\"2022-09-08T13:26:53.783Z\",\"@metadata\":{\"beat\":\"filebeat\",\"type\":\"_doc\",\"version\":\"7.12.1\"},\"ecs\":{\"version\":\"1.8.0\"},\"host\":{\"id\":\"767ca5035eba4c17b446ce8754639b2e\",\"name\":\"host4.tan.com\",\"containerized\":false,\"ip\":[\"10.0.0.180\",\"fe80::20c:29ff:fe98:bc23\",\"192.168.122.1\"],\"mac\":[\"00:0c:29:98:bc:23\",\"52:54:00:46:bf:71\",\"52:54:00:46:bf:71\"],\"hostname\":\"host4.tan.com\",\"architecture\":\"x86_64\",\"os\":{\"family\":\"redhat\",\"name\":\"CentOS Linux\",\"kernel\":\"4.18.0-240.el8.x86_64\",\"type\":\"linux\",\"platform\":\"centos\",\"version\":\"8\"}},\"agent\":{\"hostname\":\"host4.tan.com\",\"ephemeral_id\":\"a2993962-36e5-4f2d-af82-49b09f9a802a\",\"id\":\"57ebdb20-ddbd-447d-a690-a874a2549b4c\",\"name\":\"host4.tan.com\",\"type\":\"filebeat\",\"version\":\"7.12.1\"},\"log\":{\"offset\":70602,\"file\":{\"path\":\"/usr/local/tomcat/logs/localhost_access_log.2022-09-08.txt\"}},\"message\":\"{\\\"client\\\":\\\"0:0:0:0:0:0:0:1\\\", \\\"client user\\\":\\\"-\\\", \\\"authenticated\\\":\\\"-\\\", \\\"access time\\\":\\\"[08/Sep/2022:20:29:11 +0800]\\\", \\\"method\\\":\\\"GET / HTTP/1.1\\\", \\\"status\\\":\\\"200\\\", \\\"send bytes\\\":\\\"11230\\\", \\\"Query?string\\\":\\\"\\\", \\\"partner\\\":\\\"-\\\", \\\"Agent version\\\":\\\"curl/7.61.1\\\"}\",\"fields\":{\"type\":\"tomcat-log-10.0.0.180\"},\"input\":{\"type\":\"log\"}}"
[root@host1 ~]#cat /etc/logstash/conf.d/redis-to-elasticsearsh.conf
input {
redis {
data_type => "list"
key => "filebeat-nginx-tomcat-log"
host => "10.0.0.160" #redis数据库地址,不能写错
port => "6379"
db => "1"
password => "123456"
}
}
output {
if [fields][type] == "nginx-log-10.0.0.180" {
elasticsearch {
hosts => ["10.0.0.160:9200"] #在head组件查看,160这台带星号是主节点
index => "filebeat-nginx-log-%{+YYYY.MM.dd}"
}}
if [fields][type] == "tomcat-log-10.0.0.180" {
elasticsearch {
hosts => ["10.0.0.160:9200"] #在head组件查看,160这台带星号是主节点
index => "filebeat-tomcat-log-%{+YYYY.MM.dd}"
}}
}
[root@host1 ~]#/usr/share/logstash/bin/logstash -f /etc/logstash/conf.d/redis-to-elasticsearsh.conf -t
[INFO ] 2022-09-08 22:20:27.387 [LogStash::Runner] runner - Using config.test_and_exit mode. Config Validation Result: OK. Exiting Logstash
[root@host1 ~]#systemctl restart logstash.service
8.#安装kibana
[root@host1 ~]#yum localinstall -y kibana-7.12.1-x86_64.rpm
[root@host1 ~]#grep -v "#" /etc/kibana/kibana.yml |grep -v "^$"
server.port: 5601
server.host: "0.0.0.0"
elasticsearch.hosts: ["http://10.0.0.150:9200"]
i18n.locale: "zh-CN"
[root@host1 ~]#systemctl enable --now kibana
Synchronizing state of kibana.service with SysV service script with /usr/lib/systemd/systemd-sysv-install.
Executing: /usr/lib/systemd/systemd-sysv-install enable kibana
Created symlink /etc/systemd/system/multi-user.target.wants/kibana.service → /etc/systemd/system/kibana.service.
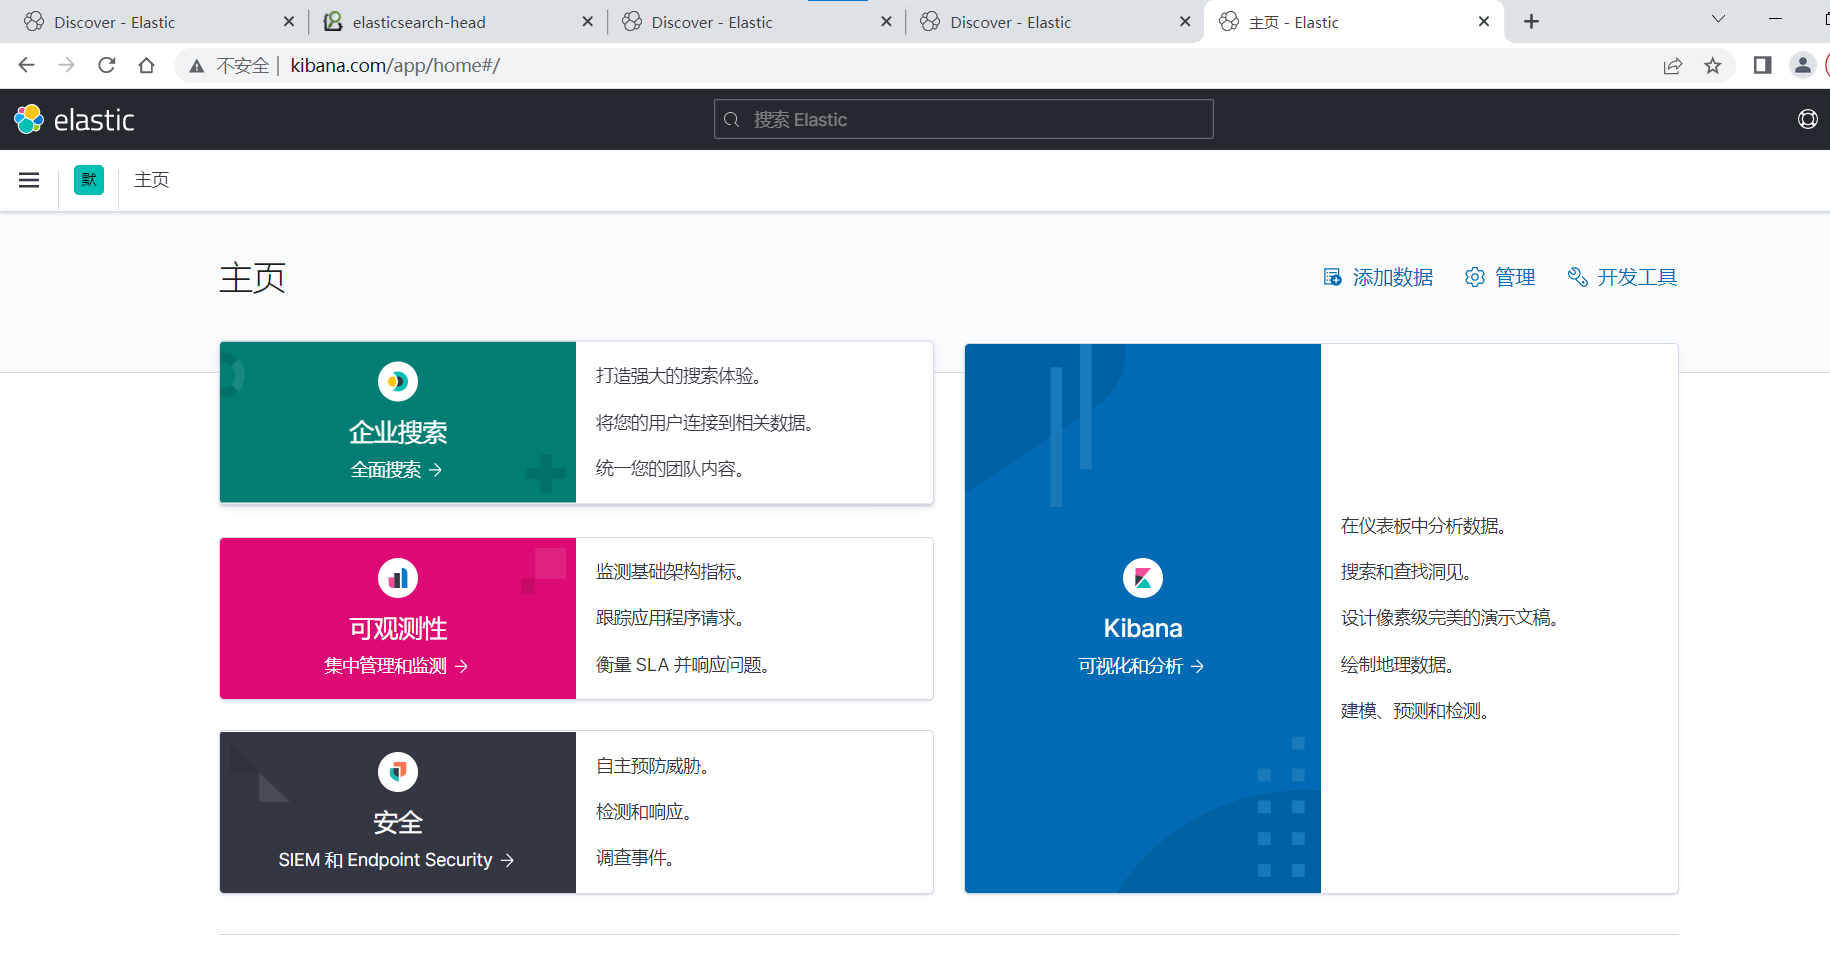
#访问http://10.0.0.150:5601
点击左上角“三”点开菜单,选择“overview”,单击"添加您的数据",单击“创建索引模式”,索引模式名称“filebeat-nginx-log-*”,下一步,时间字段“@timestamp”,创建索引模式。
点击左上角“三”点开菜单,management--stack management--kibana--索引模式--单击“创建索引模式”,索引模式名称“filebeat-nginx-log-*”,下一步,时间字段“@timestamp”,创建索引模式。
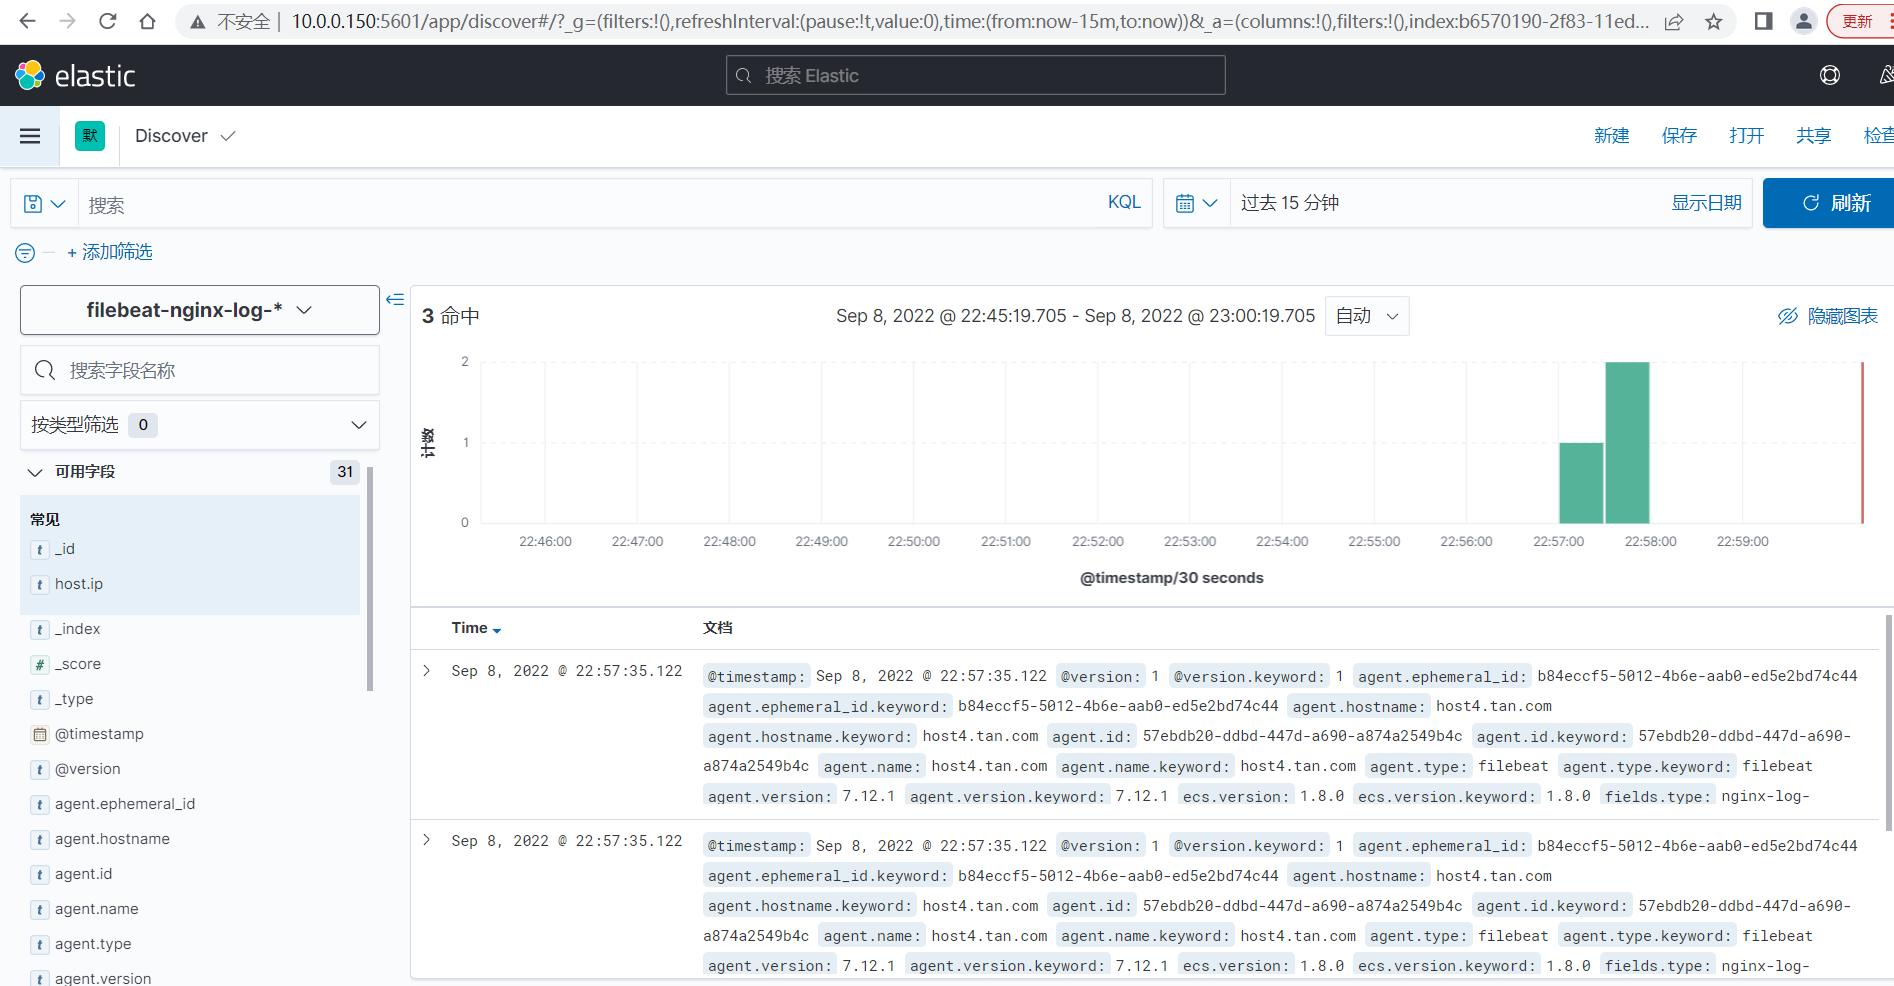
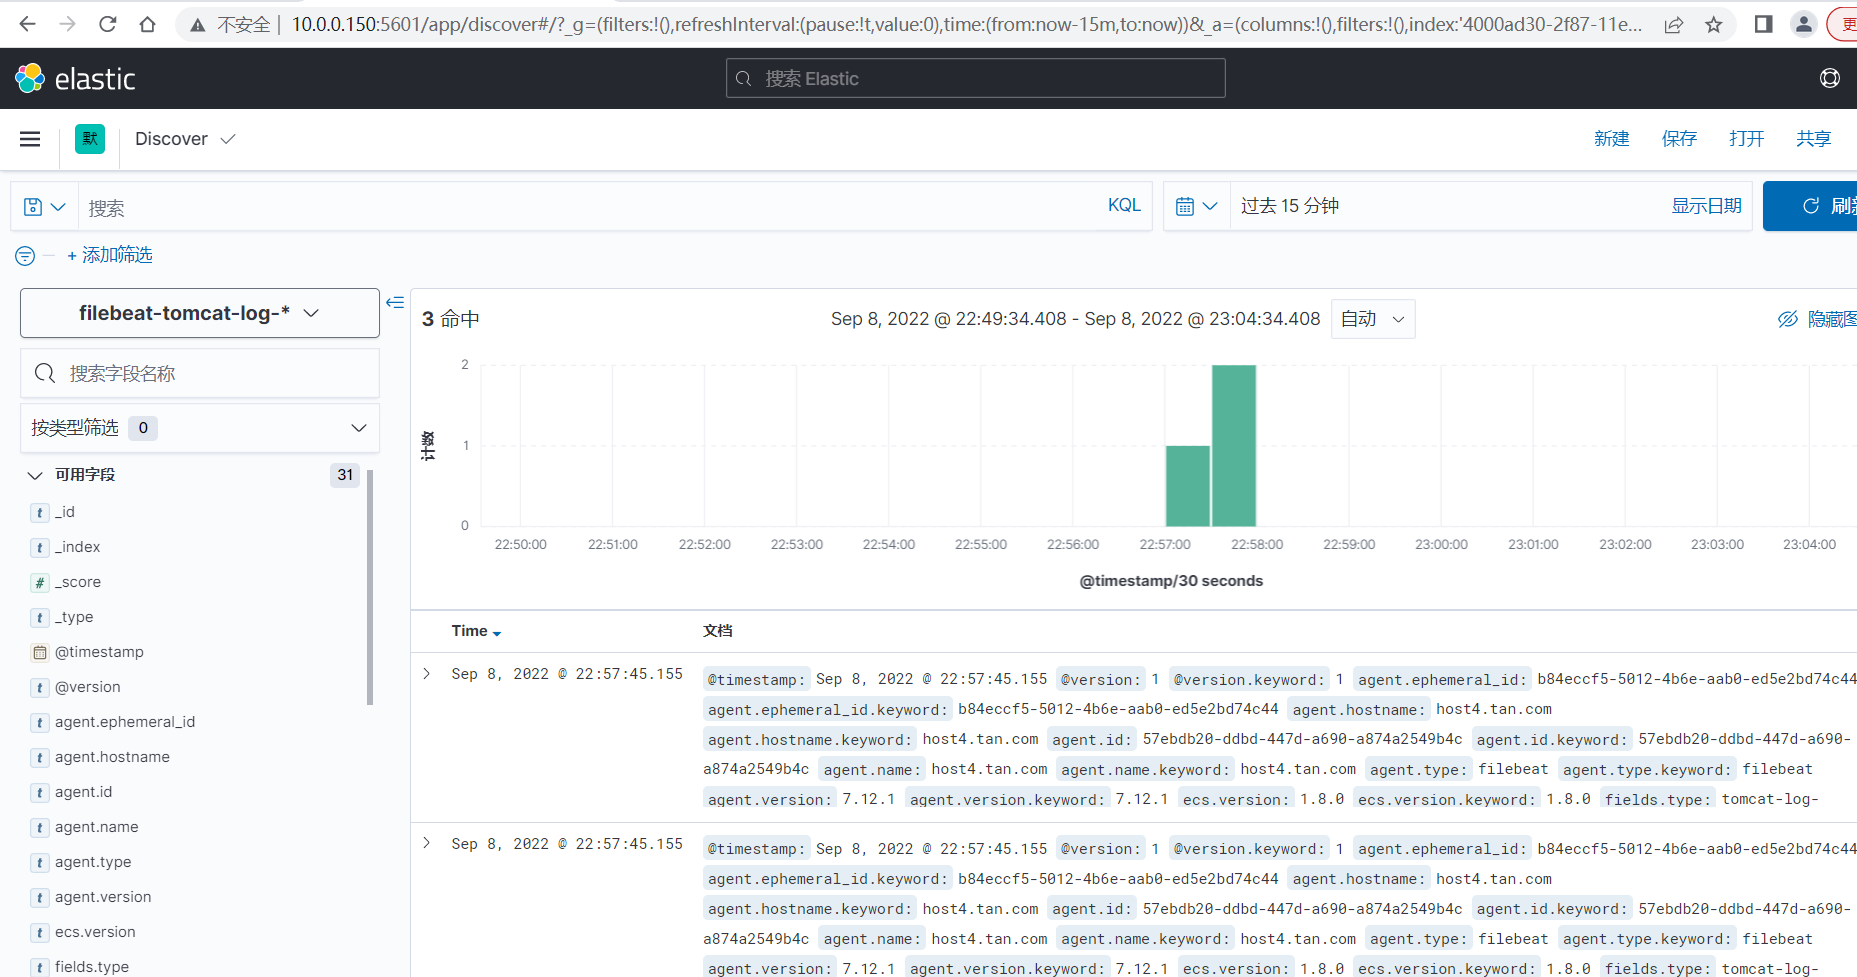
点击左上角“三”点开菜单,analytics--discover,来查看创建的索引,查看数据。
9.#查看数据
10.#在host3安装logstash,用于日志转发,将beat收集的日志分别存储在不同的redis的key中。
[root@host3 ~]#yum localinstall logstash-7.12.1-x86_64.rpm
#10.1.结合logstash进行输出测试:
[root@host3 ~]#cat /etc/logstash/conf.d/beats.conf
input {
beats {
port => 5044
}
}
output {
file {
path => "/tmp/filebeat.txt"
}
}
#语法测试
[root@host3 ~]#/usr/share/logstash/bin/logstash -f /etc/logstash/conf.d/beats.conf -t
#启动logstash
[root@host3 ~]#systemctl restart logstash
#更改web服务器的filebeat配置
[root@host4 ~]#grep -v "#" /etc/filebeat/filebeat.yml |grep -v "^$"
filebeat.inputs:
- type: log
enabled: true
paths:
- /var/log/nginx/access.log
fields:
type: nginx-log-10.0.0.180
- type: log
enabled: true
paths:
- /usr/local/tomcat/logs/localhost_access_log.*.txt
fields:
type: tomcat-log-10.0.0.180
filebeat.config.modules:
path: ${path.config}/modules.d/*.yml
reload.enabled: false
setup.template.settings:
index.number_of_shards: 1
setup.kibana:
output.logstash:
hosts: ["10.0.0.170:5044"]
enabled: true
worker: 1
compression_level: 3
processors:
- add_host_metadata:
when.not.contains.tags: forwarded
- add_cloud_metadata: ~
- add_docker_metadata: ~
- add_kubernetes_metadata: ~
#重启filebeat并验证状态
[root@host4 ~]#systemctl restart filebeat.service
[root@host4 ~]#systemctl is-active filebeat.service
active
#手动追加内容到日志文件,出发收集
[root@host4 ~]#echo 1111111111111111111111111111111 >> /var/log/nginx/access.log
[root@host4 ~]#echo 1111111111111111111111111111111 >> /usr/local/tomcat/logs/localhost_access_log.2022-09-12.txt
#在logstash服务器验证是否输出至指定文件:
[root@host3 ~]#cat /tmp/filebeat.txt
{"@version":"1","@timestamp":"2022-09-12T02:59:35.649Z","agent":{"version":"7.12.1","name":"host4.tan.com","id":"57ebdb20-ddbd-447d-a690-a874a2549b4c","ephemeral_id":"a0d72e7a-0b78-4377-b70c-800c81d964a1","type":"filebeat","hostname":"host4.tan.com"},"tags":["nginx-accesslog","beats_input_codec_plain_applied"],"host":{"ip":["10.0.0.180","fe80::20c:29ff:fe98:bc23","192.168.122.1"],"mac":["00:0c:29:98:bc:23","52:54:00:46:bf:71","52:54:00:46:bf:71"],"name":"host4.tan.com","id":"767ca5035eba4c17b446ce8754639b2e","containerized":false,"os":{"platform":"centos","version":"8","name":"CentOS Linux","family":"redhat","kernel":"4.18.0-240.el8.x86_64","type":"linux"},"hostname":"host4.tan.com","architecture":"x86_64"},"message":"1111111111111111111111111111111","log":{"file":{"path":"/var/log/nginx/access.log"},"offset":16354},"ecs":{"version":"1.8.0"}}
{"@version":"1","@timestamp":"2022-09-12T03:00:05.653Z","agent":{"version":"7.12.1","name":"host4.tan.com","id":"57ebdb20-ddbd-447d-a690-a874a2549b4c","ephemeral_id":"a0d72e7a-0b78-4377-b70c-800c81d964a1","type":"filebeat","hostname":"host4.tan.com"},"tags":["tomcat-accesslog","beats_input_codec_plain_applied"],"host":{"ip":["10.0.0.180","fe80::20c:29ff:fe98:bc23","192.168.122.1"],"mac":["00:0c:29:98:bc:23","52:54:00:46:bf:71","52:54:00:46:bf:71"],"name":"host4.tan.com","id":"767ca5035eba4c17b446ce8754639b2e","containerized":false,"os":{"platform":"centos","version":"8","name":"CentOS Linux","family":"redhat","kernel":"4.18.0-240.el8.x86_64","type":"linux"},"hostname":"host4.tan.com","architecture":"x86_64"},"message":"1111111111111111111111111111111","log":{"file":{"path":"/usr/local/tomcat/logs/localhost_access_log.2022-09-12.txt"},"offset":0},"ecs":{"version":"1.8.0"}}
#修改host3上的logstash配置
[root@host3 ~]#cat /etc/logstash/conf.d/beats.conf
input {
beats {
port => 5044
}
}
output {
if [fields][type] == "nginx-log-10.0.0.180" {
redis {
host => "10.0.0.160"
port => 6379
db => 2
password => "123456"
data_type => "list"
key => "nginx-log-180"
codec => "json"
}
}
if [fields][type] == "tomcat-log-10.0.0.180" {
redis {
host => "10.0.0.160"
port => 6379
db => 3
password => "123456"
data_type => "list"
key => "tomcat-log-180"
codec => "json"
}
}
}
#[root@host2 ~]#redis-cli -a 123456 -h 10.0.0.160
10.0.0.160:6379[1]> select 2
OK
10.0.0.160:6379[2]> keys *
1) "nginx-log-180"
10.0.0.160:6379[2]> select 3
OK
10.0.0.160:6379[3]> keys *
1) "tomcat-log-180"
#修改redis到elasticsearch的logstash。并重启host1的logstash
[root@host1 ~]#cat /etc/logstash/conf.d/redis-to-elasticsearsh.conf
[root@host1 ~]#cat /etc/logstash/conf.d/redis-to-elasticsearsh.conf
input {
redis {
data_type => "list"
key => "nginx-log-180"
host => "10.0.0.160"
port => "6379"
db => "2"
password => "123456"
}
redis {
data_type => "list"
key => "tomcat-log-180"
host => "10.0.0.160"
port => "6379"
db => "3"
password => "123456"
}
}
output {
if [fields][type] == "nginx-log-10.0.0.180" {
elasticsearch {
hosts => ["10.0.0.150:9200"]
index => "nginx-log-%{+YYYY.MM.dd}"
}}
if [fields][type] == "tomcat-log-10.0.0.180" {
elasticsearch {
hosts => ["10.0.0.150:9200"]
index => "tomcat-log-%{+YYYY.MM.dd}"
}}
}
[root@host1 ~]#systemctl restart logstash.service
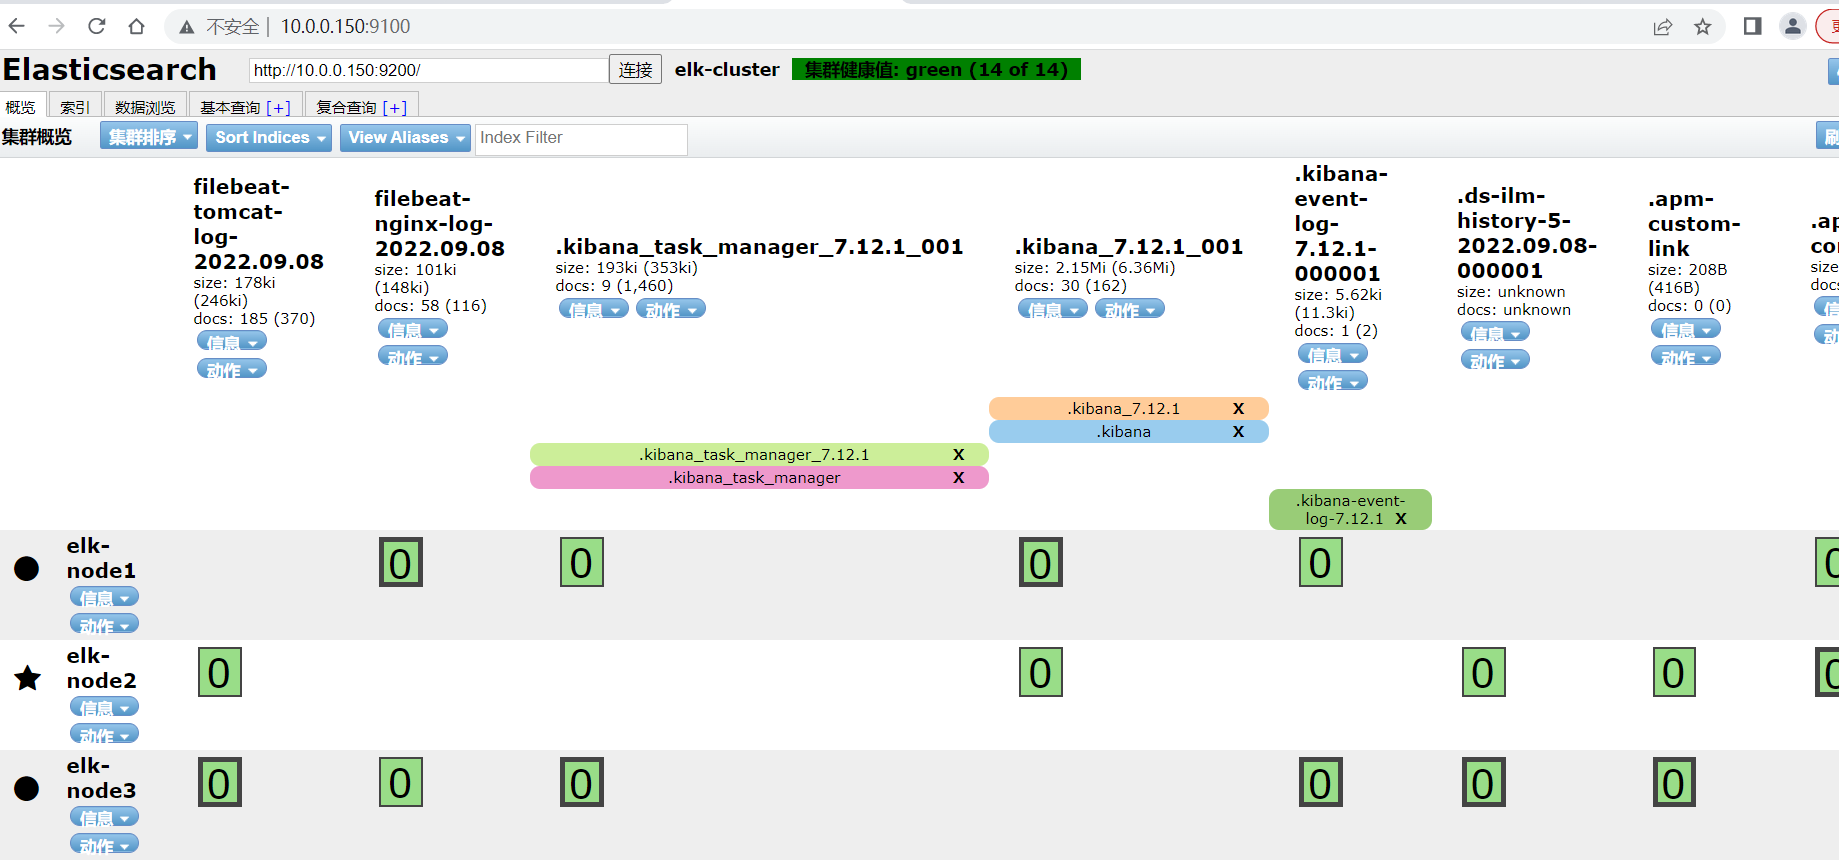
#在http://10.0.0.150:9100/验证成功,出现tomcat-log-2022.09.12和nginx-log-2022.09.12索引。
11.#实现高可用和登录kibana验证
通过haproxy代理kibana:三台都安装keepalived nginx kibana。步骤用于,只写一遍。
[root@host5 ~]#yum install -y keepalived haproxy
[root@host5 ~]#echo "net.ipv4.ip_nonlocal_bind = 1" >> /etc/sysctl.conf
#因host1已经安装kibana,host2,host3需要安装
[root@host2 ~]#yum localinstall kibana-7.12.1-x86_64.rpm -y
[root@host2 ~]#grep "^[a-Z]" /etc/kibana/kibana.yml
server.host: "10.0.0.160" #只需要改监听地址为自己的ip
[root@host2 ~]#systemctl enable --now kibana.service
#配置keepalived
[root@host5 ~]#cat /etc/keepalived/keepalived.conf
! Configuration File for keepalived
global_defs {
notification_email {
acassen@firewall.loc
failover@firewall.loc
sysadmin@firewall.loc
}
notification_email_from Alexandre.Cassen@firewall.loc
smtp_server 192.168.200.1
smtp_connect_timeout 30
router_id LVS_DEVEL
vrrp_skip_check_adv_addr
vrrp_strict
vrrp_garp_interval 0
vrrp_gna_interval 0
}
vrrp_instance VI_1 {
state MASTER
interface eth0
virtual_router_id 51
priority 100
advert_int 1
authentication {
auth_type PASS
auth_pass 1111
}
virtual_ipaddress {
10.0.0.188/24 dev eth0 label eth0:1
}
}
#配置haproxy
[root@host5 ~]#cat /etc/haproxy/haproxy.cfg
listen stats
mode http
bind 0.0.0.0:9999
stats enable
log global
stats uri /haproxy-status
stats auth haadmin:123456
listen es-9200
mode tcp
bind 10.0.0.188:9200
balance roundrobin
server 10.0.0.150 10.0.0.150:9200 check inter 3s fall 3 rise 5
server 10.0.0.160 10.0.0.160:9200 check inter 3s fall 3 rise 5
server 10.0.0.170 10.0.0.170:9200 check inter 3s fall 3 rise 5
#因配置了haproxy代理es的9200端口,因此logstash上可以配置输出到elasticsearch的地址为vip的地址。
listen kibana-80
mode tcp
bind 10.0.0.188:80
balance roundrobin
server 10.0.0.150 10.0.0.150:80 check inter 3s fall 3 rise 5
server 10.0.0.160 10.0.0.160:80 check inter 3s fall 3 rise 5
server 10.0.0.170 10.0.0.170:80 check inter 3s fall 3 rise 5
#启动服务
[root@host5 ~]#systemctl restart keepalived.service
[root@host5 ~]#systemctl restart haproxy.service
#配置host1,host2,host3上的nginx,nginx都代理自己的kibana。先都yum安装nginx
[root@host1 ~]#yum install -y nginx
[root@host1 ~]#vim /etc/nginx/conf.d/kibana.conf
[root@host1 ~]#cat /etc/nginx/conf.d/kibana.conf
upstream kibana_server {
server 10.0.0.150:5601 weight=1 max_fails=3 fail_timeout=60;
}
server {
listen 80;
server_name www.kibana.com;
auth_basic "Restricted Access";
auth_basic_user_file /etc/nginx/conf.d/htpasswd.user;
location / {
proxy_pass http://kibana_server;
proxy_http_version 1.1;
proxy_set_header Upgrade $http_upgrade;
proxy_set_header Connection 'upgrade';
proxy_set_header Host $host;
proxy_cache_bypass $http_upgrade;
}
}
[root@host1 ~]#scp /etc/nginx/conf.d/kibana.conf 10.0.0.160:/etc/nginx/conf.d/kibana.conf
[root@host1 ~]#scp /etc/nginx/conf.d/kibana.conf 10.0.0.170:/etc/nginx/conf.d/kibana.conf
[root@host1 ~]#systemctl restart nginx
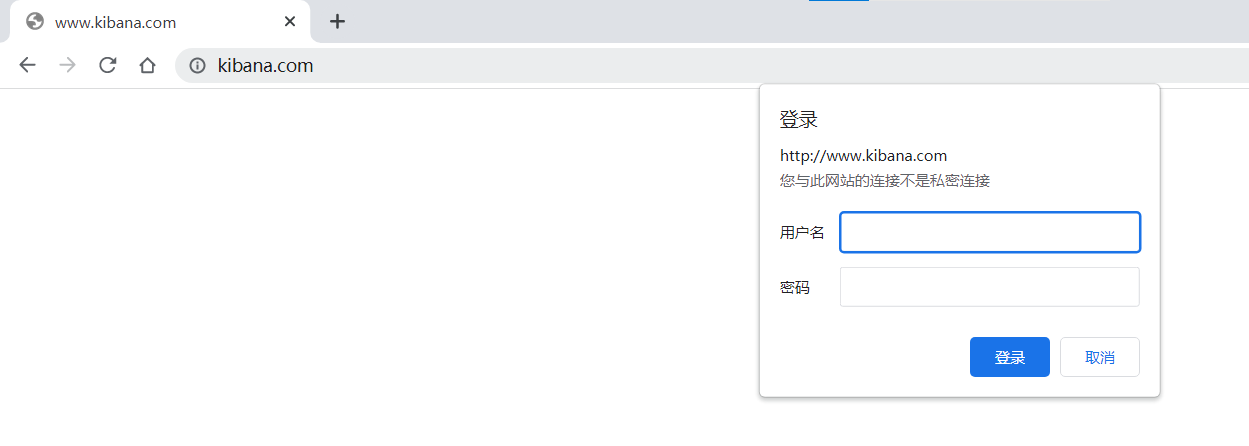
#三台nginx均配置登录验证,使访问keepalived的vip的请求通过haproxy转发到nginx,经过nginx的身份验证后转发到kibana。防止其他人随意登录操作kibana(kibana上可以直接删除索引,导致数据丢失)
[root@host1 ~]#htpasswd -bc /etc/nginx/conf.d/htpasswd.user tan 123456
Adding password for user tan
[root@host1 ~]#htpasswd -b /etc/nginx/conf.d/htpasswd.user liang 123456
Adding password for user liang
[root@host1 ~]#cat /etc/nginx/conf.d/htpasswd.user
tan:$apr1$Ez7YIzr9$HgL2WpQQYVHC.VSuGHmse/
liang:$apr1$h2lZnNcd$SlzPej6tJ/Y0F8A0ABr8x0
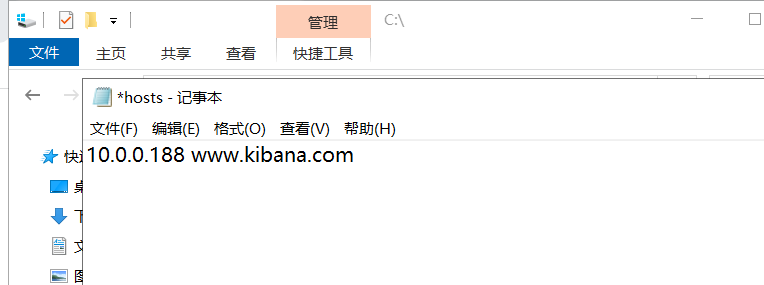
12#修改hosts解析,网页登录vip:10.0.0.188验证。
13.#日志写入数据库
########先参考下一章,完成“ELK实现使用地图显示用户所在城市”后再操作一下内容。否则没有filer配置,写入数据库的数据为null!!!########
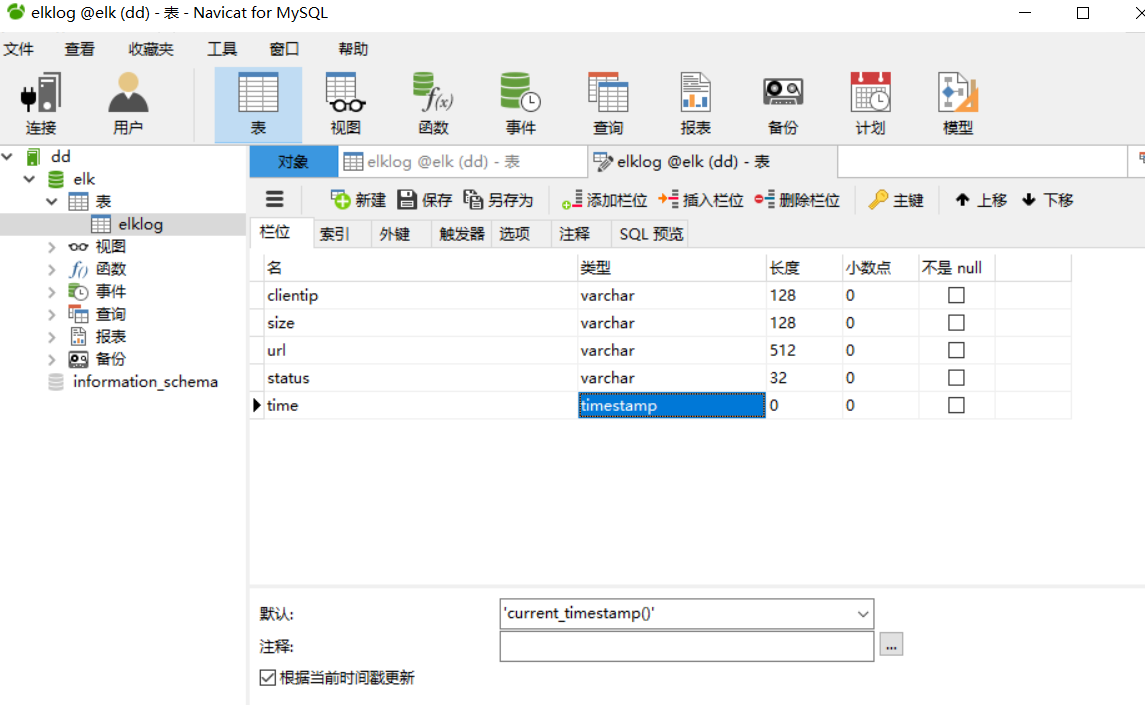
写入数据库的目的是用于持久化保存重要数据,比如状态码、客户端 IP、客户端浏览器版本等等,用于后期按月做数据统计等。
#安装数据库服务
[root@host6 ~]#yum install -y mariadb-server
[root@host6 ~]#systemctl restart mariadb

#授权用户登录
[root@host6 ~]#mysql
Welcome to the MariaDB monitor.  Commands end with ; or \g.
Your MariaDB connection id is 8
Server version: 10.3.28-MariaDB MariaDB Server

Copyright (c) 2000, 2018, Oracle, MariaDB Corporation Ab and others.

Type 'help;' or '\h' for help. Type '\c' to clear the current input statement.

MariaDB [(none)]> create database elk character set utf8 collate utf8_bin;
Query OK, 1 row affected (0.000 sec)

MariaDB [(none)]> grant all privileges on elk.* to elk@"%" identified by '123456';
Query OK, 0 rows affected (0.000 sec)

MariaDB [(none)]> flush privileges;
Query OK, 0 rows affected (0.000 sec)

#测试可以远程登录
[root@host1 ~]#mysql -uelk -p123456 -h10.0.0.200
Welcome to the MariaDB monitor.  Commands end with ; or \g.
Your MariaDB connection id is 9
Server version: 10.3.28-MariaDB MariaDB Server

Copyright (c) 2000, 2018, Oracle, MariaDB Corporation Ab and others.

Type 'help;' or '\h' for help. Type '\c' to clear the current input statement.

MariaDB [(none)]>

#logstash 配置 mysql-connector-java 包
MySQL Connector/J 是 MySQL 官方 JDBC 驱动程序, JDBC ( Java Data Base Connectivity,java 数据库连接)是一种用于执行 SQL 语句的 Java API,可以为多种关系数据库提供统一访问,它由一组用 Java 语言编写的类和接口组
https://dev.mysql.com/downloads/file/?id=477058
#目录一定不能写错了!!!
[root@host1 ~]#mkdir -pv /usr/share/logstash/vendor/jar/jdbc
[root@host1 ~]#cd /usr/share/logstash/vendor/jar/jdbc
[root@host1 ~]#wget https://repo1.maven.org/maven2/mysql/mysql-connector-java/8.0.16/mysql-connector-java-8.0.16.jar
[root@host1 ~]#chown logstash.logstash /usr/share/lostash/vendor/jar/jdbc -R

[root@host1 ~]#/usr/share/logstash/bin/logstash-plugin list|grep jdbc
logstash-integration-jdbc
 ├── logstash-input-jdbc
 ├── logstash-filter-jdbc_streaming
 └── logstash-filter-jdbc_static

[root@host1 ~]#/usr/share/logstash/bin/logstash-plugin install logstash-output-jdbc
Validating logstash-output-jdbc
Installing logstash-output-jdbc
Installation successful

#创建表结构
#配置logstash将日志写入数据库
[root@host1 ~]#cat /etc/logstash/conf.d/redis-to-elasticsearsh.conf
input {
  redis {
    data_type => "list"
    key => "nginx-log-180"
    host => "10.0.0.160"
    port => "6379"
    db => "2"
    password => "123456"
  }
  redis {
    data_type => "list"
    key => "tomcat-log-180"
    host => "10.0.0.160"
    port => "6379"
    db => "3"
    password => "123456"
  }

}

output {
  if [fields][type] == "nginx-log-10.0.0.180" {
    elasticsearch {
      hosts => ["10.0.0.150:9200"]
      index => "nginx-log-%{+YYYY.MM.dd}"
    }
  jdbc {
    connection_string => "jdbc:mysql://10.0.0.200/elk?user=elk&password=123456&useUnicode=true&characterEncoding=UTF8&autoReconnect=true&failOverReadOnly=false"
    statement => ["INSERT INTO elklog(clientip,size,url,status) VALUES(?,?,?,?)","clientip","size","url","status"]
  }
  }
  if [fields][type] == "tomcat-log-10.0.0.180" {
    elasticsearch {
      hosts => ["10.0.0.150:9200"]
      index => "tomcat-log-%{+YYYY.MM.dd}"
    }}
}

#语法检测并重启logstash
[root@host1 ~]#/usr/share/logstash/bin/logstash -f /etc/logstash/conf.d/redis-to-elasticsearsh.conf -t
[INFO ] 2022-09-12 15:38:43.475 [LogStash::Runner] runner - Using config.test_and_exit mode. Config Validation Result: OK. Exiting Logstash
[root@host1 ~]#systemctl restart logstash.service

#验证数据库是否写入数据
MariaDB [elk]> select * from elklog;
+----------+------+-------------+--------+---------------------+
| clientip | size | url | status | time |
+----------+------+-------------+--------+---------------------+
| 10.0.0.1 | 0 | /index.html | 304 | 2022-09-13 10:11:19 |
| 10.0.0.1 | 0 | /index.html | 304 | 2022-09-13 10:11:19 |
| 10.0.0.1 | 0 | /index.html | 304 | 2022-09-13 10:11:19 |
| 10.0.0.1 | 0 | /index.html | 304 | 2022-09-13 10:11:19 |
| 10.0.0.1 | 0 | /index.html | 304 | 2022-09-13 10:11:19 |
+----------+------+-------------+--------+---------------------+
8 rows in set (0.000 sec)

 浙公网安备 33010602011771号