爬取猫眼电影并数据绘图展示
爬取猫眼电影
import requests
import csv
from lxml import etree

url = 'https://maoyan.com/board/4'
headers = {
    'User-Agent': 'Mozilla/5.0 (Windows NT 10.0; Win64; x64) AppleWebKit/537.36 (KHTML, like Gecko) Chrome/79.0.3945.79 Safari/537.36'
}

def get_page(url):
    page_text = requests.get(url,headers=headers).text
    tree = etree.HTML(page_text)
    dd_list = tree.xpath('//*[@id="app"]/div/div/div[1]/dl/dd')
    for dd in dd_list:
        title = dd.xpath('./div/div/div/p[1]/a/text()')[0]
        star = dd.xpath('./div/div/div/p[2]/text()')[0].strip().strip('主演:')
        release_time = dd.xpath('./div/div/div/p[3]/text()')[0].strip('上映时间:').strip()
        score1 = dd.xpath('./div/div/div[2]/p/i[1]/text()')[0]
        score2 = dd.xpath('./div/div/div[2]/p/i[2]/text()')[0]
        score = score1+score2
        movie_url = 'https://maoyan.com'+dd.xpath('./div/div/div/p[1]/a/@href')[0]
        get_detail(movie_url,title,star,release_time,score)


def get_detail(url,title,star,release_time,score):
    page_text = requests.get(url,headers=headers).text
    tree = etree.HTML(page_text)
    movie_type = tree.xpath('/html/body/div[3]/div/div[2]/div[1]/ul/li[1]/text()')[0]
    movie_time = tree.xpath('/html/body/div[3]/div/div[2]/div[1]/ul/li[2]/text()')[0].split('/')[1].strip().strip('分钟')
    print(movie_time,movie_type)
    # 写入的数据
    writer.writerow([title,movie_type,movie_time,star,release_time,score])
if __name__ == '__main__':
    f = open('maoyan.csv','w',newline='',encoding='utf-8')

    # csv文件写入
    writer = csv.writer(f)
    # 表头数据
    writer.writerow(['title','movie_type','movie_time','star','release_time','score'])

    url = 'https://maoyan.com/board/4'

    urls = ['https://maoyan.com/board/4?offset={}'.format(str(i)) for i in range(0,100,10)] #页码url
    for detail_url in urls:
        print('正在爬取....')
        get_page(detail_url)
        print('爬取完成')
数据可视化
import pandas as pd
import numpy as n
data = pd.read_csv(open('C:/python-Spider/猫眼电影/maoyan.csv',encoding='utf-8')) #导入爬取并存储的数据文件
data.head()
简单分析
查看基本信息
data.info()
data.describe()
选取行列
data[['star','movie_type']] #列
data[0:10] #行
data.iloc[3,2] #选3行2列的数据
年月日分析
data['year'] = data['release_time'].str.split('-').str[0]
data['month'] = data['release_time'].str.split('-').str[1]

year = data.groupby('year')['year'].count()
list(year.index)
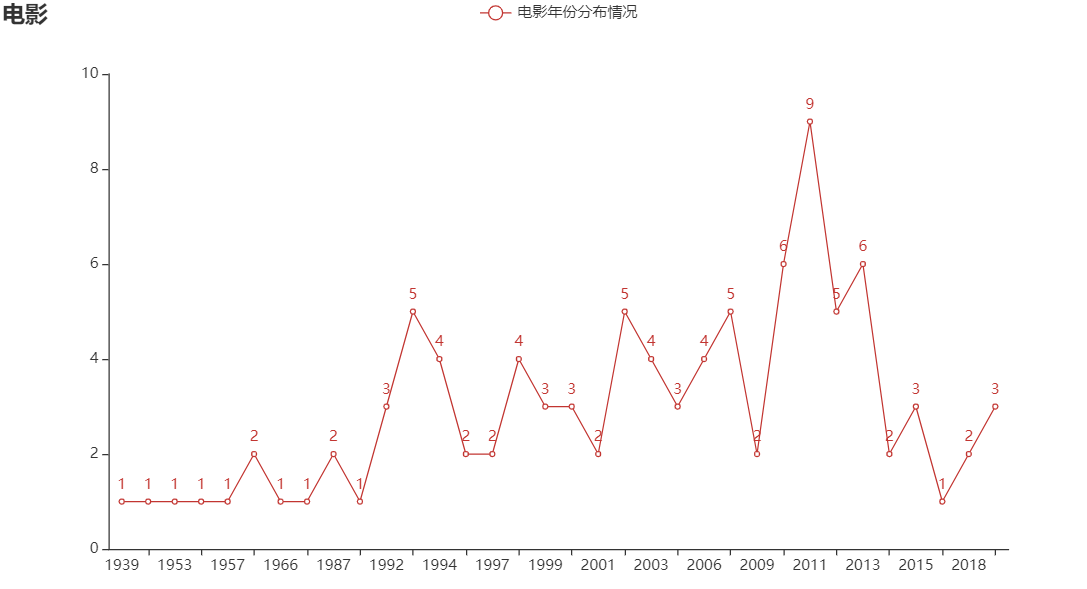
电影年份折线图
import pyecharts.options as opts
from pyecharts.charts import Line
c = (
    Line()
    .add_xaxis(list(year.index))
    .add_yaxis('电影年份分布情况', list(year))
    .set_global_opts(title_opts=opts.TitleOpts(title="电影"))
    )
c.render_notebook()
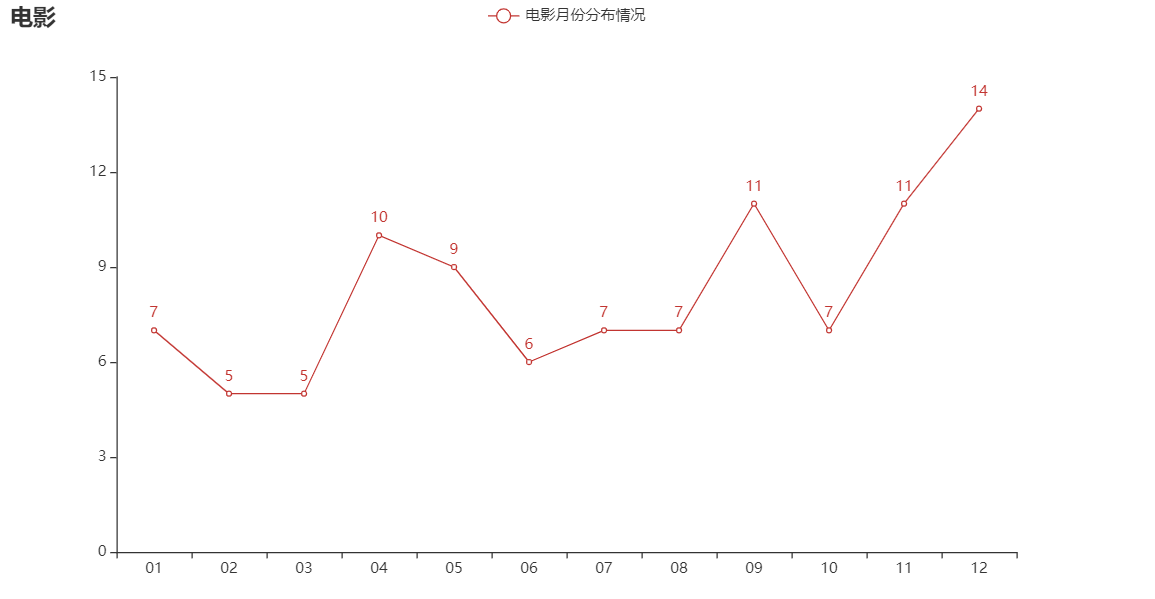
电影月份折线图
month = data.groupby('month')['month'].count()
list(month.index)

import pyecharts.options as opts
from pyecharts.charts import Line
c = (
    Line()
    .add_xaxis(list(month.index))
    .add_yaxis('电影月份分布情况', list(month))
    .set_global_opts(title_opts=opts.TitleOpts(title="电影"))
    )
c.render_notebook()
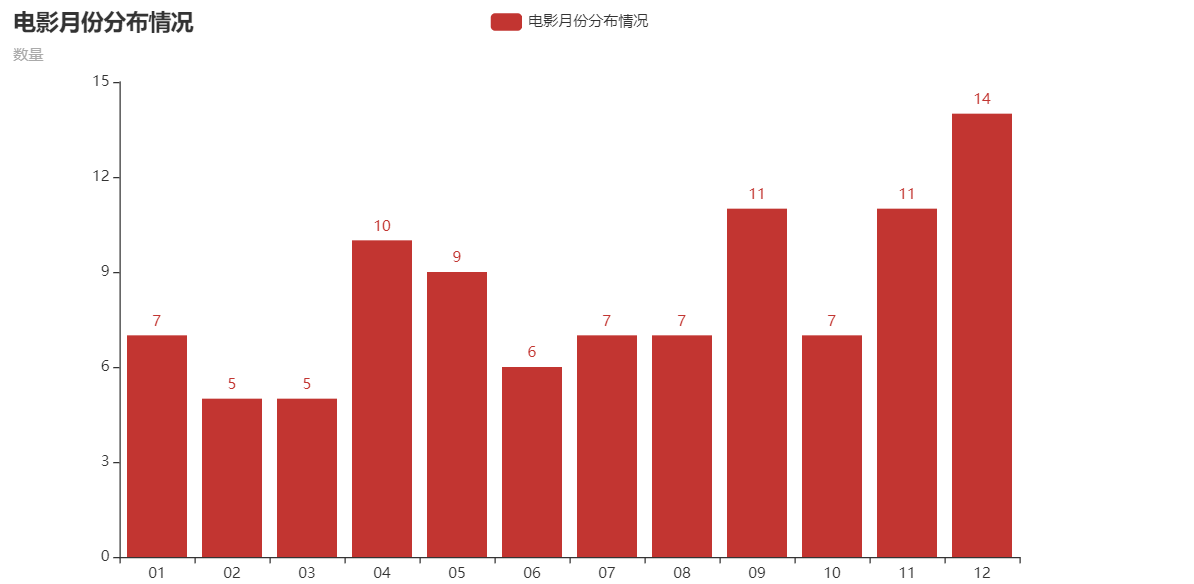
电影月份柱状图
month = data.groupby('month')['month'].count()
list(month.index)

from pyecharts.faker import Faker
from pyecharts import options as opts
from pyecharts.charts import Bar
c = (
    Bar()
    .add_xaxis(list(month.index))
    .add_yaxis("电影月份分布情况", list(month))
    .set_global_opts(title_opts=opts.TitleOpts(title="电影月份分布情况", subtitle="数量"))
)
c.render_notebook()
电影地区分布
def get_country(i):
    country = i.split('(')
    if len(country) == 1:
        return '中国'
    else:
        country_1 = country[1].strip(')')
        if country_1 == '中国香港':
            return '中国'
        elif country_1 == '罚过戛纳':
            return '法国'
        else:
            return country_1
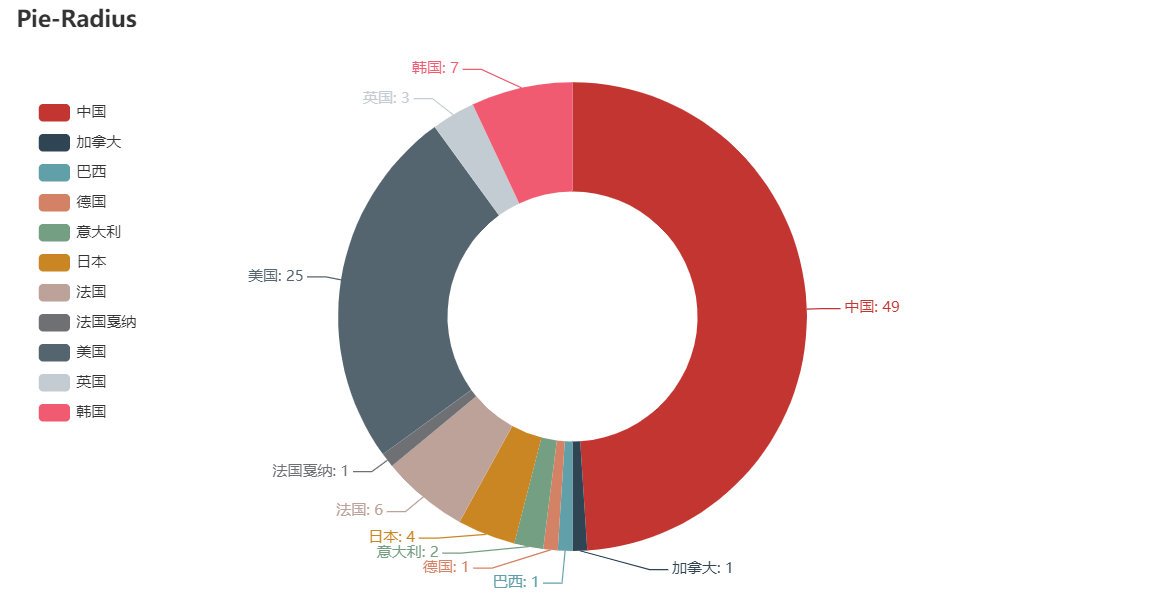
电影地区分布饼图
country = data.groupby('country')['country'].count()
list(country.index)

from pyecharts.charts import Pie
c = (
    Pie()
    .add(
        "",
        [list(z) for z in zip(list(country.index),country)],
        radius=["40%", "75%"],
    )
    .set_global_opts(
        title_opts=opts.TitleOpts(title="Pie-Radius"),
        legend_opts=opts.LegendOpts(
            orient="vertical", pos_top="15%", pos_left="2%"
        ),
    )
    .set_series_opts(label_opts=opts.LabelOpts(formatter="{b}: {c}"))
)
c.render_notebook()
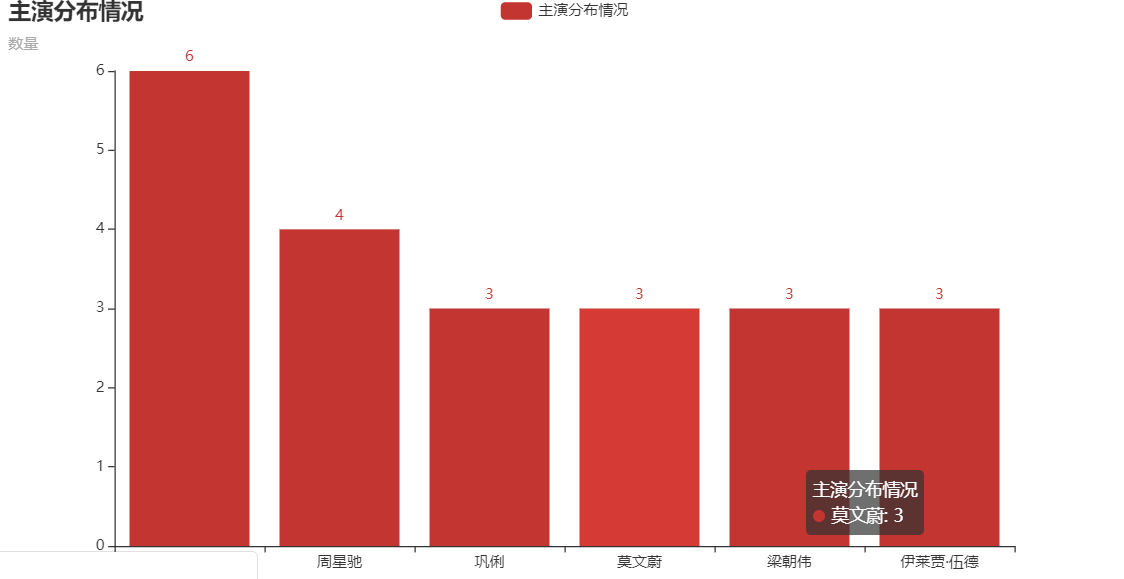
电影主演
str = ''
for i in range(100):
    str=str+data.iloc[i,3]+','
star = str.split(',')
from collections import Counter
c = Counter(star)
count = c.most_common(6)
attr = []
v = []
for i in count:
    attr.append(i[0])
    v.append(i[1])
电影主演饼图
from pyecharts.faker import Faker
from pyecharts import options as opts
from pyecharts.charts import Bar
c = (
    Bar()
    .add_xaxis(attr)
    .add_yaxis("主演分布情况", v)
    .set_global_opts(title_opts=opts.TitleOpts(title="主演分布情况", subtitle="数量"))
)
c.render_notebook()