3、ELK分析nginx日志
四、ELK分析Nginx
1、配置FIlebeat搜集syslog
#安装
rpm -ivh filebeat-6.2.3-x86_64.rpm
mv /etc/filebeat/filebeat.yml  /etc/filebeat/filebeat.yml.bak

#配置
vim /etc/filebeat/filebeat.yml
filebeat.prospectors:
- type: log
  enabled: true
  paths:
    - /usr/local/nginx/logs/access.log
  fields:
    log_topics: nginx-1.197
  max_bytes: 1048576

output.logstash:
  hosts: ["192.168.1.202:5044"]

#启动
/etc/init.d/filebeat start
2、配置Logstash从filebeat输入syslog日志
vim /etc/logstash/conf.d/nginx.conf
input {
   beats {
    port => 5044
  }
}

output {
 if[fields][log_topics] == "nginx-1.197" {
  elasticsearch {
    hosts => ["192.168.1.202:9200"]
    index => "nginx-1.197-%{+YYYY.MM}"
  }
 }
}
3、查看索引
curl http://192.168.1.202:9200/_cat/indices?v
health status index                uuid                   pri rep docs.count docs.deleted store.size pri.store.size
green  open   .kibana              sdsMVkoKQZaZncZf6OXEeg   1   0          2            0      7.4kb          7.4kb
yellow open   nginx-1.197-2018.03  QfyT76TDQEqUD31wRmoddg   5   1          0            0       460b           460b
4、创建索引
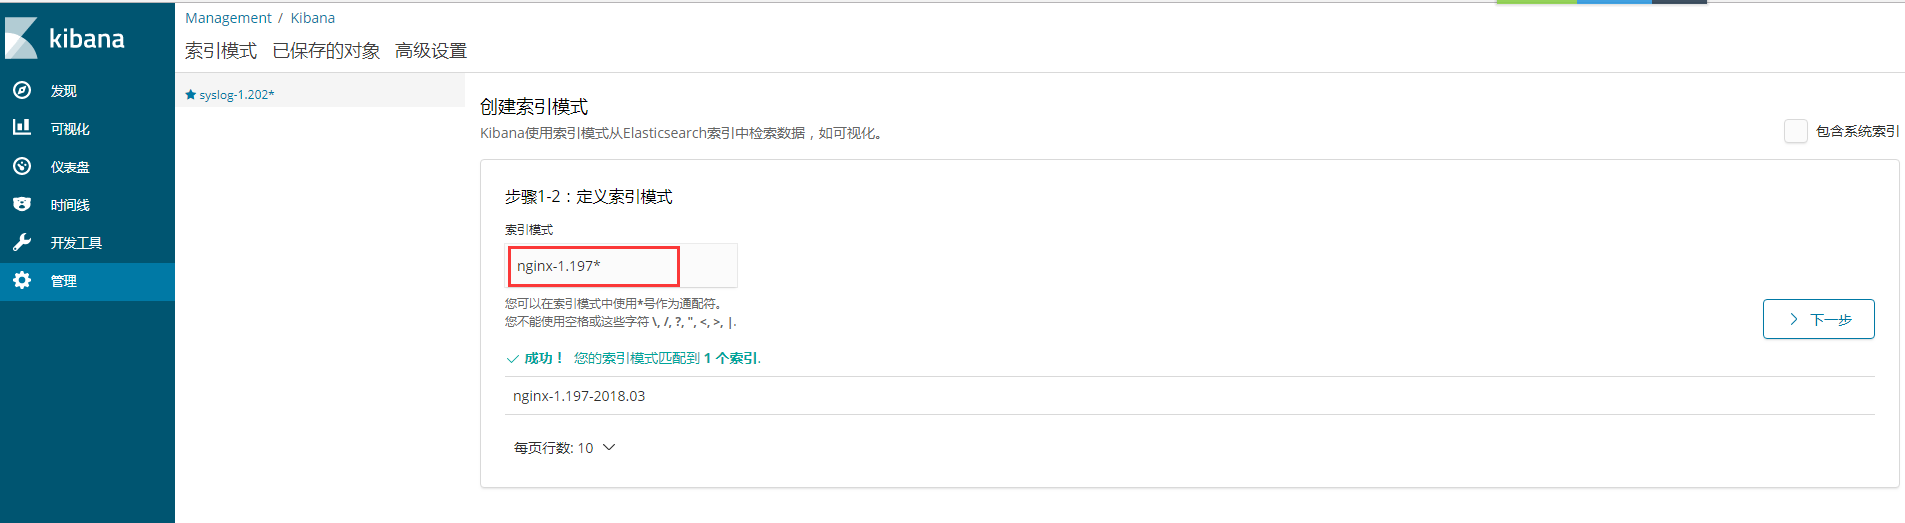
略,请看上一章

 浙公网安备 33010602011771号