latex 常用小结
在写论文,甚至有些课程的报告的时候,latex是常用的工具。这篇博文简单的记录了latex常用的一些内容。
最近发现一个在线latex网站 https://www.sharelatex.com/ 以后就不用在电脑上安装CTEX了。
1 基本模块
没用过latex的读者,最想问的问题莫过于latex的 “hello world”程序长什么样。那么下面就贴一张图片来展示:

latex就是通过一些列指令来控制排版的。 一些一目了然的参数我就不解释了。第一行的\documentclass{article},article就是指一般的文档格式。可以换成,其他的,比如book,就是书的版式,分成很多章节chapter,还有一些论文的版式,例如IEEEtran,sig-alternate,这两种都是一页分两列的,看着很高端。
%这是我的一个作业报告的前奏部分
\documentclass[a4paper,11pt]{article}
\author{leavingseason}

\title{Hello World}
\date{\today}
\usepackage[english]{babel}
\usepackage{hyperref}
\usepackage{amsmath}
\usepackage{graphicx}
\usepackage{bm}
\usepackage{xcolor}
\usepackage{float}
\usepackage{geometry}
\geometry{left=2.5cm,right=2.5cm,top=2.5cm,bottom=2.5cm}
\usepackage指需要使用一些宏包。 交代封面和版式的指令完之后,就开始了文档内容。用\begin{document} 和\end{document} 包围起来。 里面可以有摘要,很多个section等等常见的东西。
好了,大体上latex的流程就是这样。下面,我们要做的,就是实际中需要用哪些东西,再亡羊补牢。
2 常用命令
2.1一篇文章通常很长。那么就需要把它分成多个子文件。每个文件都是以.tex为后缀,用命令\input 或者\include 把它们添加进主文件中。
\input{introduction}
\input{model1}
\input{model2}
\input{model3}
\input 在插入子文件的时候不换页,\include在插入子文件的时候强制换页
2.2 引用参考文献
\bibliographystyle{plain}
\bibliography{bib/tex}
把参考文献写入一个以.bib为后缀名的文件中,例如bib/tex.bib,然后用上面的两条语句就可以了。.bib文件的内容如下
@article{KDE,
  title = {Estimating the helpfulness and economic impact of product reviews: Mining text and reviewer characteristics},
  author = {Ghose, Anindya and Ipeirotis, Panagiotis G},
  journal = {Knowledge and Data Engineering, IEEE Transactions on},
  volume = {23},
  number = {10},
  pages = {1498--1512},
  year = {2011},
  publisher = {IEEE}
}
@inproceedings{ICDM,
  title={Modeling and predicting the helpfulness of online reviews},
  author={Liu, Yang and Huang, Xiangji and An, Aijun and Yu, Xiaohui},
  booktitle={Data Mining, 2008. ICDM'08. Eighth IEEE International Conference on},
  pages={443--452},
  year={2008},
  organization={IEEE}
}
@inproceedings{ICEC,
  title={Designing novel review ranking systems: predicting the usefulness and impact of reviews},
  author={Ghose, Anindya and Ipeirotis, Panagiotis G},
  booktitle={Proceedings of the ninth international conference on Electronic commerce},
  pages={303--310},
  year={2007},
  organization={ACM}
}
获取这样的内容有一个小技巧:在谷歌学术中输入你要引用的论文名字,然后点开“引用”那个链接,再点击"导入BibTeX",引用的格式就出来了。
@article{KDE,article={}... 在这个命令中,KDE是这篇引用文章的索引号,是你自己定义的。在你的正文中要引用他的话,就用 \cite{KDE}。 同时引用两篇:\cite{KDE,Another}注意逗号前后都不要有空格,不然会报错。
值得注意的是,如果你的正文没有引用该文章,那么即使在.bib中有该文章的信息,生成的pdf的reference列表中也不会有该文章的。
2.3 章节
\section{model1}, \subsection{...}, \subsubsection{...}等等
2.5 缩进
每段开头想要缩进,或者不要缩进: \indent \noindent
2.6 换行: \\
2.7 数学公式
记得用$ $把公式的内容包围起来,或者用 \begin{equation} \end{equation} 。 公式中粗体表示向量,用\mathbf{}:
\begin{equation}\label{eq:rbf}
\phi(\mathbf{x}|\mathbf{\mu},\Sigma) = f(\frac{(\mathbf{x}-\mathbf{\mu})^T(\mathbf{x}-\mathbf{\mu})}{\sigma^2})
\end{equation}
指数用 ^{指数部分}, 下标用 _{下标部分} , 分数用 \frac{分子}{分母} , WinEdit 上也有很好用的快捷按钮:

公式的高级用法,例如连等号对齐,多个公式只用一个label:
\usepackage{eqnarray}
\begin{eqnarray}\label{eq:eq1}
r_{ij} &=& \widetilde{U}_i \cdot \widetilde{V}_j \nonumber \\
&=& U_{ia} \cdot V_j + U_{ib} \cdot (A_j \mathbf{B})
\end{eqnarray}
2.8 列表
\begin{enumerate}
\item ..
\item ..
\end{enumerate}
这个是带序号的列表。 把enumerate 换成itemize, 就是不带序号的。例如:

如果想要缩进,需要\usepackage{enumitem} ,然后:
\begin{enumerate}[label=(\roman*),leftmargin=3\parindent]
\item 。。。
\item 。。。
\item 。。。
\end{enumerate}
2.9 插入图片:
\begin{figure}[htbp]
\centering
\includegraphics[width=0.8\textwidth]{pic/timeliness.JPG}
\caption{An example of review helpfulness vs. time of review.}
\label{fig:timeliness}
\end{figure}
要引用图片的时候,就用 \ref{fig:timeliness}。 图片可以裁剪,用法如:\includegraphics[trim={0 4cm 0 2cm},clip,width=0.5\textwidth]{char_cate2.pdf}
如果版面是双栏的,图片比较大想跨双栏的话,可以用\begin{figure*}
并排显示多张图:
\begin{figure*}[htbp]
\centering
\begin{subfigure}{.33\textwidth}
  \centering
  \includegraphics[trim={1cm 4cm 1cm 3cm},clip,width=1\textwidth]{charts/geo_auc.pdf}
  \caption{Gpredictors}
  \label{fig:g_auc}
\end{subfigure}%
\begin{subfigure}{.33\textwidth}
  \centering
  \includegraphics[trim={1cm 4cm 1cm 3cm},clip,width=1\textwidth]{charts/mobility_auc.pdf}
  \caption{U predictors}
  \label{fig:u_auc}
\end{subfigure}
\begin{subfigure}{.33\textwidth}
  \centering
  \includegraphics[trim={1cm 4cm 1cm 3cm},clip,width=1\textwidth]{charts/ratings_auc.pdf}
  \caption{R predictors. }
  \label{fig:r_auc}
\end{subfigure}
\caption{AUC performance comparison for individual predictors of different groups..}
\label{fig:heatmap}
\end{figure*}
2.10 表格
实质上是用指令控制表格框。注意 (1) \label{tab:d2}要放在\end{table}之前,不能放在\begin{table}之后,不然引用\ref{tab:d2}的时候会出问题 (2)表格等某些元素里面不能用footnote,要用footnotemark+footnotetext代替
\begin{table}
\centering
\caption{Basic statistics of three cities}
\begin{tabular}{|c|c|c|l|} \hline
City&\#column1&\#column2&\#column3\footnotemark\\ \hline
Shanghai&127,503 & 80,914& 7,190 \\ \hline
Beijing&10,396 & 6,772&5,917\\ \hline
Guangzhou & 1,273 & 1,844 & 1,747 \\
\hline\end{tabular}
\label{tab:d2}
\end{table}
\footnotetext{We。。。.}
更多用法可以参考:https://en.wikibooks.org/wiki/LaTeX/Tables 。 注意可能要引用一些包,例如
\usepackage{caption}
\usepackage{multirow}
2.11 字体
意大利斜体: \textit{文本}
slanted斜体: \textsl{文本}
加粗命令: \textbf{文本}
好了,我上次用到的就这么多了。希望以后回头看看的时候,可以作为回忆的参考。 长期更新。
其他:
一份不太简短的 LATEX 介绍 http://www.mohu.org/info/lshort-cn.pdf
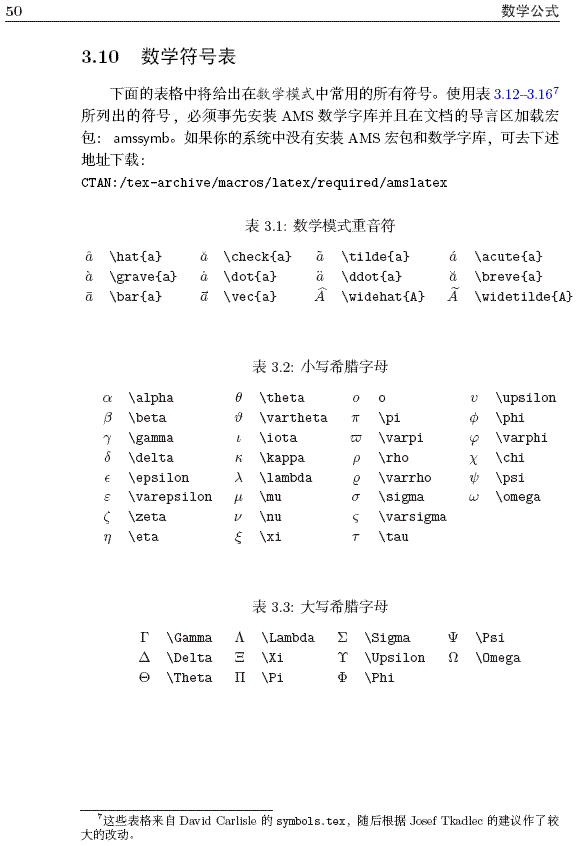
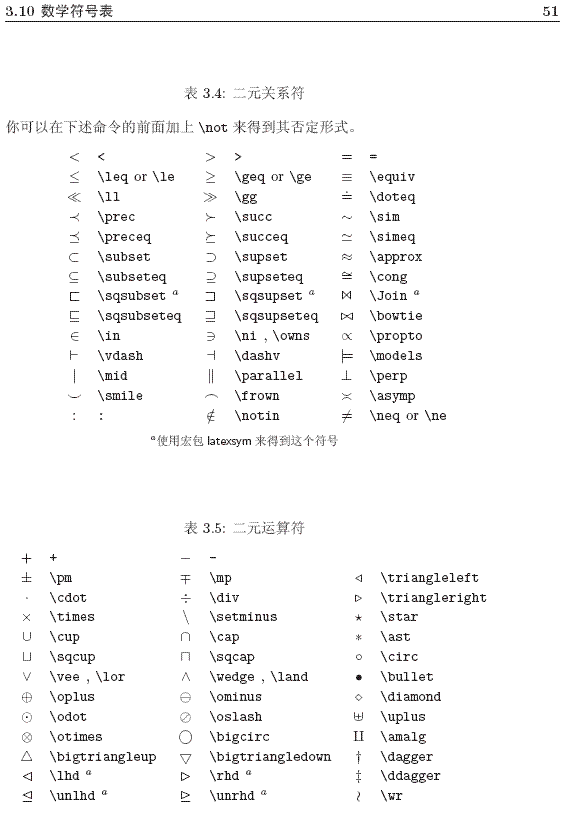
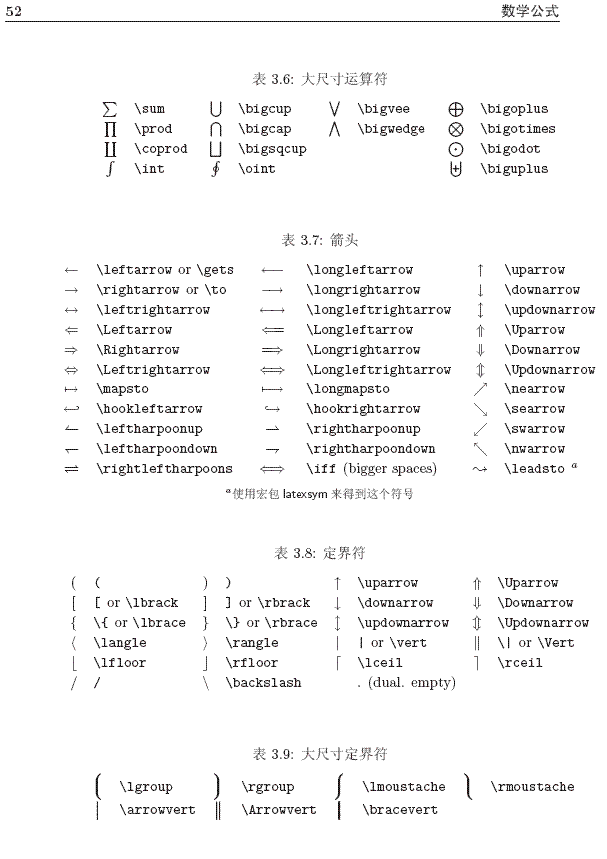
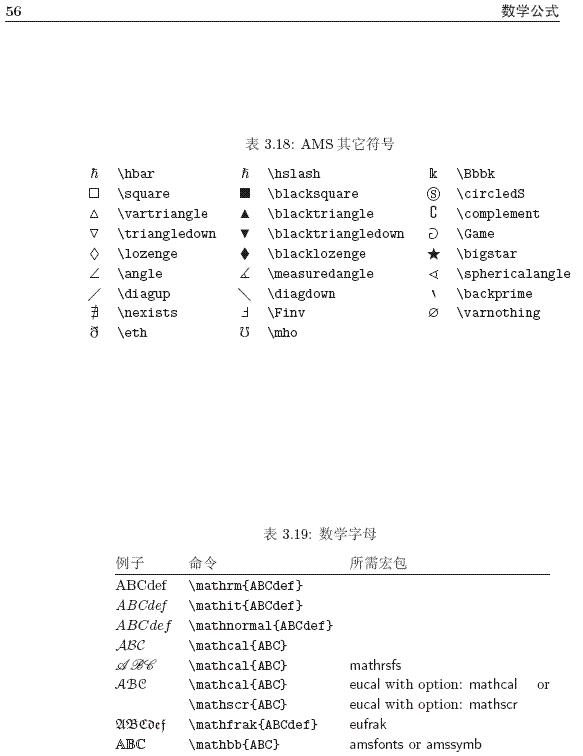
数学符号:


一个很全面的数学符号集: http://blog.sina.com.cn/s/blog_4df4d74401014qxb.html
posted on 2013-05-28 01:10 leavingseason 阅读(15412) 评论(0) 编辑 收藏 举报


