

还是不废话,自己看代码。刚做完毕设实在懒得下手写,
 代码
代码

*版本: 画折线图
*日期:2010.4.15
*作者:孙晓玮
*联系方式:454084563@qq.com
*说明:用VML实现折线图
*****************************************************************************************************************/
//参数含义(容器ID,图表的宽度,图表的高度,背景色,有无阴影,有无辅助线)
function LineChart(pContainerId,pWidth,pHeight,bg,shadow,hasAss)
{
this.container = document.getElementById(pContainerId);
this.width = pWidth||500;//设置图表宽度、高度
this.height = pHeight||300;
this.bgColor = bg||'#9cf';//设置背景颜色
this.hasShadow = shadow||false;//设置有无阴影
this.hasAssxLine = hasAss||false;//有无坐标辅助线
this.WarnLineNum = 0;//警示线个数
this.lineCanvasIdArray = new Array();//存储曲线id,用于删除等 个数既是曲线个数,每个曲线位于一个lineCanvas
this.ployLineDataArray = new Array();//默认显示十个数据
this.xLableArray = new Array();//X坐标数组 长度与数据数组相同
this.defaultNum = 10;
for(i=0;i<this.defaultNum;i++)
{
this.ployLineDataArray[i] = -1;
this.xLableArray[i] = ' ';
}
this.currentNum = 0;//当前数据个数,最开始的时候曲线从左到右移动
////////////////////////////////
this.XLength = 16800;//
this.YLength = 14700;
//默认颜色列表
this.defaultColor=new Array("#CC33CC","#FFCC00","#33FF33","#3300CC","33CCFF","#FF6600","#663366","#FF0000","#33CCCC","#990099","#CCFF66","009933","996600","#FF66FF","#003300","#Yellow","#Lime","Navy","#Blue");
//设置标题及其属性(字体大小,颜色)
this.CaptionAtt = {
value:'',
fontSize:18,
fontColor:'#6633FF'
};
//设置y轴颜色及其其他属性,最小值,最大值,数据精度(小数位数),单位,坐标以及其属性(字体大小,颜色)
this.yAxisAtt = {
minValue:0,
maxValue:0,
precision:0,
color:'#000000',
weight:1,
unit:'',
fontSize:7,
fontColor:'#000000'
}
//设置x轴颜色及其其他属性,单位,单位以及其属性(字体大小,颜色)
this.xAxisAtt = {
color:'#000000',
weight:1,
unit:'',
fontSize:7,
fontColor:'#000000'
}
//设置横向坐标辅助线属性
this.xAssLineAtt = {
color:'#0099FF',
weight:0.5,
type:'shortdot'
}
}
LineChart.prototype.Draw = function()//容器id,例如div层id
{
//开始作图///////////////////////////////////////
//创建画布内置坐标范围20000,20000///////////////////////////////////////////////////////////
this.canvas=document.createElement("<v:group id='" + this.container.id + "table' style='position:absolute;left:0px;right:0px;width:"+this.width+"px;height:"+this.height+"px;'coordsize = '20000,20000'></v:group>");
//大背景/////////
var background = document.createElement("<v:rect id='" +this.container.id + "background' style='position:absolute;left:0px;right:0px;width:20000px;height:20000px;' fillcolor='"+this.bgColor+"' strokecolor='gray'></v:rect>");
//if(this.hasShadow)
// background.appendChild(document.createElement("<v:shadow on='t' type='single' color='silver' offset='4pt,4pt'/>"));
background.appendChild(document.createElement("<v:fill rotate='t' angle='-45' focus='100%' type='gradient'/>"));
this.canvas.appendChild(background);
//标题///////////////////////////////////////////////////////////
var caption=document.createElement("v:rect");
caption.style.position='relative';
caption.style.top='250px';
caption.style.left='500px';
caption.style.width='19000px';
caption.style.height='1200px';
caption.filled='false';
caption.stroked='false';
var captiontext=document.createElement("v:TextBox");
captiontext.inset='0pt,0pt,0pt,0pt';
var captiondiv = document.createElement("<div style='FONT-SIZE:"+this.CaptionAtt.fontSize+"px;COLOR:"+this.CaptionAtt.fontColor+";WORD-BREAK;FONT-FAMILY:黑体;vertical-align:middle; text-align:center;'></div>");
captiondiv.innerHTML = this.CaptionAtt.value;
captiontext.appendChild(captiondiv);
caption.appendChild(captiontext);
this.canvas.appendChild(caption);
//XY轴 x轴长度19000-1400,y轴长度18000-2000
var XXX = document.createElement("<v:line ID='" + this.container.id + "X' from='1400,18000' to='19000,18000' style='z-index:2' strokecolor='"+this.xAxisAtt.color+"' strokeWeight="+this.xAxisAtt.weight+"pt></v:line>");
XXX.innerHTML = "<v:stroke EndArrow='Classic'/>";
var YYY = document.createElement("<v:line ID='" + this.container.id + "Y' from='1400,18000' to='1400,2000' style='z-index:2' strokecolor='"+this.yAxisAtt.color+"' strokeWeight="+this.yAxisAtt.weight+"pt></v:line>");
YYY.innerHTML = "<v:stroke EndArrow='Classic'/>";
this.canvas.appendChild(XXX);
this.canvas.appendChild(YYY);
//X轴与Y轴的单位
var YYYunit = document.createElement("<v:Rect style='position:absolute;left:280px;top:1500px;width:1000px;height:1000px' filled = 'f'stroked='false'></v:Rect>");
YYYunit.innerHTML = "<v:TextBox inset='0pt,0pt,0pt,0pt' style='font-size:"+this.yAxisAtt.fontSize+"pt;color:"+this.yAxisAtt.fontColor+";'><div style='vertical-align:middle; text-align:right;'>"+this.yAxisAtt.unit+"</div></v:TextBox>";
var XXXunit = document.createElement("<v:Rect style='position:absolute;left:18400px;top:18300px;width:1500px;height:1000px' filled = 'f' stroked='false'></v:Rect>");
XXXunit.innerHTML = "<v:TextBox inset='0pt,0pt,0pt,0pt' style='font-size:"+this.xAxisAtt.fontSize+"pt;color:"+this.xAxisAtt.fontColor+";'><div style='vertical-align:middle; text-align:center;'>"+this.xAxisAtt.unit+"</div></v:TextBox>";
this.canvas.appendChild(XXXunit);
this.canvas.appendChild(YYYunit);
//画7条横线以及纵坐标刻度
var dY = (this.yAxisAtt.maxValue-this.yAxisAtt.minValue)/this.YLength;
var yLableNum = 8;
var beginY = this.yAxisAtt.minValue;
var beginX = 1400;
for(i=0; i<yLableNum; i++)
{
if (i<yLableNum-1)
{
var l1 = document.createElement("<v:line from='1300,"+(i*2100+3300)+"' to='1400,"+(i*2100+3300)+"' style='z-index:2' strokecolor='#000000'></v:line>");//y轴坐标短线
var l2 = document.createElement("<v:line from='1400,"+(i*2100+3300)+"' to='18200,"+(i*2100+3300)+"' style='z-index:2'strokeWeight="+this.xAssLineAtt.weight+"pt strokecolor='"+this.xAssLineAtt.color+"'></v:line>");
l2.innerHTML = "<v:Stroke dashstyle='"+this.xAssLineAtt.type+"'/>";
this.canvas.appendChild(l1);
this.canvas.appendChild(l2);
}
var yLable = document.createElement("<v:Rect style='z-index:2;position:relative;left:100px;top:"+(17300-i*2100)+"px;width:1200px;height:1000px' filled = 'f' stroked='false'></v:Rect>");
var ytb = document.createElement("<v:TextBox inset='0pt,0pt,0pt,0pt' style='font-size:"+this.yAxisAtt.fontSize+"pt;color:"+this.yAxisAtt.fontColor+"'></v:TextBox>");
var ytbdiv = document.createElement("<div style='vertical-align:middle; text-align:right;'></div>");
ytbdiv.innerHTML = xRound(beginY+i*dY*2100,this.yAxisAtt.precision);
ytb.appendChild(ytbdiv);
yLable.appendChild(ytb);
this.canvas.appendChild(yLable);
}
this.container.appendChild(this.canvas);
this.xLableCanvas=document.createElement("<v:group id='" + this.container.id + "_xLableCanvas' style='position:absolute;width:"+this.width+"px;height:"+this.height+"px;'coordsize = '20000,20000'></v:group>");
this.container.appendChild(this.xLableCanvas);
this.warnLineCanvas=document.createElement("<v:group id='" + this.container.id + "_warnLineCanvas' style='position:absolute;width:"+this.width+"px;height:"+this.height+"px;'coordsize = '20000,20000'></v:group>");
this.container.appendChild(this.warnLineCanvas);
}
/////////////////////////////////////////////////////////
/////属性设置接口
////////////////////////////////////////////////////////
//设置标题属性
LineChart.prototype.SetCaptionAtt = function(value,fs,fc)
{
this.CaptionAtt.value = value;
this.CaptionAtt.fontSize = (fs==null?18:fs);
this.CaptionAtt.fontColor = (fc==null?'#6633FF':fc);//fc||'#6633FF';
}
/////////////////////////////////////////////////
//设置y轴颜色及其其他属性,最小值,最大值,数据精度(小数位数),单位,颜色,粗细,字体大小,字体颜色
LineChart.prototype.SetyAxisAtt = function(min,max,pre,u,c,w,fs,fc)
{
this.yAxisAtt.minValue = min;
this.yAxisAtt.maxValue = max;
this.yAxisAtt.precision = pre;
this.yAxisAtt.unit = u;
this.yAxisAtt.weight = (w==null?1:w);//w||1;
this.yAxisAtt.color = (c==null?'#000000':c);//c||;
this.yAxisAtt.fontSize = (fs==null?7:fs);//fs||7;
this.yAxisAtt.fontColor = (fc==null?'#000000':fc);//fc||;
}
/////////////////////////////////////////////////
//设置x轴颜色及其其他属性,单位,单位以及其属性(字体大小,颜色)
LineChart.prototype.SetxAxisAtt = function(u,fs,c,fc,w)
{
this.xAxisAtt.unit = u;
this.xAxisAtt.weight = (w==null?1:w);//w||1;
this.xAxisAtt.color = (c==null?'#000000':c);//c||'#000000';
this.xAxisAtt.fontSize = (fs==null?7:fs);//fs||7;
this.xAxisAtt.fontColor = (fc==null?'#000000':fc);//fc||'#000000';
}
/////////////////////////////////////////////////
//设置横向坐标辅助线属性
LineChart.prototype.SetxAssLineAtt = function(c,w,t)
{
this.xAssLineAtt.color = (c==null?'#0099FF':c);//c||'#0099FF';
this.xAssLineAtt.weight = (w==null?0.5:w);//w||0.5;
this.xAssLineAtt.type = (t==null?'shortdot':t);//t||'shortdot';
}
/////////////////////////////////////////////////
//添加警示线,设置警示线属性,以及警示线提示text
LineChart.prototype.AddWarnLine = function(l,tip,c,w,ty)//位置,颜色,粗细,类型,鼠标提示(虚线,实线等dot,dash,dashdot,shortdot,shortdash)
{
var dY = (this.yAxisAtt.maxValue-this.yAxisAtt.minValue)/this.YLength;
var beginY = this.yAxisAtt.minValue;
var beginX = 1400;
var location = 18000-(l-beginY)/dY;//实际坐标转换为屏幕坐标
var color = (c==null?'red':c);//c||'red';
var weight =(w==null?1:w);// w||1;
var type = (ty==null?'solid':ty);//ty||'solid';
var tips = (tip==null?'':tip);//tip||'';
var mouseEvent = "title='"+tips+":"+xRound(l,this.yAxisAtt.precision)+"'onmouseover='mouseover(\""+this.container.id+"_WarnLine_"+this.WarnLineNum+"\",\""+weight+"\")'onmouseout='mouseout(\""+this.container.id+"_WarnLine_"+this.WarnLineNum+"\",\""+weight+"\")'";
var line = document.createElement("<v:line id='"+this.container.id+"_WarnLine_"+this.WarnLineNum+"' "+mouseEvent+" from='1400,"+location+"' to='18200,"+location+"' style='z-index:2'strokeWeight="+weight+"pt strokecolor='"+color+"'></v:line>");
line.innerHTML = "<v:Stroke dashstyle='"+type+"'/>";
this.warnLineCanvas.appendChild(line);
this.WarnLineNum++;//警示线个数,用于设置ID
}
/////////////////////////////////////////////////
//添加x轴坐标lable 整体添加
LineChart.prototype.AddxAxisLable = function(lables)//lables 是 Array数组
{
var dX = this.XLength/(lables.length-1);
for(i=0;i<lables.length;i++)
{
var xLable = document.createElement("<v:Rect style='position:relative;left:"+(700+i*dX)+"px;top:18200px;width:1000px;height:1200px' filled='f' stroked='false'></v:Rect>");
var xtb = document.createElement("<v:TextBox inset='0pt,0pt,0pt,0pt' style='font-size:"+this.xAxisAtt.fontSize+"pt;color:"+this.xAxisAtt.fontColor+"'></v:TextBox>");
var xtbdiv = document.createElement("<div style='vertical-align:middle; text-align:center;'></div>");
xtbdiv.innerHTML = lables[i];
xtb.appendChild(xtbdiv);
xLable.appendChild(xtb);
this.xLableCanvas.appendChild(xLable);
var xl = document.createElement("<v:line from='"+(1400+i*dX)+",18000' to='"+(1400+i*dX)+",18100' style='z-index:2' strokecolor='#000000'></v:line>");//x轴短标记
this.xLableCanvas.appendChild(xl);
}
}
/////////////////////////////////////////////////
//设置折线颜色及其其他属性,设置提示text,每调用一次会覆盖上次数据
LineChart.prototype.AddPolyLine = function(lineid,datas,tip,c,w)//id,Array类型数组,tips,颜色,粗细
{
//把曲线以及曲线结点作为一个整体,控制其显示隐藏等
var lineCanvas=document.createElement("<v:group id='" + this.container.id + "_lineCanvas_"+lineid+"' style='position:absolute;width:"+this.width+"px;height:"+this.height+"px;'coordsize = '20000,20000'></v:group>");
var dX = this.XLength/(datas.length-1);//17000为有效宽度
var dY = this.YLength/(this.yAxisAtt.maxValue-this.yAxisAtt.minValue);
var beginX = 1400;
var beginY = this.yAxisAtt.minValue;
var color = (c==null?this.defaultColor[this.lineCanvasIdArray.length%this.defaultColor.length]:c);
var weight = (w==null?1.5:w);//w||1.5;
var tips = (tip==null?'':tip);//tip||'';
//每个曲线是一个PolyLine
var pointStr="Points = '";
var owidth = 200;
var oheight = owidth*this.width/this.height;
var mouseEvent = '';
for(i=0;i<datas.length;i++)
{
pointStr+=(beginX+i*dX)+","+(18000-(datas[i]-beginY)*dY)+" ";
//曲线端点为空心圆
mouseEvent = "title='"+xRound(datas[i],this.yAxisAtt.precision)+"'";
var node = document.createElement("<v:oval id='"+this.container.id+"_polyNode_"+lineid+"_"+i+"' style='position:relative;left:"+(beginX+i*dX-owidth/2)+"px;top:"+(18000-(datas[i]-beginY)*dY-oheight/2)+"px;width:"+owidth+"px;height:"+oheight+"px'strokecolor='"+color+"'strokeweight='2pt'"+mouseEvent+"style='z-index:4'/>");
lineCanvas.appendChild(node);
}
pointStr+="'";
mouseEvent = "title='"+tips+"'onmouseover='mouseover(\""+this.container.id+"_polyLine_"+lineid+"\",\""+weight+"\")'onmouseout='mouseout(\""+this.container.id+"_polyLine_"+lineid+"\",\""+weight+"\")'";
var l = document.createElement("<v:PolyLine id = '"+this.container.id+"_polyLine_"+lineid+"'"+pointStr+mouseEvent+" style='z-index:3'strokeWeight='"+weight+"pt'filled='false' strokecolor='"+color+"'></v:line>");
pointStr = "";//初始化
lineCanvas.appendChild(l);
this.container.appendChild(lineCanvas);
this.lineCanvasIdArray.push(this.container.id + "_lineCanvas_"+lineid);//添加
}
/////////////////////////////////////////////////
//设置折线颜色及其其他属性,设置提示text,每调用一次会覆盖上次数据
LineChart.prototype.HidePolyLine = function(lineid)//隐藏一条线
{
//把曲线以及曲线结点作为一个整体,控制其显示隐藏等
$("#"+this.container.id +"_lineCanvas_"+lineid).hide();
}
LineChart.prototype.ShowPolyLine = function(lineid)//显示一条线
{
//把曲线以及曲线结点作为一个整体,控制其显示隐藏等
$("#"+this.container.id +"_lineCanvas_"+lineid).show();
}
LineChart.prototype.IsVisible = function(lineid)//是1否0显示
{
//把曲线以及曲线结点作为一个整体,控制其显示隐藏等
//alert(lineid);
return $("#"+this.container.id +"_lineCanvas_"+lineid).is(':visible');
}
LineChart.prototype.DeletePolyLine = function(lineid)//删除一条线
{
//把曲线以及曲线结点作为一个整体,控制其显示隐藏等
$("#"+this.container.id +"_lineCanvas_"+lineid).remove();
}
LineChart.prototype.DeleteAllPolyLine = function()//删除所有条曲线
{
for(i=0;i<this.lineCanvasIdArray.length;i++)
$("#"+this.lineCanvasIdArray[i]).remove();
}
LineChart.prototype.HasPolyLine = function(lineid)//是否已经存在
{
//把曲线以及曲线结点作为一个整体,控制其显示隐藏等
return $("#"+this.container.id +"_lineCanvas_"+lineid).length;
}
/////////////////////////////////////////////////
//根据指定曲线ID实时更新数据 数据整体改变
LineChart.prototype.UpdatePolyLineData = function(lineid,datas)//Array类型
{
var line = document.getElementById(this.container.id+"_polyLine_"+lineid);
var tips = line.getAttribute('title');
var color = line.getAttribute('strokecolor');
var weight = line.getAttribute('strokeWeight');
var lineCanvas = document.getElementById(this.container.id+"_lineCanvas_"+lineid);
lineCanvas.innerHTML = "";
//重新画曲线
var dX = this.XLength/(datas.length-1);//17000为有效宽度
var dY = this.YLength/(this.yAxisAtt.maxValue-this.yAxisAtt.minValue);
var beginX = 1400;
var beginY = this.yAxisAtt.minValue;
//每个曲线是一个PolyLine
var pointStr="Points = '";
var owidth = 200;
var oheight = owidth*this.width/this.height;
var mouseEvent = '';
for(i=0;i<datas.length;i++)
{
pointStr+=(beginX+i*dX)+","+(18000-(datas[i]-beginY)*dY)+" ";
//曲线端点为空心圆
//mouseEvent = "title='"+xRound(datas[i],this.yAxisAtt.precision)+"'";
var node = document.createElement("<v:oval id='"+this.container.id+"_polyNode_"+lineid+"_"+i+"' style='position:relative;left:"+(beginX+i*dX-owidth/2)+"px;top:"+(18000-(datas[i]-beginY)*dY-oheight/2)+"px;width:"+owidth+"px;height:"+oheight+"px'strokecolor='"+color+"'strokeweight='2pt'"+mouseEvent+"style='z-index:4'/>");
lineCanvas.appendChild(node);
}
pointStr+="'";
//mouseEvent = "title='"+tips+"'onmouseover='mouseover(\""+this.container.id+"_polyLine_"+lineid+"\",\""+weight+"\")'onmouseout='mouseout(\""+this.container.id+"_polyLine_"+lineid+"\",\""+weight+"\")'";
var l = document.createElement("<v:PolyLine id = '"+this.container.id+"_polyLine_"+lineid+"'"+pointStr+mouseEvent+" style='z-index:3'strokeWeight='"+weight+"pt'filled='false' strokecolor='"+color+"'></v:line>");
pointStr = "";//初始化
lineCanvas.appendChild(l);
this.container.appendChild(lineCanvas);
}
//添加没有数据的线,数据需要动态获取
LineChart.prototype.AddNoDataPolyLine = function(lineid,tip,c,w)
{
var color = (c==null?this.defaultColor[this.lineCanvasIdArray.length%this.defaultColor.length]:c);
var weight = (w==null?1.5:w);//w||1.5;
var tips = (tip==null?'':tip);//tip||'';
var lineCanvas=document.createElement("<v:group id='" + this.container.id + "_lineCanvas_"+lineid+"' style='position:absolute;width:"+this.width+"px;height:"+this.height+"px;'coordsize = '20000,20000'></v:group>");
mouseEvent = "title='"+tips+"'";//onmouseover='mouseover(\""+this.container.id+"_polyLine_"+lineid+"\")'onmouseout='mouseout(\""+this.container.id+"_polyLine_"+lineid+"\")'";
var l = document.createElement("<v:PolyLine id = '"+this.container.id+"_polyLine_"+lineid+"'"+mouseEvent+" style='z-index:3'strokeWeight='"+weight+"pt'filled='false' strokecolor='"+color+"'></v:line>");
lineCanvas.appendChild(l);
this.container.appendChild(lineCanvas);
this.lineCanvasIdArray.push(this.container.id + "_lineCanvas_"+lineid);//添加
}
/////////////////////////////////////////////////
//添加x轴坐标lable 左平移
LineChart.prototype.AddxAxisLable_RealTime = function(lable)//
{
/////datas长度应该小于ployLineDataArray即<10
$("#" + this.container.id + "_xLableCanvas").empty();
this.xLableArray.push(lable);//加到末尾
this.xLableArray.shift();//删除首元素
var dX = this.XLength/(this.defaultNum-1);
for(i=this.defaultNum-this.currentNum;i<this.defaultNum;i++)
{
var xLable = document.createElement("<v:Rect class='"+this.container.id+"_xlablerect' style='position:relative;left:"+(700+i*dX)+"px;top:18200px;width:1000px;height:1200px' filled='f' stroked='false'></v:Rect>");
var xtb = document.createElement("<v:TextBox inset='0pt,0pt,0pt,0pt' style='font-size:"+this.xAxisAtt.fontSize+"pt;color:"+this.xAxisAtt.fontColor+"'></v:TextBox>");
var xtbdiv = document.createElement("<div style='vertical-align:middle; text-align:center;'></div>");
xtbdiv.innerHTML = this.xLableArray[i];
xtb.appendChild(xtbdiv);
xLable.appendChild(xtb);
$("#" + this.container.id + "_xLableCanvas").append(xLable);
var xl = document.createElement("<v:line from='"+(1400+i*dX)+",18000' to='"+(1400+i*dX)+",18100' style='z-index:2' strokecolor='#000000'></v:line>");//x轴短标记
$("#" + this.container.id + "_xLableCanvas").append(xl);
}
}
/////////////////////////////////////////////////
//根据指定曲线ID实时更新数据 效果:曲线向左移动效果
LineChart.prototype.AddPolyLineData_RealTime = function(lineid,data)
{
var dX = this.XLength/(this.defaultNum-1);//
var dY = this.YLength/(this.yAxisAtt.maxValue-this.yAxisAtt.minValue);
var beginX = 1400;
var beginY = this.yAxisAtt.minValue;
var line = document.getElementById(this.container.id+"_polyLine_"+lineid);
var tips = line.getAttribute('title');
var color = line.getAttribute('strokecolor');
var weight = line.getAttribute('strokeWeight');
/////datas长度应该小于ployLineDataArray即<10.
this.ployLineDataArray.push(18000-(data-beginY)*dY);//加到末尾
if(this.currentNum<this.defaultNum)this.currentNum++;
this.ployLineDataArray.shift();//删除首元素
var pointStr = "Points = '"
for(i=this.defaultNum-this.currentNum;i<this.defaultNum;i++)
pointStr+=(beginX+i*dX)+","+this.ployLineDataArray[i]+" ";
pointStr += "'";
$("#"+this.container.id+"_lineCanvas_"+lineid).empty();
//重新画曲线
var owidth = 200;
var oheight = owidth*this.width/this.height;
var mouseEvent = '';
for(i=this.defaultNum-this.currentNum;i<this.defaultNum;i++)
{
//曲线端点为空心圆
mouseEvent = "title='"+xRound(beginY+(18000-this.ployLineDataArray[i])/dY,this.yAxisAtt.precision)+"'";
var node = document.createElement("<v:oval id='"+this.container.id+"_polyNode_"+lineid+"_"+i+"' style='position:relative;left:"+(beginX+i*dX-owidth/2)+"px;top:"+(this.ployLineDataArray[i]-oheight/2)+"px;width:"+owidth+"px;height:"+oheight+"px'strokecolor='"+color+"'strokeweight='2pt'"+mouseEvent+"style='z-index:4'/>");
$("#"+this.container.id+"_lineCanvas_"+lineid).append(node);
}
mouseEvent = "title='"+tips+"'";//onmouseover='mouseover(\""+this.container.id+"_polyLine_"+lineid+"\")'onmouseout='mouseout(\""+this.container.id+"_polyLine_"+lineid+"\")'";
var l = document.createElement("<v:PolyLine id = '"+this.container.id+"_polyLine_"+lineid+"'"+pointStr+mouseEvent+" style='z-index:3'strokeWeight='"+weight+"pt'filled='false' strokecolor='"+color+"'></v:line>");
$("#"+this.container.id+"_lineCanvas_"+lineid).append(l);
}
/////////////////////////////////////////////////
/////////////////////////////////////////////////
function mouseover(line_id,weight)//线id,粗细
{
var line = document.getElementById(line_id);
line.strokeWeight = parseInt(weight)+2;
}
function mouseout(line_id,weight)
{
var line = document.getElementById(line_id);
line.strokeWeight = weight+'pt';
}
//函数作用:数值格式化
//参数含义:待格式化数字,小数保留位数
function xRound(num,n)
{
num = Math.round (num*Math.pow(10,n))/Math.pow(10,n);
return num;
}
c#字符串拼凑的js代码,我也懒得改了,直接搬上来。。。。。。
统计图利用了面向对象的思想,使用步骤如下:
1. 用户可以定义一个LineChart对象chartObj。
scriptStr += "var " + chartObj + " = new LineChart('chart_" + i.ToString() + "',1000,480,null,false,null);";
2. 然后通过相关接口设置显示属性如标题、x轴、y轴。
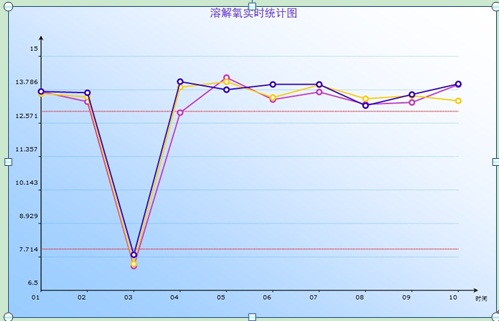
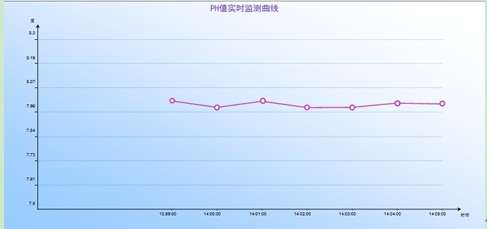
scriptStr += chartObj + ".SetCaptionAtt('" + xn.Attributes["name"].Value + "实时监测曲线',null,null);";
scriptStr += chartObj + ".SetCaptionAtt('" + xn.Attributes["name"].Value + "实时监测曲线',null,null);";
scriptStr += chartObj + ".SetxAxisAtt('时间',null,null,null,null);";
scriptStr += chartObj + ".SetyAxisAtt(" + xn.Attributes["datalower"].Value + "," + xn.Attributes["dataupper"].Value + ",2,'值',null,null,null,6,null);";
3. 调用draw函数绘出基本框架
scriptStr += chartObj + ".Draw();";
4. 添加警示线
scriptStr += chartObj + ".AddWarnLine(" + xn.Attributes["warninglower"].Value + ",'警示下限','red',1,'shortdot');";
scriptStr += chartObj + ".AddWarnLine(" + xn.Attributes["warningupper"].Value + ",'警示上限','red',1,'shortdot');";
5. 添加无数据线对象
scriptStr += chartObj + ".AddNoDataPolyLine('a','" + xd.ChildNodes[0].Attributes["name"].Value + "');";
6. 利用ajax每隔一定时间向每个线对象填充数据,曲线实现左移效果
scriptStr += chartObj + ".AddPolyLineData_RealTime('a'," +xn.ChildNodes[0].Attributes["value"].Value + ");";
7. X轴时间轴与数据同步显示,利用ajax
scriptStr += chartObj + ".AddxAxisLable_RealTime('" + mTime[1] + "');";
scriptStr += chartObj + ".AddxAxisLable_RealTime('" + mTime[1] + "');";
以上是ajax进行实时刷新数据
下面是添加静态数据
string scriptStr = "var datas;datas = new Array();";
XmlNode xn = xd.ChildNodes[0];
for (int j = 0; j < xn.ChildNodes.Count; j++)
scriptStr += "datas.push(" + xn.ChildNodes[j].Attributes["value"].Value + ");";
scriptStr += chartObj + ".AddPolyLine('"+sid + iid + "',datas,'" + xn.Attributes["samname"].Value+ "',null,null);";

 浙公网安备 33010602011771号