

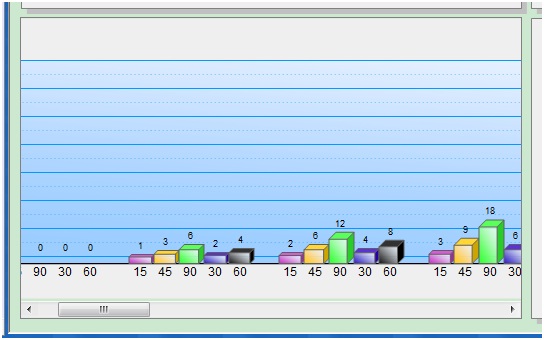
废话不多说,亮点就是内置滚动条,数据大了也没问题。

 代码
代码

/*****************************************************************************************************************
*版本:2D或者3D柱状统计图
*日期:2010.2.13
*作者:孙晓玮
*联系方式:454084563@qq.com
*说明:用VML实现柱状统计图
*目前对高精度数据支持较差
*****************************************************************************************************************/
//画3D柱状图
//参数含义(唯一性ID,数据源数组,图表的宽度,图表的高度,图表标题,X轴单位,Y轴单位)
function RectChart3D(pContainerId,pWidth,pHeight,bg,shadow,hasAss)
{
this.width = pWidth||500;//设置图表宽度、高度
this.height = pHeight||300;
this.bgColor = bg||'#9cf';//设置背景颜色
this.hasShadow = shadow||false;//设置有无阴影
this.hasAssxLine = hasAss||false;//有无坐标辅助线
this.WarnLineNum = 0;//警示线个数
/////////////////////////////实现scroll
var outContainer = document.getElementById(pContainerId);
this.container = document.createElement("<div id='" + pContainerId + "_innerDiv' style='position:absolute;left:0px;top:0px;width:"+this.width+"px;height:"+this.height+"px;overflow:auto;border:1px solid gray;'></div>");
outContainer.appendChild(this.container);
///////////////////////////////////////////////
this.XLength = 15500;//x轴有效范围
this.YLength = 14500;
this.cordSizeX = 20000;
this.dataArray = new Array();//数据数组
this.lableArray = new Array();//长度为dataArray长度
this.titleArray = new Array();//长度为nSeries
this.nSeries = 1;//每组数据的柱子个数
this.rectWidth = 1000;//每个柱子宽度
this.recd_Dx = 1000;//默认每组数据间距
//默认颜色列表
this.defaultColor=new Array("#CC33CC","#FFCC00","#33FF33","#3300CC","33CCFF","#FF6600","#663366","#FF0000","#33CCCC","#990099","#CCFF66","009933","996600","#FF66FF","#003300","#Yellow","#Lime","Navy","#Blue");
//设置标题及其属性(字体大小,颜色)
this.CaptionAtt = {
value:'',
fontSize:18,
fontColor:'#6633FF'
};
//设置y轴颜色及其其他属性,最小值,最大值,数据精度(小数位数),单位,坐标以及其属性(字体大小,颜色)
this.yAxisAtt = {
minValue:0,
maxValue:0,
precision:0,
color:'#000000',
weight:1,
unit:'',
fontSize:7,
fontColor:'#000000'
}
//设置x轴颜色及其其他属性,单位,单位以及其属性(字体大小,颜色)
this.xAxisAtt = {
color:'#000000',
weight:1,
unit:'',
fontSize:7,
fontColor:'#000000'
}
//设置横向坐标辅助线属性
this.xAssLineAtt = {
color:'#0099FF',
weight:0.5,
type:'shortdot'
}
}
/////////////////////////////////////////////////////////
/////属性设置接口
////////////////////////////////////////////////////////
//设置标题属性
RectChart3D.prototype.SetCaptionAtt = function(value,fs,fc)
{
this.CaptionAtt.value = value;
this.CaptionAtt.fontSize = (fs==null?20:fs);
this.CaptionAtt.fontColor = (fc==null?'#6633FF':fc);
}
/////////////////////////////////////////////////
//设置y轴颜色及其其他属性,最小值,最大值,数据精度(小数位数),单位,颜色,粗细,字体大小,字体颜色
RectChart3D.prototype.SetyAxisAtt = function(min,max,pre,u,c,w,fs,fc)
{
this.yAxisAtt.minValue = min;
this.yAxisAtt.maxValue = max;
this.yAxisAtt.precision = pre;
this.yAxisAtt.unit = u;
this.yAxisAtt.weight = (w==null?1:w);//w||1;
this.yAxisAtt.color = (c==null?'#000000':c);//c||;
this.yAxisAtt.fontSize = (fs==null?7:fs);//fs||7;
this.yAxisAtt.fontColor = (fc==null?'#000000':fc);//fc||;
}
/////////////////////////////////////////////////
//设置x轴颜色及其其他属性,单位,单位以及其属性(字体大小,颜色)
RectChart3D.prototype.SetxAxisAtt = function(u,fs,c,fc,w)
{
this.xAxisAtt.unit = u;
this.xAxisAtt.weight = (w==null?1:w);//w||1;
this.xAxisAtt.color = (c==null?'#000000':c);//c||'#000000';
this.xAxisAtt.fontSize = (fs==null?7:fs);//fs||7;
this.xAxisAtt.fontColor = (fc==null?'#000000':fc);//fc||'#000000';
}
/////////////////////////////////////////////////
//设置横向坐标辅助线属性
RectChart3D.prototype.SetxAssLineAtt = function(c,w,t)
{
this.xAssLineAtt.color = (c==null?'#0099FF':c);//c||'#0099FF';
this.xAssLineAtt.weight = (w==null?0.5:w);//w||0.5;
this.xAssLineAtt.type = (t==null?'shortdot':t);//t||'shortdot';
}
/////////////////////////////////////////////////
//添加警示线,设置警示线属性,以及警示线提示text
RectChart3D.prototype.AddWarnLine = function(l,tip,c,w,ty)//位置,颜色,粗细,类型,鼠标提示(虚线,实线等dot,dash,dashdot,shortdot,shortdash)
{
var dY = (this.yAxisAtt.maxValue-this.yAxisAtt.minValue)/this.YLength;
var beginY = this.yAxisAtt.minValue;
var beginX = 1400;
var location = 18000-(l-beginY)/dY;//实际坐标转换为屏幕坐标
var color = (c==null?'red':c);//
var weight =(w==null?1:w);//
var type = (ty==null?'solid':ty);
var tips = (tip==null?'':tip);
var mouseEvent = "title='"+tips+":"+xRound(l,this.yAxisAtt.precision)+"'onmouseover='mouseover(\""+this.container.id+"_WarnLine_"+this.WarnLineNum+"\",\""+weight+"\")'onmouseout='mouseout(\""+this.container.id+"_WarnLine_"+this.WarnLineNum+"\",\""+weight+"\")'";
var line = document.createElement("<v:line id='"+this.container.id+"_WarnLine_"+this.WarnLineNum+"' "+mouseEvent+" from='1400,"+location+"' to='18200,"+location+"' style='z-index:2'strokeWeight="+weight+"pt strokecolor='"+color+"'></v:line>");
line.innerHTML = "<v:Stroke dashstyle='"+type+"'/>";
this.warnLineCanvas.appendChild(line);
this.WarnLineNum++;//警示线个数,用于设置ID
}
RectChart3D.prototype.SetData = function(datas,titles,series,lables,rectwidth)//数据数组,维数应该是series,每隔柱子宽度
{
this.dataArray = datas;
this.titleArray = titles;
this.lableArray = lables;
this.nSeries = series||1;
this.rectWidth = rectwidth||1000;//默认值
/////////////////////////////实现scroll 核心思想//////////////////////////
/////根据数据 动态改变canvas的cordsize
/////////////////////////////////////////////////////////////////////////
var tmp = 5000+datas.length*this.nSeries*this.rectWidth+(datas.length-1)*this.recd_Dx;
if (tmp>20000)this.cordSizeX = tmp;
this.XLength = this.cordSizeX-4500;//x轴有效范围
this.YLength = 14500;
}
//////画框架
RectChart3D.prototype.Draw = function()//显示空白图
{
//创建画布内置坐标范围20000,20000///////////////////////////////////////////////////////////
this.canvas=document.createElement("<v:group id='" + this.container.id + "_Canvas' style='position:absolute;left:0px;top:0px;width:"+this.cordSizeX/40+"px;height:"+(this.height-20)+"px;'coordsize = '"+this.cordSizeX+",20000'></v:group>");
var shapeType = document.createElement("<v:shapetype id='" + this.container.id + "_Box' coordsize='21600,21600' o:spt='16' adj='6000'></v:shapetype>");//adj立体前后宽度
//大背景/////////
var background = document.createElement("<v:rect id='" + this.container.id + "_background' style='position:absolute;left:0px;top:0px;width:"+this.cordSizeX+"px;height:20000px;' fillcolor='#EFEFEF'stroked='f' strokecolor='gray'></v:rect>");
if (this.hasShadow){
background.appendChild(document.createElement("<v:shadow on='t' type='single' color='silver' offset='4pt,4pt'/>"));
}
this.canvas.appendChild(background);
this.canvas.appendChild(shapeType);
//标题///////////////////////////////////////////////////////////
var caption=document.createElement("v:rect");
caption.style.position='relative';
caption.style.top='200px';
caption.style.left='0px';
caption.style.width=this.cordSizeX+'px';
caption.style.height='1500px';
caption.filled='f';
caption.stroked='false';
var captiontext=document.createElement("v:TextBox");
captiontext.inset='0pt,0pt,0pt,0pt';
var ctdiv = document.createElement("<div style='FONT-SIZE:"+this.CaptionAtt.fontSize+"px;COLOR:"+this.CaptionAtt.fontColor+";WORD-BREAK;FONT-FAMILY:黑体;vertical-align:middle; text-align:center;'></div>");
ctdiv.innerHTML = this.CaptionAtt.value;
captiontext.appendChild(ctdiv);
caption.appendChild(captiontext);
this.canvas.appendChild(caption);//alert(this.canvas.style.height);
//背景与箭头
var back = document.createElement("<v:rect id='" + this.container.id + "_back' style='position:absolute;left:2000px;top:3000px;width:"+(this.cordSizeX-4000)+"px; height:14500px;' fillcolor='#9cf' strokecolor='#DFDFDF'></v:rect>");
back.innerHTML = "<v:fill rotate='t' angle='-45' focus='100%' type='gradient'/>";
this.canvas.appendChild(back);
var XXX = document.createElement("<v:line ID='" + this.container.id + "_X' from='2000,17500' to='"+(this.cordSizeX-1000)+",17500' style='z-index:2' strokecolor='#000000' strokeWeight=1pt></v:line>");//
XXX.innerHTML = "<v:stroke EndArrow='Classic'/>";
var YYY = document.createElement("<v:line ID='" + this.container.id + "_Y' from='2000,17500' to='2000,2000' style='z-index:2' strokecolor='#000000' strokeWeight=1pt></v:line>");
YYY.innerHTML = "<v:stroke EndArrow='Classic'/>";
this.canvas.appendChild(XXX);
this.canvas.appendChild(YYY);
//X轴与Y轴的单位
var XXXunit = document.createElement("<v:Rect style='position:absolute;left:300px;top:1300px;width:1500px;height:1000px' fillcolor='red' filled = 'f' stroked='false'></v:Rect>");
XXXunit.innerHTML = "<v:TextBox inset='0pt,0pt,0pt,0pt' style='font-size:9pt;'><div style='vertical-align:middle; text-align:right;'>"+this.yAxisAtt.unit+"</div></v:TextBox>";
var YYYunit = document.createElement("<v:Rect style='position:absolute;left:"+(this.cordSizeX-1500)+"px;top:18200px;width:1400px;height:1000px'fillcolor='red' filled = 'f' stroked='false'></v:Rect>");
YYYunit.innerHTML = "<v:TextBox inset='0pt,0pt,0pt,0pt' style='font-size:9pt;'><div style='vertical-align:middle; text-align:left;'>"+this.xAxisAtt.unit+"</div></v:TextBox>";
this.canvas.appendChild(XXXunit);
this.canvas.appendChild(YYYunit);
//画6条横坐标以及纵坐标刻度
var yLableNum = 8;
var beginY = this.yAxisAtt.maxValue;
var dY = (this.yAxisAtt.maxValue-this.yAxisAtt.minValue)/(yLableNum-1);
for(i=0; i<yLableNum; i++)
{
var l1 = document.createElement("<v:line from='1900,"+(i*2000+3500)+"' to='2000,"+(i*2000+3500)+"' style='z-index:2' strokecolor='#000000'></v:line>");
var l2 = document.createElement("<v:line from='2000,"+(i*2000+3500)+"' to='2500,"+(i*2000+3000)+"' style='z-index:2' strokecolor='#0099FF'></v:line>");
var l3 = document.createElement("<v:line from='2500,"+(i*2000+3000)+"' to='"+(this.cordSizeX-2000)+","+(i*2000+3000)+"' style='z-index:2' strokecolor='#0099FF'></v:line>");
var l4 = document.createElement("<v:line from='2500,"+(i*2000+4000)+"' to='"+(this.cordSizeX-2000)+","+(i*2000+4000)+"' style='z-index:2' strokecolor='#0099FF'></v:line>");
var stroke = document.createElement("<v:stroke dashstyle='Dot'/>");
l4.appendChild(stroke);
//纵坐标
var r1 = document.createElement("<v:Rect style='position:relative;left:100px;top:"+(i*2000+2800)+"px;width:1700px;height:800px' fillcolor='red' filled = 'f' stroked='false'></v:Rect>");
var t1 = document.createElement("<v:TextBox inset='0pt,0pt,0pt,0pt' style='font-size:7pt;'></v:TextBox>");
var d1 = document.createElement("<div style='vertical-align:middle; text-align:right;'></div>");
d1.innerHTML = xRound(beginY-i*dY,this.yAxisAtt.precision);
t1.appendChild(d1);
r1.appendChild(t1);
if(i!=yLableNum-1)
{
this.canvas.appendChild(l1);
this.canvas.appendChild(l4);
}
this.canvas.appendChild(r1);
this.canvas.appendChild(l2);
this.canvas.appendChild(l3);
}
//纵线 3D效果
this.canvas.appendChild(document.createElement("<v:line from='2500,3000' to='2500,17000' style='z-index:2' strokecolor='#0099FF'></v:line>"));
//填补左上角小三角形v:shape path='m2000,4000lxe' style='z-index:5' fillcolor='red'
//this.canvas.appendChild(document.createElement("<v:shape coordsize='2000,2000' style='position:absolute;width:500px;height:500px;z-index:3;left:2000px;top:2500px;'stroked='false' fillcolor='red' path='m 2000,4000 l 2500,3500,3500,4000,2000,4000 x e'/></v:shape>"));
this.container.appendChild(this.canvas);
}
/////////////////////////////////////////////////
//////*静态 */整体添加 静态this.XLength = 14500;// = 15500;
RectChart3D.prototype.AddRect = function()
{
this.rectCanvas=document.createElement("<v:group id='" + this.container.id + "_RectCanvas' style='position:absolute;left:0px;top:0px;width:"+this.cordSizeX/40+"px;height:"+(this.height-20)+"px;'coordsize = '"+this.cordSizeX+",20000'></v:group>");
var beginY = this.yAxisAtt.maxValue;
var dY = (this.yAxisAtt.maxValue-this.yAxisAtt.minValue)/this.YLength;
var cureentL = 2500;//当前画图位置
for(i=0; i<this.dataArray.length; i++)
{
for(j=0;j<this.nSeries;j++)
{
//beginY为数据最大值 与 y轴坐标最大值 14000对应
//数据个数为 num 与 x轴 坐标最大值 15000 对应
//宽度最大设置为2500 最小为
var currentValue = this.dataArray[i][j]||0;
var iHeight = parseInt(currentValue/dY);
//柱子
var rectColor = this.defaultColor[j]; //默认同组柱子颜色不容
if(this.nSeries==1)//每组只有1个数据的话 每个柱子要用不同颜色
rectColor = this.defaultColor[i%this.defaultColor.length];
var s1 = document.createElement("<v:shape id='" + this.container.id + "_Box_"+i+"' type='#" + this.container.id + "_Box' fillcolor='"+rectColor+"' strokecolor='#5f5f5f' style='position:relative; left:"+cureentL+"px;top:"+(17000-iHeight)+"px;width:"+this.rectWidth+"px;height:"+(iHeight+500)+"px;z-index:5' title='" + this.titleArray[i] + "'></v:shape>");
var f1 = document.createElement("<v:fill o:opacity2='52429f' rotate='t' angle='-45' focus='100%' type='gradient'/>");
s1.appendChild(f1);
//value
var value = document.createElement("<v:Rect style='position:relative;left:"+cureentL+"px;top:"+(16000-iHeight)+"px;width:1000px;height:800px' fillcolor='red' filled = 'f' stroked='false'></v:Rect>");
var tb1 = document.createElement("<v:TextBox inset='0pt,0pt,0pt,0pt' style='font-size:7pt;'></v:TextBox>");
tb1.innerHTML = "<div style='vertical-align:middle;text-align:center;'>"+currentValue+"</div>";
value.appendChild(tb1);
//name
var name = document.createElement("<v:Rect style='position:relative;left:"+cureentL+"px;top:17600px;width:1000px;height:1000px' fillcolor='red' filled = 'f' stroked='false'></v:Rect>");
var tb2 = document.createElement("<v:TextBox inset='0pt,0pt,0pt,0pt' style='font-size:9pt;'></v:TextBox>");
tb2.innerHTML = "<div style='vertical-align:middle;text-align:center;'>"+this.lableArray[j]+"</div>";
name.appendChild(tb2);
if (iHeight!=0)//0的话不显示柱子
this.rectCanvas.appendChild(s1);
this.rectCanvas.appendChild(value);
this.rectCanvas.appendChild(name);
cureentL += this.rectWidth;
}
cureentL += this.recd_Dx;
}
this.container.appendChild(this.rectCanvas);
}
RectChart3D.prototype.ClearAllRect = function()
{
this.rectCanvas.innerHTML="";
}
下面是调用
代码
<%@ Page Language="C#" AutoEventWireup="true" CodeBehind="HistoryStatistic.aspx.cs" Inherits="VmlProject.HistoryStatistic" %>
<!DOCTYPE html PUBLIC "-//W3C//DTD XHTML 1.0 Transitional//EN" "http://www.w3.org/TR/xhtml1/DTD/xhtml1-transitional.dtd">
<html xmlns:v="urn:schemas-microsoft-com:vml" xmlns:o="urn:schemas-microsoft-com:office:office">
<head id="Head1" runat="server">
<style type="text/css">
v\:*
{
behavior: url(#default#VML);
}
o\:*
{
behavior: url(#default#VML);
}
body
{
font-family: arial;
}
</style>
<meta http-equiv="Content-Type" content="text/html; charset=gb2312" />
<title>无标题页</title>
<script src="js/jquery.js" type="text/javascript"></script>
<script src="js/PieChart.js" type="text/javascript"></script>
<script src="js/RectChart3D.js" type="text/javascript"></script>
<script src="js/RectChart.js" type="text/javascript"></script>
</head>
<body>
<form id="form1" runat="server">
<div>
<div id="div1" style="position:relative; float:left;"></div>
<div id="div2" style="position:relative; float:left;margin-left:10px;"></div>
<div id="div3" style="position:relative; margin-top:10px; float:left; width:500px; height:300px;"></div>
<div id="div4" style="position:relative; float:left;margin-top:10px; margin-left:10px;"></div>
</div>
<script language="javascript" type="text/javascript">
var pData = new Array();
for(i=0;i<10;i++)
{
var oData=new Object();
oData[0]=i*100;
oData[1]=Math.random()*10;
pData[i]=oData;
}
DrawPieChart("div1",500,300,pData,"3D饼图","元","3D");
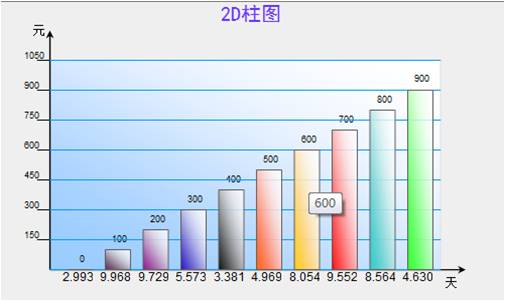
DrawPieChart("div2",500,300,pData,"2D饼图","元","2D");
DrawRectChart("div4",pData,500,300,"2D柱图", "天", "元","2D")
//////////////////////////////////////////////////////////
pData = new Array();
var oData;
for(i=0;i<16;i++)
{
oData=new Object();
oData[0]=i;
oData[1]=i*3;
oData[2]=i*6;
oData[3]=i*2;
oData[4]=i*4;
pData[i]=oData;
}
var aaa = new RectChart3D('div3',500,300,null,false,null);
aaa.SetCaptionAtt('实时监测柱状图',null,null);
aaa.SetxAxisAtt('时间',null,null,null,null);
aaa.SetyAxisAtt(0,100,2,'值',null,null,null,6,null);
aaa.SetData(pData,pData,5,oData);
aaa.Draw();
aaa.AddRect();
</script>
</form>
</body>
</html>
<!DOCTYPE html PUBLIC "-//W3C//DTD XHTML 1.0 Transitional//EN" "http://www.w3.org/TR/xhtml1/DTD/xhtml1-transitional.dtd">
<html xmlns:v="urn:schemas-microsoft-com:vml" xmlns:o="urn:schemas-microsoft-com:office:office">
<head id="Head1" runat="server">
<style type="text/css">
v\:*
{
behavior: url(#default#VML);
}
o\:*
{
behavior: url(#default#VML);
}
body
{
font-family: arial;
}
</style>
<meta http-equiv="Content-Type" content="text/html; charset=gb2312" />
<title>无标题页</title>
<script src="js/jquery.js" type="text/javascript"></script>
<script src="js/PieChart.js" type="text/javascript"></script>
<script src="js/RectChart3D.js" type="text/javascript"></script>
<script src="js/RectChart.js" type="text/javascript"></script>
</head>
<body>
<form id="form1" runat="server">
<div>
<div id="div1" style="position:relative; float:left;"></div>
<div id="div2" style="position:relative; float:left;margin-left:10px;"></div>
<div id="div3" style="position:relative; margin-top:10px; float:left; width:500px; height:300px;"></div>
<div id="div4" style="position:relative; float:left;margin-top:10px; margin-left:10px;"></div>
</div>
<script language="javascript" type="text/javascript">
var pData = new Array();
for(i=0;i<10;i++)
{
var oData=new Object();
oData[0]=i*100;
oData[1]=Math.random()*10;
pData[i]=oData;
}
DrawPieChart("div1",500,300,pData,"3D饼图","元","3D");
DrawPieChart("div2",500,300,pData,"2D饼图","元","2D");
DrawRectChart("div4",pData,500,300,"2D柱图", "天", "元","2D")
//////////////////////////////////////////////////////////
pData = new Array();
var oData;
for(i=0;i<16;i++)
{
oData=new Object();
oData[0]=i;
oData[1]=i*3;
oData[2]=i*6;
oData[3]=i*2;
oData[4]=i*4;
pData[i]=oData;
}
var aaa = new RectChart3D('div3',500,300,null,false,null);
aaa.SetCaptionAtt('实时监测柱状图',null,null);
aaa.SetxAxisAtt('时间',null,null,null,null);
aaa.SetyAxisAtt(0,100,2,'值',null,null,null,6,null);
aaa.SetData(pData,pData,5,oData);
aaa.Draw();
aaa.AddRect();
</script>
</form>
</body>
</html>
原作谁记不清了,感谢原作


【推荐】国内首个AI IDE,深度理解中文开发场景,立即下载体验Trae
【推荐】编程新体验,更懂你的AI,立即体验豆包MarsCode编程助手
【推荐】抖音旗下AI助手豆包,你的智能百科全书,全免费不限次数
【推荐】轻量又高性能的 SSH 工具 IShell:AI 加持,快人一步
· AI与.NET技术实操系列:向量存储与相似性搜索在 .NET 中的实现
· 基于Microsoft.Extensions.AI核心库实现RAG应用
· Linux系列:如何用heaptrack跟踪.NET程序的非托管内存泄露
· 开发者必知的日志记录最佳实践
· SQL Server 2025 AI相关能力初探
· winform 绘制太阳,地球,月球 运作规律
· 震惊!C++程序真的从main开始吗?99%的程序员都答错了
· AI与.NET技术实操系列(五):向量存储与相似性搜索在 .NET 中的实现
· 超详细:普通电脑也行Windows部署deepseek R1训练数据并当服务器共享给他人
· 【硬核科普】Trae如何「偷看」你的代码?零基础破解AI编程运行原理