cesium之城市行政划分
有时我们在某些项目时会用到比如不同的城市用不同色块的划分
1.最基本的颜色显示,效果如下

实现方法;比较简单,话不多说直接奉上代码
// 设置相机的位置
viewer.camera.setView({
destination: new Cesium.Cartesian3(-2901829.875235737, 6563113.216422777, 2505746.0713313515),
orientation: {
heading: 6.246860670169031, // east, default value is 0.0 (north)
pitch: -1.31247449966936, // default value (looking down)
roll: 0.0 // default value
}
});
viewer.dataSources.add(Cesium.GeoJsonDataSource.load('./SampleData/guangdong.json', {
stroke: Cesium.Color.WHITE,//设置多边形轮廓的默认颜色
fill: Cesium.Color.RED.withAlpha(0.5),//多边形的内部默认颜色
strokeWidth: 20,//轮廓的宽度
clamToGround: true//让地图贴地
}));
2.加载颜色的同时显示城市的标签,便签的信息是从json文件里获取的,效果如下

// 设置相机的位置
viewer.camera.setView({
destination: new Cesium.Cartesian3(-2901829.875235737, 6563113.216422777, 2505746.0713313515),
orientation: {
heading: 6.246860670169031, // east, default value is 0.0 (north)
pitch: -1.31247449966936, // default value (looking down)
roll: 0.0 // default value
}
});
Cesium.GeoJsonDataSource.load('./SampleData/guangdong.json').then(function (dataSource) {
viewer.dataSources.add(dataSource);//// 先添加对象
var entities = dataSource.entities.values;// 获取所有对象
//console.log(entities);
for (var i = 0; i < entities.length; i++) {
var entity = entities[i];
// 得到每块多边形的坐标集合
var polyPositions = entity.polygon.hierarchy.getValue(Cesium.JulianDate.now()).positions;
// 根据坐标集合构造BoundingSphere获取中心点坐标
var polyCenter = Cesium.BoundingSphere.fromPoints(polyPositions).center;
// 将中心点拉回到地球表面
polyCenter = Cesium.Ellipsoid.WGS84.scaleToGeodeticSurface(polyCenter);
viewer.entities.add({
position: polyCenter,
label: {
font: '24px sans-serif',
text: entity.properties.name,
showBackground: true,
scale: 0.6,
horizontalOrigin: Cesium.HorizontalOrigin.CENTER,
verticalOrigin: Cesium.VerticalOrigin.BOTTOM
}
})
}
});
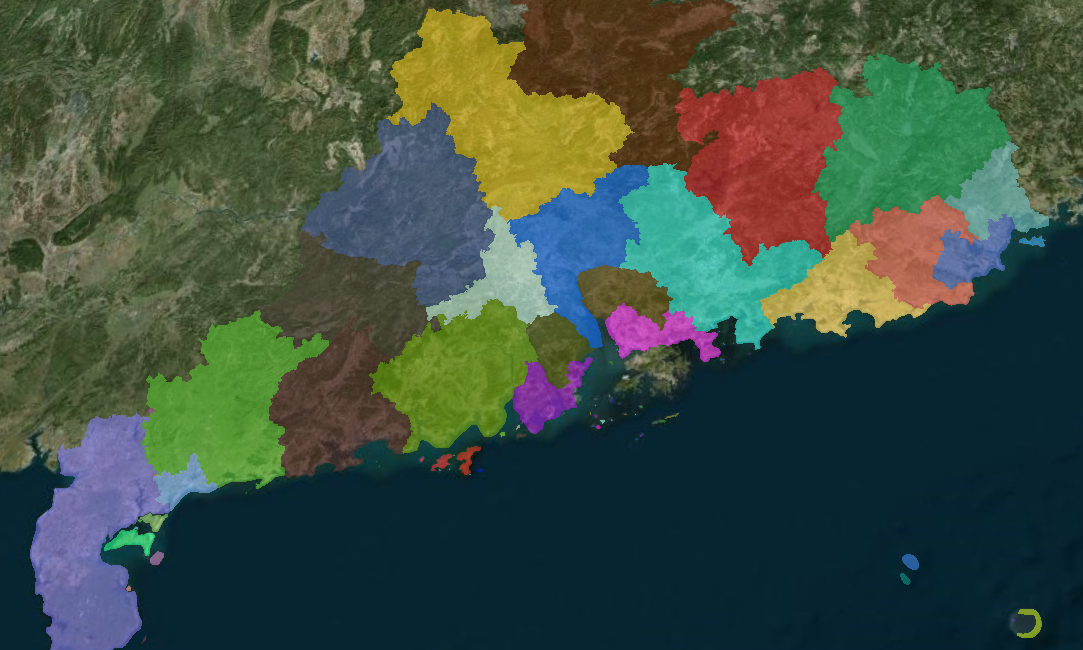
3.不同的省份,不同的颜色块,我使用的是随机,也可自定义。效果如下
Cesium.GeoJsonDataSource.load('./SampleData/guangdong.json').then(function (dataSource) {
viewer.dataSources.add(dataSource);
var entities = dataSource.entities.values;//获取区块
for (var i = 0; i < entities.length; i++) {
var entity = entities[i];
var color = Cesium.Color.fromRandom({ alpha: 0.6 });//随机生成一个颜色且透明度为0.6
entity.polygon.material = color;//将随机产生的颜色赋予多边形
entity.polygon.outline = false;//是否显示多边形的轮廓
}
})
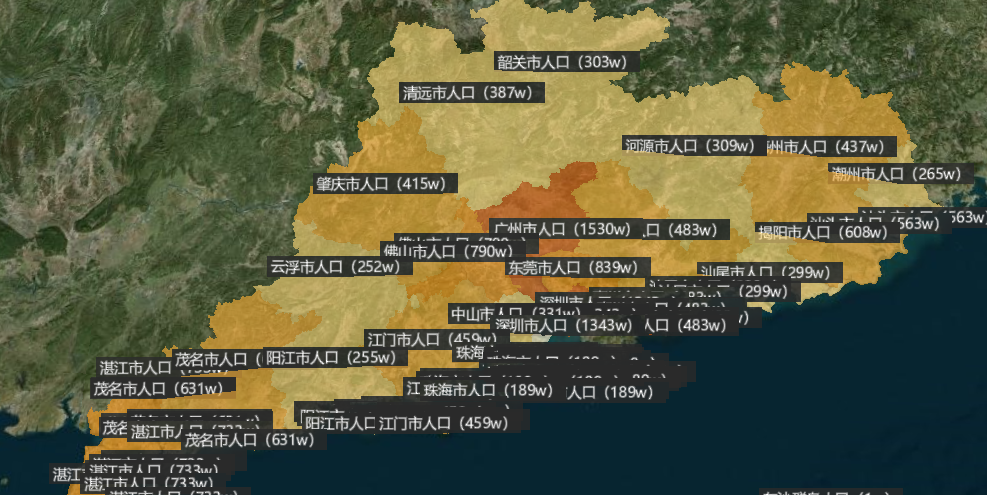
4.在便签上添加人口的数量
本次人口的数据我是在后台写了个接口访问数据,网上方法很多,具体方法可百度
代码
var guangdongEntity = res.body;//获取数据库数据的数组对象
Cesium.GeoJsonDataSource.load('./SampleData/guangdong.json').then(function (dataSource) {
viewer.dataSources.add(dataSource);//添加实体(数据块)对象 没有将无法加载数据块,标签例外
var entities = dataSource.entities.values;//获取数据里的所有对象
console.log(entities);
for (var i = 0; i < entities.length; i++) {
var entity = entities[i];
var persons = guangdongEntity[i].persons;//获取数据库里的人口值
var color = null;
if (persons <= 200) {
color = Cesium.Color.fromCssColorString("#fff2d3").withAlpha(0.6);
} else if (persons <= 400) {
color = Cesium.Color.fromCssColorString("#fed976").withAlpha(0.6);
} else if (persons <= 700) {
color = Cesium.Color.fromCssColorString("#feb337").withAlpha(0.6);
} else if (persons <= 1000) {
color = Cesium.Color.fromCssColorString("#fe9914").withAlpha(0.6);
} else if (persons <= 1600) {
color = Cesium.Color.fromCssColorString("#e56213").withAlpha(0.6);
} else {
color = Cesium.Color.fromCssColorString("#cb2f11").withAlpha(0.6);
}
entity.polygon.material = color;//将颜色赋予多边形
entity.polygon.outline = false;//是否显示边框
var polyPositions = entity.polygon.hierarchy.getValue(Cesium.JulianDate.now()).positions;
var polyCenter = Cesium.BoundingSphere.fromPoints(polyPositions).center;
polyCenter = Cesium.Ellipsoid.WGS84.scaleToGeodeticSurface(polyCenter);
viewer.entities.add({
position: polyCenter,
label: {//标签
font: "24px sans-serif",
text: entity.properties.name + "人口(" + persons + "w)",
showBackground: true,
scale: 0.6,
horizontalOrigin: Cesium.HorizontalOrigin.CENTER,
verticalOrigin: Cesium.VerticalOrigin.BOTTOM
}
})
}
5.根据人口的大小设定颜色块的高度(更直观)

代码如下
var guangdongEntity = res.body;//获取数据库数据的数组对象
console.log(guangdongEntity);
Cesium.GeoJsonDataSource.load('./SampleData/guangdong.json').then(function (dataSource) {
viewer.dataSources.add(dataSource);//添加对象
var entities = dataSource.entities.values;//获取数据块所有对象
for (var i = 0; i < entities.length; i++) {
var entity = entities[i];
var persons = guangdongEntity[i].persons;//获取人数
// var color=null;
// if(persons<=500){
// color=Cesium.Color.fromCssColorString("#e35f1c").withAlpha(0.6);
// }else if(persons<=700){
// color=Cesium.Color.fromCssColorString("#9a8d25").withAlpha(0.6);
// }else if(persons<=900){
// color=Cesium.Color.fromCssColorString("#2d7d57").withAlpha(0.6);
// }else if(persons<=1100){
// color=Cesium.Color.fromCssColorString("#0fe8d9").withAlpha(0.6);
// }else if(persons<=1300){
// color=Cesium.Color.fromCssColorString("#003e78").withAlpha(0.6);
// }else if(persons<1500){
// color=Cesium.Color.fromCssColorString("#6f1f72").withAlpha(0.6);
// }else if(persons<=1700){
// color=Cesium.Color.fromCssColorString("#e77fb0").withAlpha(0.6);
// }
var color = Cesium.Color.fromRandom({ alpha: 0.6 });//随机生成一个颜色且透明度为0.6
entity.polygon.material = color;//设置颜色
entity.polygon.outline = false;//是否显示边框
entity.polygon.extrudedHeight = (guangdongEntity[i].persons) * 100;//设置多边形色块的高度
var JulianDate = Cesium.JulianDate.now();//获取朱利安时间(北京时间-8
var polyPositions = entity.polygon.hierarchy.getValue(JulianDate).positions;//
var polyCenter = Cesium.BoundingSphere.fromPoints(polyPositions).center;//获取多边形的中心
polyCenter = Cesium.Ellipsoid.WGS84.scaleToGeodeticSurface(polyCenter);
polyCenter = Cesium.Cartographic.fromCartesian(polyCenter);
polyCenter.height = (guangdongEntity[i].persons) * 100 + 10;//设置标签高度
polyCenter = Cesium.Cartographic.toCartesian(polyCenter);
viewer.entities.add({
position: polyCenter,//多边形中心点的位置
label: {//标签
font: "20px sans-serif",
text: entity.properties.name + "人口(" + persons + "w)",
showBackground: true,
scale: 0.6,//标签的大小的放大倍数
horizontalOrigin: Cesium.HorizontalOrigin.CENTER,
verticalOrigin: Cesium.VerticalOrigin.BOTTOM/
}
})
}
})

 浙公网安备 33010602011771号