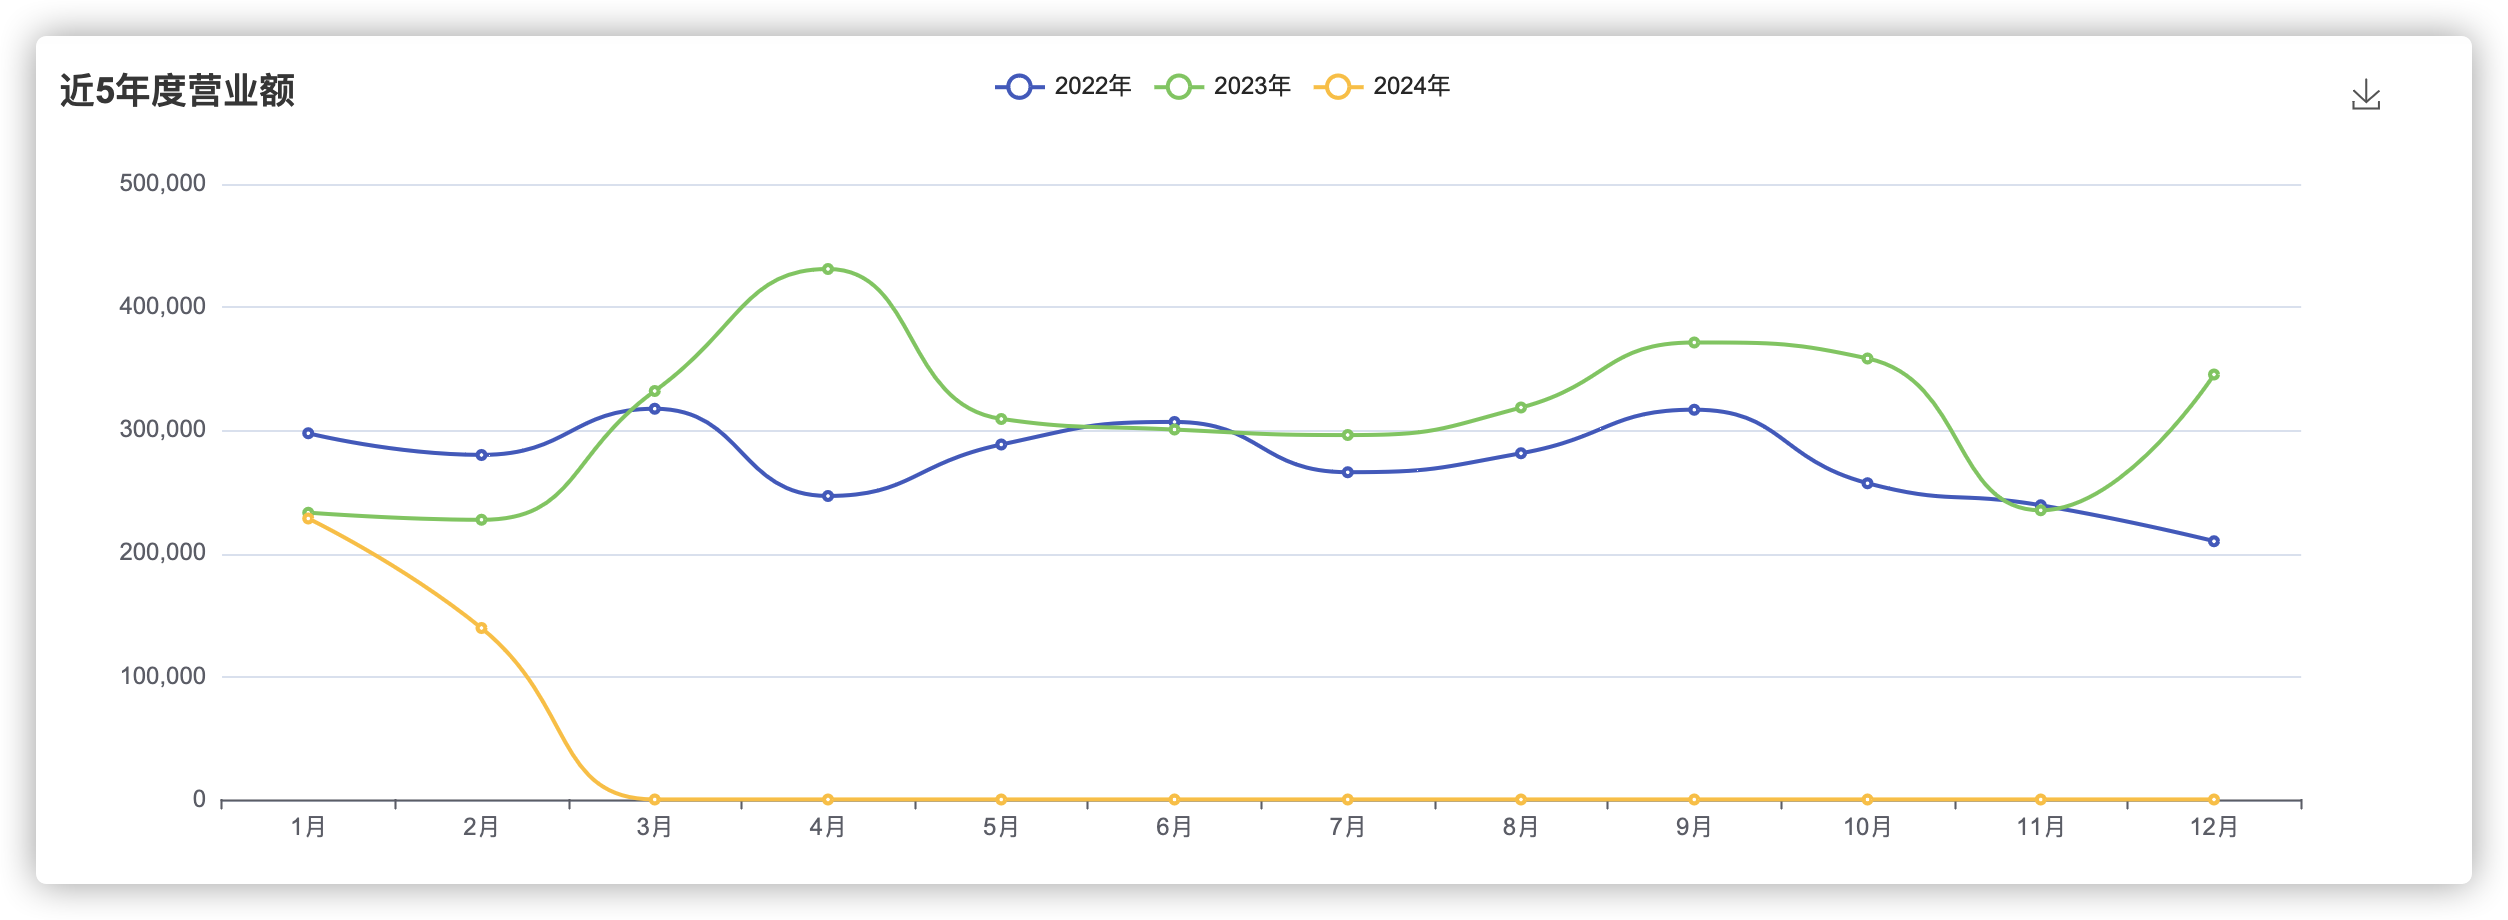
echats年度销售业绩按月显示
一个需求就是把近几年的每月的销售总额进行统计并进行图形展示,具体代码如下
performances = models.Performance.objects.annotate(
        year=ExtractYear('create_time'),
        month=ExtractMonth('create_time')
    ).values('year', 'month').annotate(
        total_complete_pay=Sum('complete_pay')
    ).order_by('year', 'month')

    data = []
    current_year = None
    current_data = []

    for performance in performances:
        year = performance['year']
        month = performance['month']
        total_complete_pay = performance['total_complete_pay']

        if current_year is None:
            current_year = year
            current_data = [0] * 12

        if year != current_year:
            data.append({
                'name': str(current_year) + '年',
                'type': 'line',
                # 'stack': 'none',
                'smooth': 'true',
                'data': current_data
            })
            current_year = year
            current_data = [0] * 12

        # current_data[month - 1] = total_complete_pay
        current_data[month - 1] = '{:.2f}'.format(total_complete_pay)

    if current_year is not None:
        data.append({
            'name': str(current_year) + '年',
            'type': 'line',
            # 'stack': 'none',
            'smooth': 'true',
            'data': current_data
        })
    print(data)  # 添加调试语句,检查数据
前端代码如下:
<script>
                var data = {{ data|safe }};

                var myChart = echarts.init(document.getElementById('main'));
                var option = {
                    title: {
                        text: '近5年度营业额'
                    },
                    tooltip: {
                        trigger: 'axis'
                    },
                    legend: {
                        data: data.map(function(item) { return item.name; })
                    },
                    grid: {
                        left: '3%',
                        right: '4%',
                        bottom: '3%',
                        containLabel:true
                      },
                      toolbox: {
                        feature: {
                          saveAsImage: {}
                        }
                      },
                    xAxis: {
                        type: 'category',
                        data: ['1月', '2月', '3月', '4月', '5月', '6月', '7月', '8月', '9月', '10月', '11月', '12月']
                    },
                    yAxis: {
                        type: 'value'
                    },
                    series: data
                };

                myChart.setOption(option);
            </script>
本文来自博客园,作者:super_ip,转载请注明原文链接:https://www.cnblogs.com/superip/p/18016703

 浙公网安备 33010602011771号