一、简介
在对地理信息数据处理时,常常会遇到对线进行平滑和简化的操作。线的平滑可以使用拟合或插值来完成。多段线(Polyline)简化算法可以帮助我们减少Polyline的点数,从而降低输入规模。对多段线简化算法,通常的做法是在一定的近似精度下,删除一些点或者边。
二、线的平滑
插值和拟合有所不同。插值就是根据原有数据进行填充,最后生成的曲线一定过原有点。拟合是通过原有数据,调整曲线系数,使得曲线与已知点集的差别(最小二乘)最小,最后生成的曲线不一定经过原有点。
1 插值
实现所需的库
numpy、scipy、matplotlib
方法
- nearest:最邻近插值法
- zero:阶梯插值
- slinear:线性插值
- quadratic、cubic:2、3阶B样条曲线插值
代码实现
# -*- coding: utf-8 -*-

# 调用模块
# 调用数组模块
import numpy as np
# 实现插值的模块
from scipy import interpolate
# 画图的模块
import matplotlib.pyplot as plt
# 生成随机数的模块
import random

# random.randint(0, 10) 生成0-10范围内的一个整型数
# y是一个数组里面有10个随机数,表示y轴的值
y = np.array([random.randint(0, 10) for _ in range(10)])
# x是一个数组,表示x轴的值
x = np.array([num for num in range(10)])

# 插值法之后的x轴值,表示从0到9间距为0.5的18个数
xnew = np.arange(0, 9, 0.5)

"""
kind方法:
nearest、zero、slinear、quadratic、cubic
实现函数func
"""
func = interpolate.interp1d(x, y, kind='cubic')
# 利用xnew和func函数生成ynew,xnew的数量等于ynew数量
ynew = func(xnew)

# 画图部分
# 原图
plt.plot(x, y, 'ro-')
# 拟合之后的平滑曲线图
plt.plot(xnew, ynew)
plt.show()
注意事项
- x, y为原来的数据(少量)
- xnew为一个数组,条件:x⊆⊆xnew
- 如:x的最小值为-2.931,最大值为10.312;则xnew的左边界要小于-2.931,右边界要大于10.312。当然也最好注意一下间距,最好小于x中的精度
- func为函数,里面的参数x、y、kind,x,y就是原数据的x,y,kind为需要指定的方法。
- ynew需要通过xnew数组和func函数来生成
- 理论上xnew数组内的值越多,生成的曲线越平滑
2 拟合
SciPy函数库在NumPy库的基础上增加了众多的数学、科学以及工程计算中常用的库函数。例如线性代数、常微分方程数值求解、信号处理、图像处理、稀疏矩阵等等。提供了基于数组是算法级应用 矩阵运算,线性代数 最优化方法,聚类 空间运算,快速傅里叶变换。
import  scipy as sp
import matplotlib.pyplot as plt


data = sp.genfromtxt('data/web_traffic.tsv',delimiter="\t")
# print(data.shape)# 读取数组长度
x= data[:,0]#训练数据集
y= data[:,1] #输出数据
sp.sum(sp.isnan(y))# 显示无效值
x = x[~sp.isnan(y)] # 对数组取反 只选择合法项
y = y[~sp.isnan(y)]


#最小二乘法函数
def error(f, x, y):
    return sp.sum((f(x) - y) ** 2)
fp1, res, rank, sv, rcond = sp.polyfit(x, y, 1, full=True)  #生成一阶曲线

#根据数据生成N阶曲线
f1=sp.poly1d(fp1)

f2p =sp.polyfit(x,y,2)  # 2阶曲线
f2=sp.poly1d(f2p)

通过matplotlib画出数据的拟合曲线
plt.scatter(x,y)
plt.xlabel(u"时间")
plt.ylabel(u"点击/小时")
plt.xticks( [w * 7 * 24 for w in range(10)], [u'周 %i' % w for w in range(10)])
plt.autoscale(tight=True)
fx=sp.linspace(0,x[-1],1000)
plt.plot(fx,f3(fx),linewidth=4)
plt.legend(["d=%i" %f1.order], loc="upper left")
plt.grid
plt.show()
三、线的简化
实践中,根据不同场景的需要,有下面几种简化算法通常比较有用
- 临近点简化(Radial Distance)
- 垂直距离简化(Perpendicular Distance)
- Douglas-Peucker算法
1 临近点简化
该算法是一个简单的O(n)复杂度的暴力算法。对某个顶点,接下来连续的顶点与该点(key)的距离如果都在给定的误差范围内,那么将移除这些点。过程如下图:
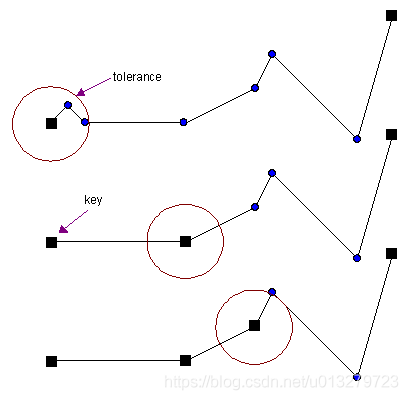
我们通常保留Polyline的起始点和终止点作为结果的一部分。首先将起始点标记为Key,然后沿着Polyline前进,与Key相邻的连续顶点到Key的距离如果小于给定误差就移除,遇到的第一个超过误差的点标记为下一个Key;从这个新的key开始重复上面的过程,知道到达之后一个顶点。
2 垂直距离简化
临近点算法将点-点距离作为误差判据,而垂直距离简化则是将点-线段的距离作为误差判据。对于每个顶点Vi,需要计算它与线段[Vi-1, Vi+1]的垂直距离,距离比给定误差小的点都将被移除。过程如下图所示:
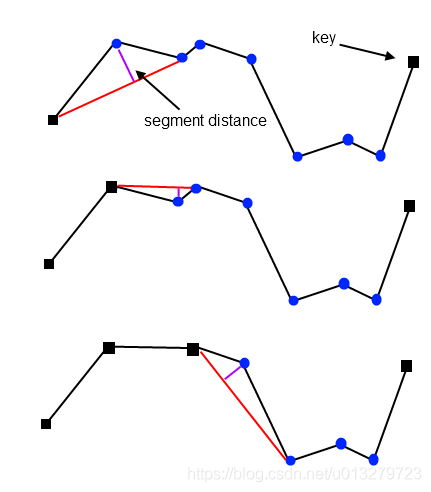
如上图,首先,对前三个顶点进行处理,计算第二个顶点的垂直距离,将这个距离与容差进行比较,大于设定的误差,所以第二个顶点作为Key保留(简化结果的一部分)。然后算法开始处理接下来的三个顶点。这一次,计算的距离低于公差,因此中间顶点被删除。如此重复,直到处理完所有顶点。
Note:对于每个被移除的顶点Vi,下一个可能被移除的候选顶点是Vi+2。这意味着原始多段线的点数最多只能减少50%。为了获得更高的顶点减少率,需要多次遍历。
3 Douglas-Peucker算法
Douglas-Peucker算法使用点-边距离作为误差衡量标准。该算法从连接原始Polyline的第一个和最后一个顶点的边开始,计算所有中间顶点到边的距离,距离该边最远的顶点,如果其距离大于指定的公差,将被标记为Key并添加到简化结果中。这个过程将对当前简化中的每条边进行递归,直到原始Polyline的所有顶点与当前考察的边的距离都在允许误差范围内。该过程如下图所示:

初始时,简化结果只有一条边(起点-终点)。第一步中,将第四个顶点标记为一个Key,并相应地加入到简化结果中;第二步,处理当前结果中的第一条边,到该边的最大顶点距离低于容差,因此不添加任何点;在第三步中,当前简化的第二个边找到了一个Key(点到边的距离大于容差)。这条边在这个Key处被分割,这个新的Key添加到简化结果中。这个过程一直继续下去,直到找不到新的Key为止。注意,在每个步骤中,只处理当前简化结果的一条边。
这个算法的最坏时间复杂度是O(nm), 平均时间复杂度 O(n log m),其中m是简化后的Polyline的点数。因此,该算法是Output-sensitive的。当m很小时,该算法会很快。
DP算法的实现(没亲自实验,先总结再说):
- 样例代码1
#-*- coding:utf-8 -*-
"""
道格拉斯算法的实现
程序需要安装shapely模块
"""
import math
from shapely import wkt,geometry
import matplotlib.pyplot as plt

class Point:
    """点类"""
    x=0.0
    y=0.0
    index=0 #点在线上的索引

    def __init__(self,x,y,index):
        self.x=x
        self.y=y
        self.index=index

class Douglas:
    """道格拉斯算法类"""
    points=[]
    D=1 #容差

    def readPoint(self):
        """生成点要素"""
        g=wkt.loads("LINESTRING(1 4,2 3,4 2,6 6,7 7,8 6,9 5,10 10)")
        coords=g.coords
        for i in range(len(coords)):
            self.points.append(Point(coords[i][0],coords[i][1],i))

    def compress(self,p1,p2):
        """具体的抽稀算法"""
        swichvalue=False
        #一般式直线方程系数 A*x+B*y+C=0,利用点斜式,分母可以省略约区
        #A=(p1.y-p2.y)/math.sqrt(math.pow(p1.y-p2.y,2)+math.pow(p1.x-p2.x,2))
        A=(p1.y-p2.y)
        #B=(p2.x-p1.x)/math.sqrt(math.pow(p1.y-p2.y,2)+math.pow(p1.x-p2.x,2))
        B=(p2.x-p1.x)
        #C=(p1.x*p2.y-p2.x*p1.y)/math.sqrt(math.pow(p1.y-p2.y,2)+math.pow(p1.x-p2.x,2))
        C=(p1.x*p2.y-p2.x*p1.y)

        m=self.points.index(p1)
        n=self.points.index(p2)
        distance=[]
        middle=None

        if(n==m+1):
            return
        #计算中间点到直线的距离
        for i in range(m+1,n):
            d=abs(A*self.points[i].x+B*self.points[i].y+C)/math.sqrt(math.pow(A,2)+math.pow(B,2))
            distance.append(d)

        dmax=max(distance)

        if dmax>self.D:
            swichvalue=True
        else:
            swichvalue=False

        if(not swichvalue):
            for i in range(m+1,n):
                del self.points[i]
        else:
            for i in range(m+1,n):
                if(abs(A*self.points[i].x+B*self.points[i].y+C)/math.sqrt(math.pow(A,2)+math.pow(B,2))==dmax):
                    middle=self.points[i]
            self.compress(p1,middle)
            self.compress(middle,p2)

    def printPoint(self):
        """打印数据点"""
        for p in self.points:
            print "%d,%f,%f"%(p.index,p.x,p.y)

def main():
    """测试"""
    #p=Point(20,20,1)
    #print '%d,%d,%d'%(p.x,p.x,p.index)

    d=Douglas()
    d.readPoint()
    #d.printPoint()
    #结果图形的绘制,抽稀之前绘制
    fig=plt.figure()
    a1=fig.add_subplot(121)
    dx=[]
    dy=[]
    for i in range(len(d.points)):
        dx.append(d.points[i].x)
        dy.append(d.points[i].y)
    a1.plot(dx,dy,color='g',linestyle='-',marker='+')


    d.compress(d.points[0],d.points[len(d.points)-1])

    #抽稀之后绘制
    dx1=[]
    dy1=[]
    a2=fig.add_subplot(122)
    for p in d.points:
        dx1.append(p.x)
        dy1.append(p.y)
    a2.plot(dx1,dy1,color='r',linestyle='-',marker='+')

    #print "========================\n"
    #d.printPoint()

    plt.show()

if __name__=='__main__':

    main()
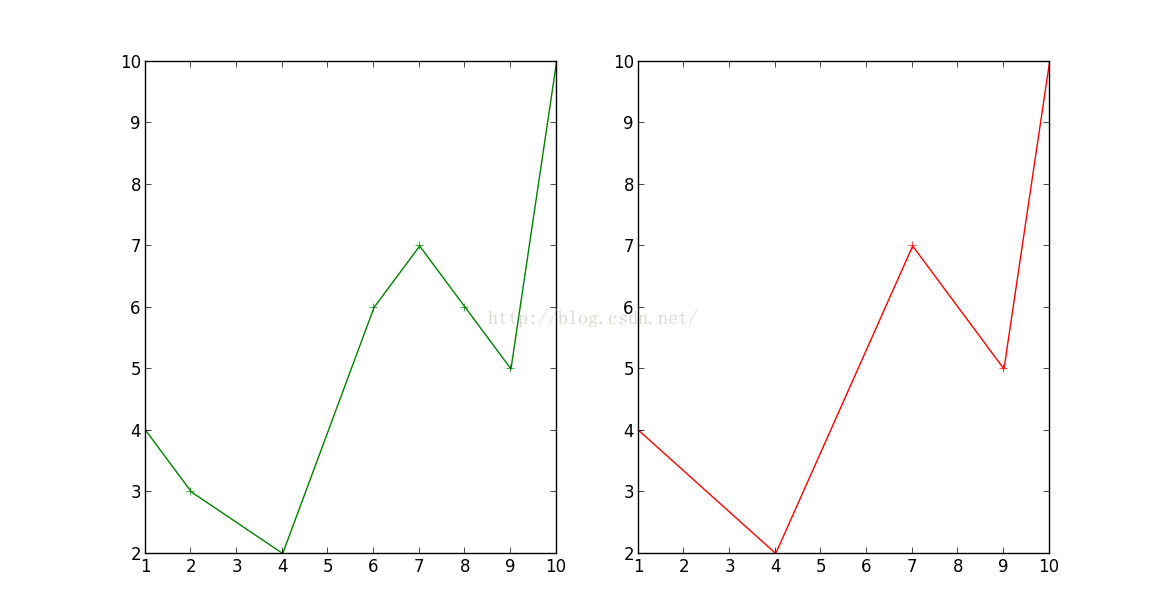
结果:
- 样例代码2
递归方式实现的Douglas–Peucker算法用于GPS轨迹压缩,参考的原文找不到了,把它封装成一个类。
import math

class Point(object):
    def __init__(self, id, x, y):
        self.id = id
        self.x = x
        self.y = y

class DPCompress(object):
    def __init__(self, pointList, tolerance):
        self.Compressed = list()
        self.pointList = pointList
        self.tolerance = tolerance
        self.runDP(pointList, tolerance)

    def calc_height(self, point1, point2, point):
        """
        计算point到[point1, point2所在直线]的距离
        点到直线距离:
        A = point2.y - point1.y;
        B = point1.x - point2.x;
        C = point2.x * point1.y - point1.x * point2.y
        Dist = abs((A * point3.X + B * point3.Y + C) / sqrt(A * A + B * B))
        """

        # tops2 = abs(point1.x * point2.y + point2.x * point.y
        #                 + point.x * point1.y - point2.x * point1.y - point.x *
        #                 point2.y - point1.x * point.y)
        tops = abs(point1.x * point.y + point2.x * point1.y + point.x * point2.y
                - point1.x * point2.y - point2.x * point.y - point.x * point1.y
                )

        bottom = math.sqrt(
            math.pow(point2.y - point1.y, 2) + math.pow(point2.x - point1.x, 2)
        )

        height = 100 * tops / bottom
        return height

    def DouglasPeucker(self, pointList, firsPoint, lastPoint, tolerance):
        """
        计算通过的内容
        DP算法
        :param pointList: 点列表
        :param firsPoint: 第一个点
        :param lastPoint: 最后一个点
        :param tolerance: 容差
        :return:
        """
        maxDistance = 0.0
        indexFarthest = 0
        for i in range(firsPoint, lastPoint):
            distance = self.calc_height(pointList[firsPoint], pointList[lastPoint], pointList[i])
            if (distance > maxDistance):
                maxDistance = distance
                indexFarthest = i
    #    print('max_dis=', maxDistance)

        if maxDistance > tolerance and indexFarthest != 0:
            self.Compressed.append(pointList[indexFarthest])
            self.DouglasPeucker(pointList, firsPoint, indexFarthest, tolerance)
            self.DouglasPeucker(pointList, indexFarthest, lastPoint, tolerance)

    def runDP(self, pointList, tolerance):
        """
        主要运行结果
        :param pointList: Point 列表
        :param tolerance: 值越小,压缩后剩余的越多
        :return:
        """
        if pointList == None or pointList.__len__() < 3:
            return pointList

        firspoint = 0
        lastPoint = len(pointList) - 1

        self.Compressed.append(pointList[firspoint])
        self.Compressed.append(pointList[lastPoint])

        while (pointList[firspoint] == pointList[lastPoint]):
            lastPoint -= 1
        self.DouglasPeucker(pointList, firspoint, lastPoint, tolerance)

    def getCompressed(self):
        self.Compressed.sort(key=lambda point: int(point.id))
        return self.Compressed
该类的使用方法:
import pandas as pd
import numpy as np
import collections

from DPCompress import Point,DPCompress

def load_data(file_path):
    columns=['rid','car_id','lon','lat']
    df = pd.read_csv(file_path, header=None, names=columns)
    df_data = df.loc[df['lon']!=np.nan].reset_index().drop(['index'],axis=1)

    car_to_points = collections.defaultdict(list)
    for i, row in df_data.iterrows():
        row_id = row['rid']
        car_id = row['car_id']
        lon = float(row['lon'])
        lat = float(row['lat'])
        pt = Point(row_id, round(lon, 6), round(lat, 6)) # 构造Point对象
        car_to_points[car_id].append(pt)
    return car_to_points

if __name__ == '__main__':
    data_file='data/trajectory.csv'
    output_file='data/compressed.csv'
    car_points = load_data(data_file)
    # print(car_points.keys())
    with open(output_file, 'w', encoding='utf-8') as fwriter:
        for car, PointList in car_points.items():
            points = []
            dp = DPCompress(PointList, 3.5)
            points = dp.getCompressed()
            for p in points:
                line = "{},{},{}".format(car, p.x, p.y)
                fwriter.write(line)
                fwriter.write("\n")
            print(car, len(PointList), '-->', len(points))
- 样例代码3
Douglas-Peucker 算法是矢量数据压缩经典算法,算法的基本思想如下:
假设组成曲线的顶点集合为 P1、P2、…Pn,假设 P1、Pn为曲线的起始点和终止点,将其虚连成一条直线, 计算曲线内点 Pi(i=2,3,…,n-1)到直线 P1Pn的距离 Di,通过比较距离的大小得到距离最大对应的点 Pk, 判断 Dk的值与预先给定的阈值之间的大小关系。若小于阈值,则舍去曲线上的全部中间顶点;反之,若大于阈值,则保留点 Pk,并以该点为界限,将首尾两点分别与该点虚连成一条直线,形成两条新的直线段 P1Pk 和 PkPn,再重复上述的步骤确定下一批压缩后的保留点。并以此类推,直到两端点之间的曲线上的顶点到两端点虚连成的直线的最大距离小于阈值为止。
递归实现思路:
1、计算出直线的方程。
2、遍历各点到直线的距离,保存最大距离与其点的索引,判断其与阈值的关系
a.若小于阈值:则该直线作为压缩后的数据。
b.若大于阈值,则该点将直线分为两段,AC CB
3、重复2的操作。
递归伪代码:
def rdp(points, epsilon):
    dmax = 0.0
    index = 0
    for i in range(1, len(points) - 1):
        d = point_line_distance(points[i], points[0], points[-1])
        if d > dmax:
            index = i
            dmax = d

    if dmax >= epsilon:
        results = rdp(points[:index+1], epsilon)[:-1] + rdp(points[index:], epsilon)
    else:
        results = [points[0], points[-1]]

    return results
非递归思路:
首先不使用递归,但是要做到将每个点都遍历一遍,选出最大距离的点,要对两端再进行遍历。参考文章作者提供了思路,采用“出栈入栈的操作”来实现非递归算法。
依旧以上面的图作为例子来讲解

Step1:
建立两个空栈,将首尾两个端点分别放入AB两个栈中。
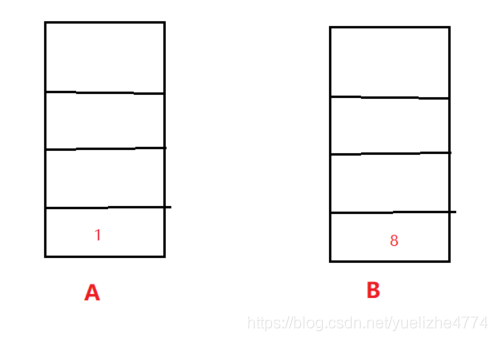
Step2:
从直线中找到最大距离的点dmax(判断其与阈值的关系,若小于阈值,则直线为压缩后的数据),其索引为point3,将其放入栈B中。
此时,直线的端点从18 变为了 13
我们再次执行Step2的操作,所找到的最大距离就是13直线之间的最大距离了。
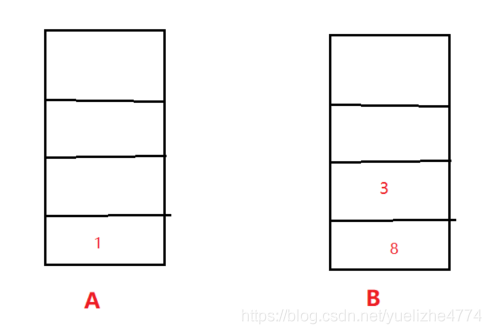
Step3:
若13之间的点的最大距离小于阈值,则B的顶端,出栈,将其放入A栈中。
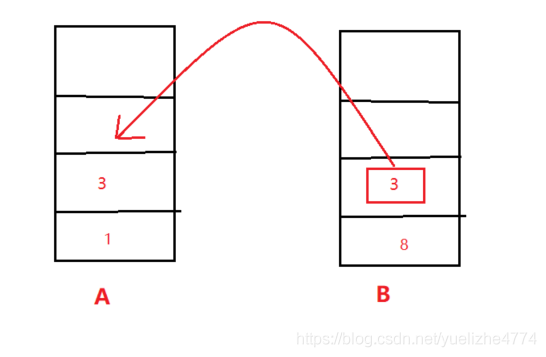
之后在进行Step2的操作,所求的就是直线38之间的点。
直到最后,将B栈中的所有点都压入A中,算法结束。A栈中的点即为最终的点。
python伪代码
def RDP(Points,threshold):
    RDPFinout = []
    if(len(Points)<=1):
        RDPFinout = Points
        return RDPFinout
    # 读的数组的长度
    IndexsFin = len(Points)
    # 创建两个数组记录索引
    A = Stack()
    B = Stack()
    Maxindex = IndexsFin - 1
    # 将首位两个点坐标入栈
    A.push(0)
    B.push(Maxindex)
    #############
    while B栈不为空:
        maxDistanceIndex = findMaxdistanceIndex(Points, A.top(), B.top())
        maxDistance = findMaxdistance(Points, A.top(), B.top())
        if(maxDistance > threshold):
            #大于阈值
            B.push(maxDistanceIndex)
        else:
            #小于阈值
            A.push(B.pop())
    ###############
    while A栈不为空:
        #输出结果,存放到数组中
        RDPFinout.append(Points[A.pop()])
    return RDPFinout
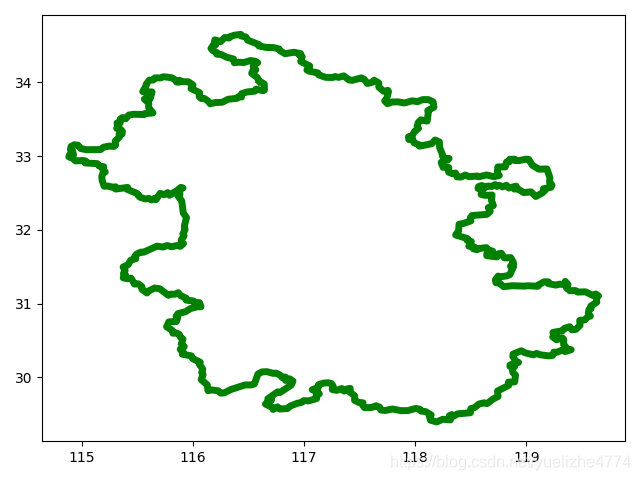
原图:
压缩后:
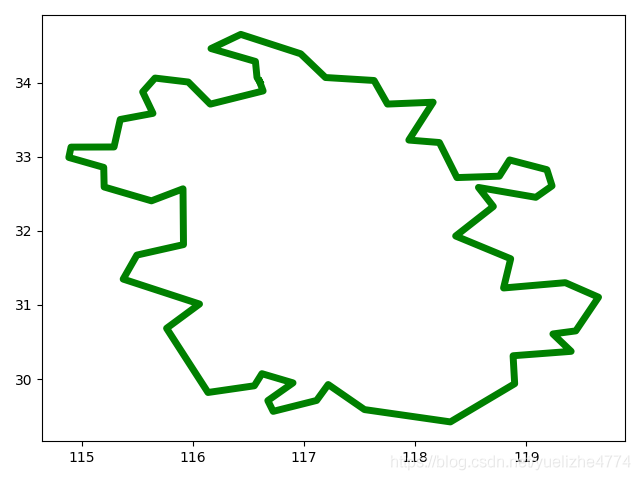
闭合图形如何压缩?
先删除尾点,压缩完成后恢复


【推荐】国内首个AI IDE,深度理解中文开发场景,立即下载体验Trae
【推荐】编程新体验,更懂你的AI,立即体验豆包MarsCode编程助手
【推荐】抖音旗下AI助手豆包,你的智能百科全书,全免费不限次数
【推荐】轻量又高性能的 SSH 工具 IShell:AI 加持,快人一步
· AI与.NET技术实操系列:向量存储与相似性搜索在 .NET 中的实现
· 基于Microsoft.Extensions.AI核心库实现RAG应用
· Linux系列:如何用heaptrack跟踪.NET程序的非托管内存泄露
· 开发者必知的日志记录最佳实践
· SQL Server 2025 AI相关能力初探
· 震惊!C++程序真的从main开始吗?99%的程序员都答错了
· winform 绘制太阳,地球,月球 运作规律
· 【硬核科普】Trae如何「偷看」你的代码?零基础破解AI编程运行原理
· 上周热点回顾(3.3-3.9)
· 超详细:普通电脑也行Windows部署deepseek R1训练数据并当服务器共享给他人