性能分析 - xhprof
简介
XHProf是一个分层PHP性能分析工具。它报告函数级别的请求次数和各种指标,包括阻塞时间,CPU时间和内存使用情况。XHProf分析报告有助于理解被执行的代码的结构,它有一个简单的HTML的用户界面,基于浏览器的性能分析用户界面能更容易查看代码执行顺序,也更方便查看性能比较低的模块。是php的一个拓展。
安装
wget http://pecl.php.net/get/xhprof-0.9.4.tgz
tar -zxvf xhprof-0.9.4.tgz
cd xhprof-0.9.4
cd extension/
phpize
./configure
make
make install
注:访问 http://pecl.php.net 搜索 xhprof 下载安装最新版本,留意版本对应的 php 版本。
启用拓展
vim /etc/php/php.in

引入扩展,并自定义输出目录
[xhprof]
extension = xhprof.so
xhprof.output_dir = /Users/xx/work/php/xhprof/outlog
将 解压后 xhprof 文件夹中的这两个目录复制一份到 /Users/xx/work/php/xhprof 目录下
cp -r xhprof_lib/ /Users/xx/work/php/xhprof/xhprof_lib/
cp -r xhprof_html/ /Users/xx/work/php/xhprof/xhprof_html/
并在/Users/xx/work/php/xhprof根目录下添加文件 inject.php
<?php

//开启xhprof
xhprof_enable(XHPROF_FLAGS_MEMORY | XHPROF_FLAGS_CPU);

//在程序结束后收集数据
register_shutdown_function(function() {
    $xhprof_data   = xhprof_disable();

    //让数据收集程序在后台运行
    if (function_exists('fastcgi_finish_request')) {
        fastcgi_finish_request();
    }

    //保存xhprof数据
    $XHPROF_ROOT = '/Users/xx/work/php/xhprof';
    include_once $XHPROF_ROOT . "/xhprof_lib/utils/xhprof_lib.php";
    include_once $XHPROF_ROOT . "/xhprof_lib/utils/xhprof_runs.php";
    // save raw data for this profiler run using default
    // implementation of iXHProfRuns.
    $xhprof_runs = new XHProfRuns_Default();
    // save the run under a namespace "xhprof_foo"
    $run_id = $xhprof_runs->save_run($xhprof_data, "xhprof_foo");
    echo $run_id;
});
nginx配置,方便后期查看性能报告
server {
       listen 80;
       server_name xhprof-view.com;

       #root  /Users/xx/work/php/xhprof;

        location / {
            root   /Users/xx/work/php/xhprof;
            #try_files $uri $uri/ /index.php?$query_string;
            index  index.php index.html index.htm;
        }

        # pass the PHP scripts to FastCGI server listening on 127.0.0.1:9000
        #
        location ~ \.php$ {
            root           /Users/xx/work/php/xhprof;
            fastcgi_pass   127.0.0.1:9000;
            fastcgi_index  index.php;
            fastcgi_param  SCRIPT_FILENAME  /scripts$fastcgi_script_name;
            fastcgi_param  SCRIPT_FILENAME  $document_root$fastcgi_script_name;
            include        fastcgi_params;
        }
}
被监控站点 nginx 配置。
fastcgi_param PHP_VALUE "auto_prepend_file=/Users/liugx/work/php/xhprof/inject.php";
注:日常开发过程中建议将此配置注释,否则会不断产生性能分析报告,需要时再打开。
重启 nginx 和 php-fpm。访问被监控站点,然后 http://xhprof-view.com/xhprof_html/ 即可看到性能分析结果。
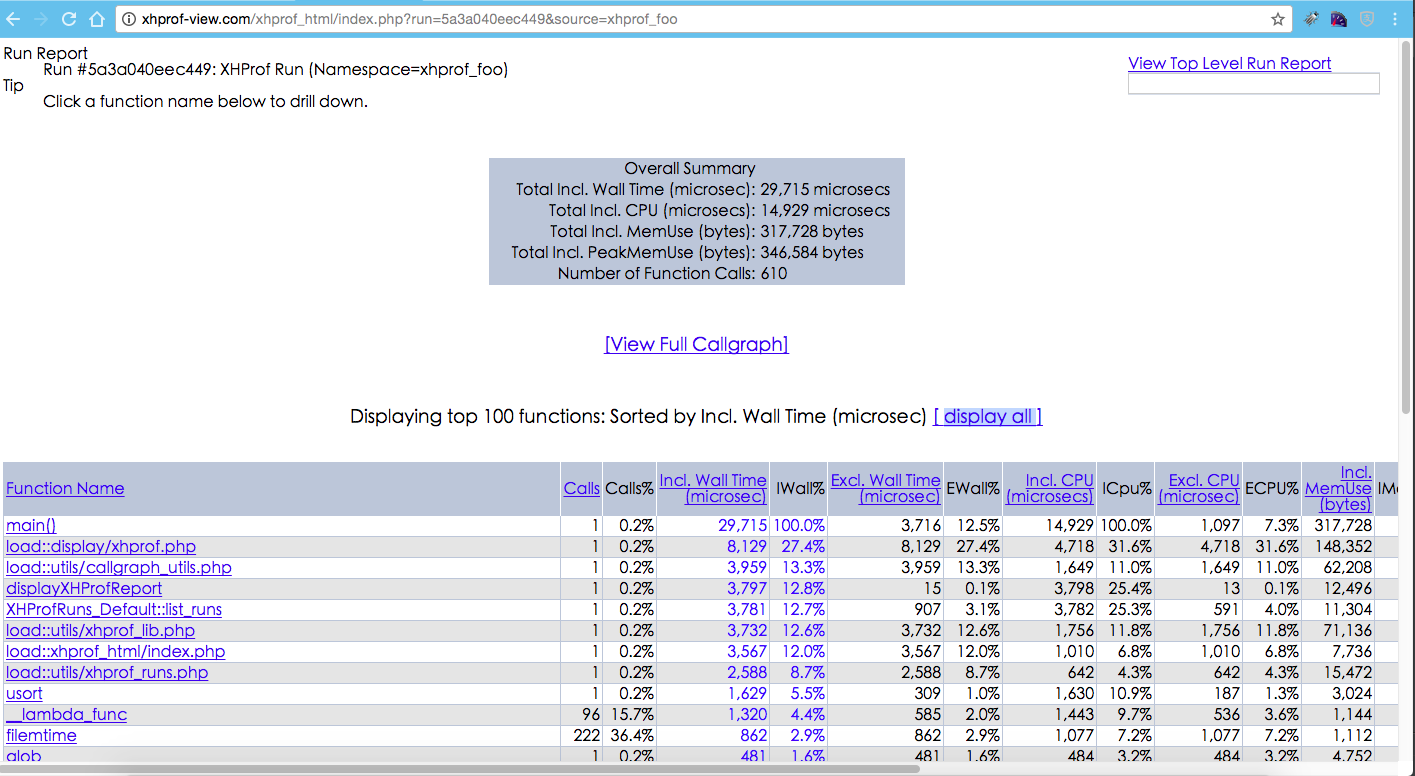
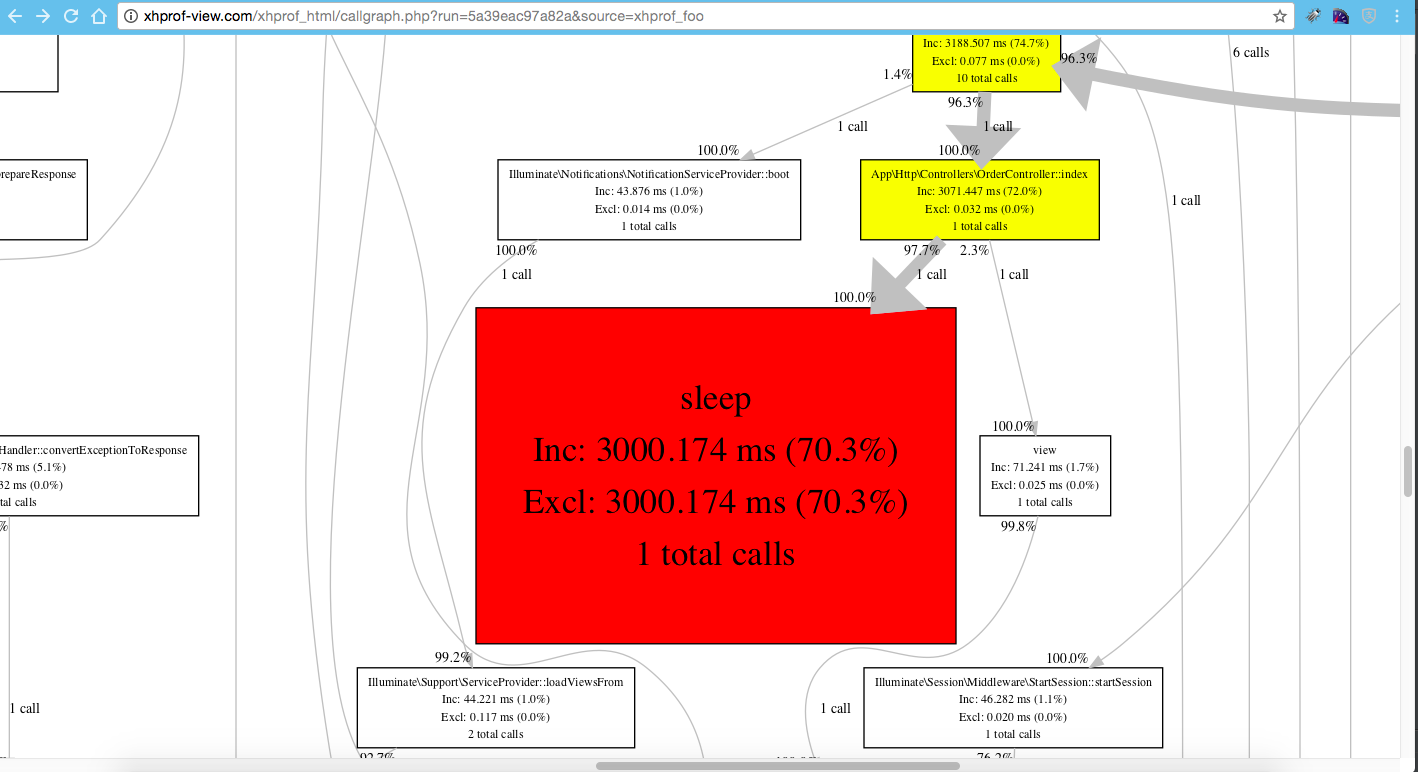
点击 [View Full Callgraph] 可以查看详细调用过程,以及执行过程中需要优化的地方,重点留意粗箭头方向和红、黄颜色的模块。
番外篇
点击 [View Full Callgraph] 会出现 mac sh: dot: command not found 提示,别慌,这是没有安装 graphviz。直接 brew 安装还不太行,需要借助 port 来安装。
安装 macPorts
http://distfiles.macports.org/MacPorts/MacPorts-2.4.0-10.10-Yosemite.pkg
安装完成后执行命令
sudo port -v selfupdate
sudo port install graphviz
查看是否安装成功
dot -V
出现版本信息即安装成功,
这时,如果点击[View Full Callgraph]如果还是出现,mac sh: dot: command not found 这样的信息,直接改/Users/xx/work/php/xhprof/xhprof_lib/utils/callgraph_utils.php
中的 $cmd = " dot -T".$type; 改成 $cmd = " /opt/local/bin/dot -T".$type; 即可。
参考链接:https://greenlightt.github.io/2017/11/15/php-xhprof/

 浙公网安备 33010602011771号