vue2使用echarts内置地图实现点击事件
vue2中echarts的安装和显示中国地图:https://www.cnblogs.com/sunshine233/p/16140522.html
echarts.getMap():https://echarts.apache.org/zh/api.html#echarts.getMap
demo地址:https://gitee.com/twoflowers/echarts_geo_demo.git
代码如下:
<template>
  <div id="app">
    <div id="echart_map" ref="echart_map"></div>
  </div>
</template>

<script>
export default {
  data() {
    return {
      myChart: null,
    };
  },
  mounted() {
    this.showScatterInGeo(this.cityCode);
    this.clickGoNext();
  },
  methods: {
    /*
      geo:地理坐标系组件( https://echarts.apache.org/zh/option.html#geo)
      地理坐标系组件用于地图的绘制,支持在地理坐标系上绘制散点图
    */
    showScatterInGeo() {
      this.myChart = this.$echarts.init(this.$refs.echart_map);
      var chinamap = require("echarts/map/json/china.json"); //使用 require 引入地图组件,而不是在开头的 import
      this.$echarts.registerMap("china", chinamap);
      this.option = {
        geo: {
          type: "map",
          map: "china",
          label: {
            normal: {
              color: "#000000",
              show: true, //省份名称
            },
          },
        },
        series: [
          {
            name: "在地图中显示散点图",
            type: "scatter",
            coordinateSystem: "geo", //设置坐标系为 geo
            data: [
              //这里放标注点的坐标[{name: "北京",value: [116.46, 39.92]}]
              { name: "北京", value: [116.41995, 40.18994] },
              { name: "郑州", value: [113.665412, 34.757975] },
              { name: "天津", value: [117.205126, 39.034933] },
              { name: "昆明", value: [102.81844, 24.906231] },
              { name: "广州", value: [113.26453, 23.155008] },
            ],
            label: {
              formatter: "{b}",
              position: "right",
              show: false,
            },
            emphasis: {
              label: {
                show: true,
              },
            },
          },
        ],
      };
      // 4. myChart.setOption
      this.myChart.setOption(this.option);
    },
    /*
      鼠标事件: https://echarts.apache.org/zh/api.html#echartsInstance.on
      echarts.getMap() :https://echarts.apache.org/zh/api.html#echarts.getMap
        1.  只有用echarts的地图,才能使用  echarts.getMap("china").geoJson.features
    */
    clickGoNext() {
      var that = this;
      var dataList = that.$echarts.getMap("china").geoJson.features;
      // console.log("dataList:", dataList);

      // 鼠标事件
      this.myChart.on("click", function (res) {
        console.log("click city:", res.name);
        dataList.forEach((element) => {
          if (element.properties.name == res.name) {
            console.log("city code:", element.id);
          }
        });
      });
    },
  },
};
</script>

<style scoped>
#echart_map {
  width: 100%;
  height: 500px;
  background-color: #f1f3f4;
}
</style>
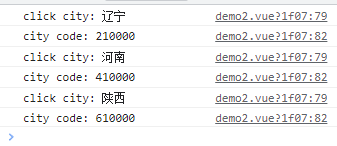
效果如下: