

promethues二进制免编译安装部署
1、promethues二进制免编译安装部署
[root@k8s-master prome]# mkdir -p /app/prome &&cd /app/prome
[root@k8s-master prome]# wget https://github.com/prometheus/prometheus/releases/download/v2.21.0/prometheus-2.21.0.linux-amd64.tar.gz
[root@k8s-master prome]# tar -xf prometheus-2.21.0.linux-amd64.tar.gz && mv prometheus-2.21.0.linux-amd64 prometheus
[root@k8s-master prome]# cp prometheus/{prometheus,promtool} /usr/local/bin/
[root@k8s-master prome]# which promtool
/usr/local/bin/promtool
[root@k8s-master prome]# cd prometheus && mkdir etc
[root@k8s-master prometheus]# cp prometheus.yml etc/
[root@k8s-master prometheus]# promtool check config etc/prometheus.yml # 检查配置
Checking etc/prometheus.yml
SUCCESS: 0 rule files found
[root@k8s-master prometheus]# /usr/local/bin/prometheus --config.file /app/prome/prometheus/etc/prometheus.yml # 绝对路径启动
配置热启动方式
如果要远程热加载配置文件,启动时加上--web.enable-lifecycle参数,调用指令是curl -X POST http://localhost:9090/-/reload
热启动方式:prometheus --config.file etc/prometheus.yml --web.enable-lifecycle
2、监控节点配置
[root@k8s-node1 ~]# mkdir -p /app && cd /app/
[root@k8s-node1 app]# wget https://github.com/prometheus/node_exporter/releases/download/v0.18.1/node_exporter-0.18.1.linux-amd64.tar.gz
[root@k8s-node1 app]# tar -xf node_exporter-0.18.1.linux-amd64.tar.gz
[root@k8s-node1 app]# mv node_exporter-0.18.1.linux-amd64 node_exporter && cd node_exporter
[root@k8s-node1 node_exporter]# ./node_exporter --version
[root@k8s-node1 node_exporter]# nohup ./node_exporter &
[root@k8s-node1 node_exporter]# curl 192.168.1.202:9100/metrics
3、grafana部署
二进制免编译或者rpm安装,这里用rpm按照方式执行。
[root@k8s-master prome]# wget https://dl.grafana.com/oss/release/grafana-6.6.2-1.x86_64.rpm
[root@k8s-master prome]# yum localinstall grafana-6.6.2-1.x86_64.rpm
[root@k8s-master prome]# systemctl start grafana-server
[root@k8s-master prome]# systemctl status grafana-server
[root@k8s-master prome]# netstat -lnpt |grep gra
Proto Recv-Q Send-Q Local Address Foreign Address State PID/Program name
tcp6 0 0 :::3000 :::* LISTEN 116244/grafana-serv
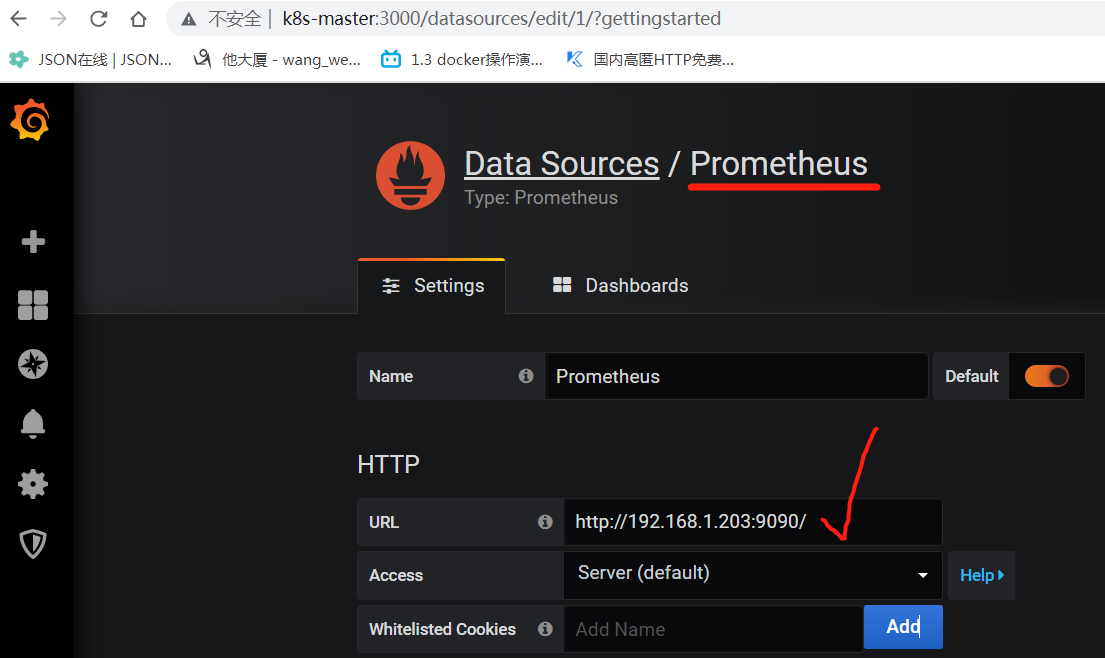
浏览器访问http://192.168.1.203:3000/,默认账号密码为admin admin,首次登录后密码我改为admin123
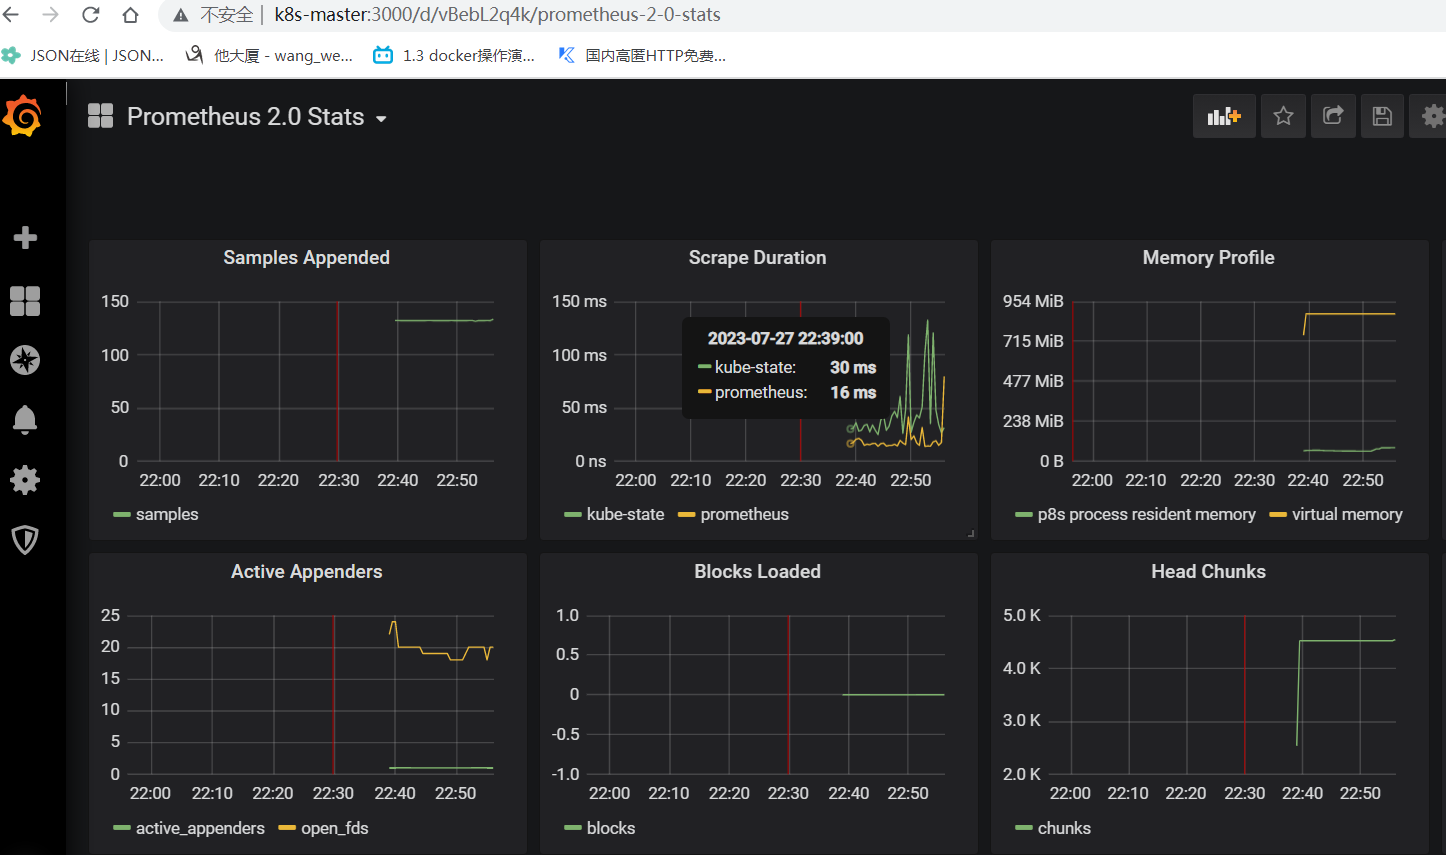
配置数据源, 导入模板后,如下数据展示。
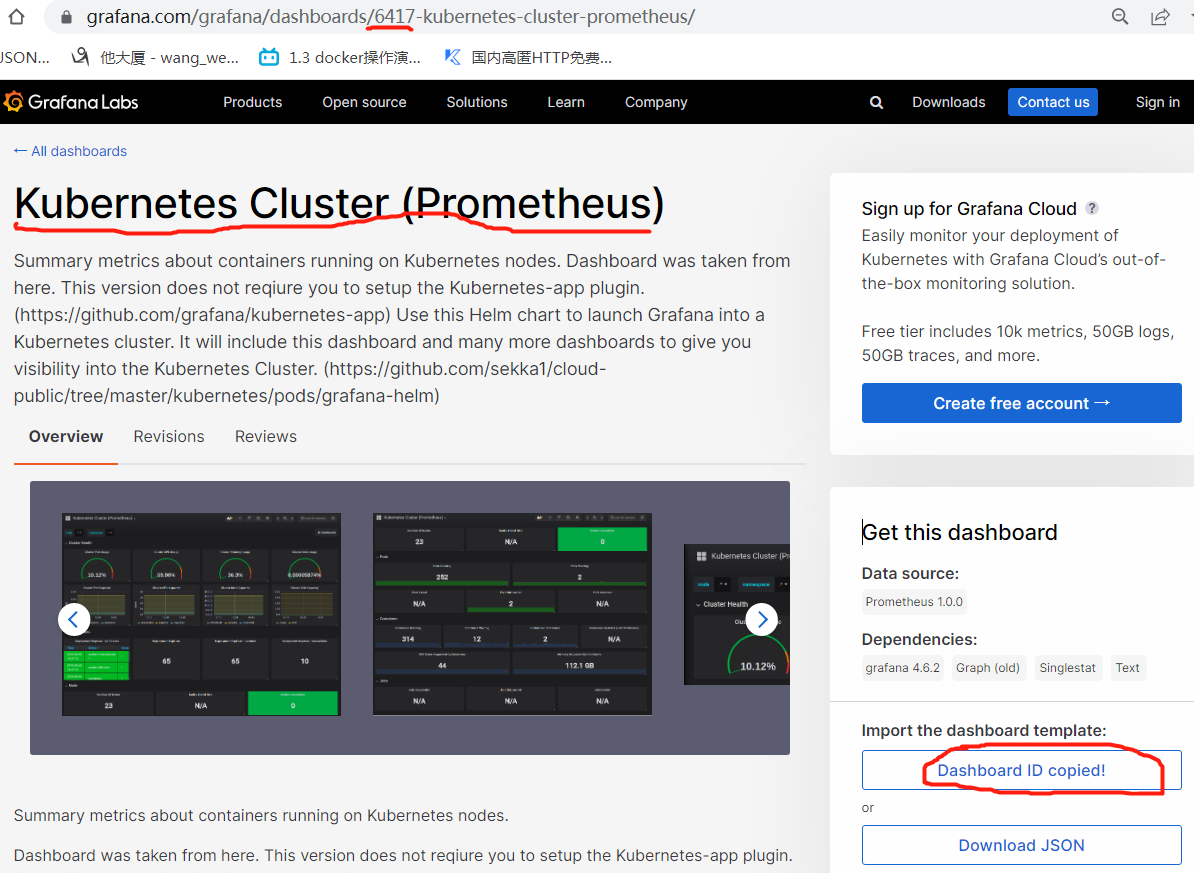
grafana官方给出了部分展示模板:https://grafana.com/grafana/dashboards/?dataSource=prometheus&search=node
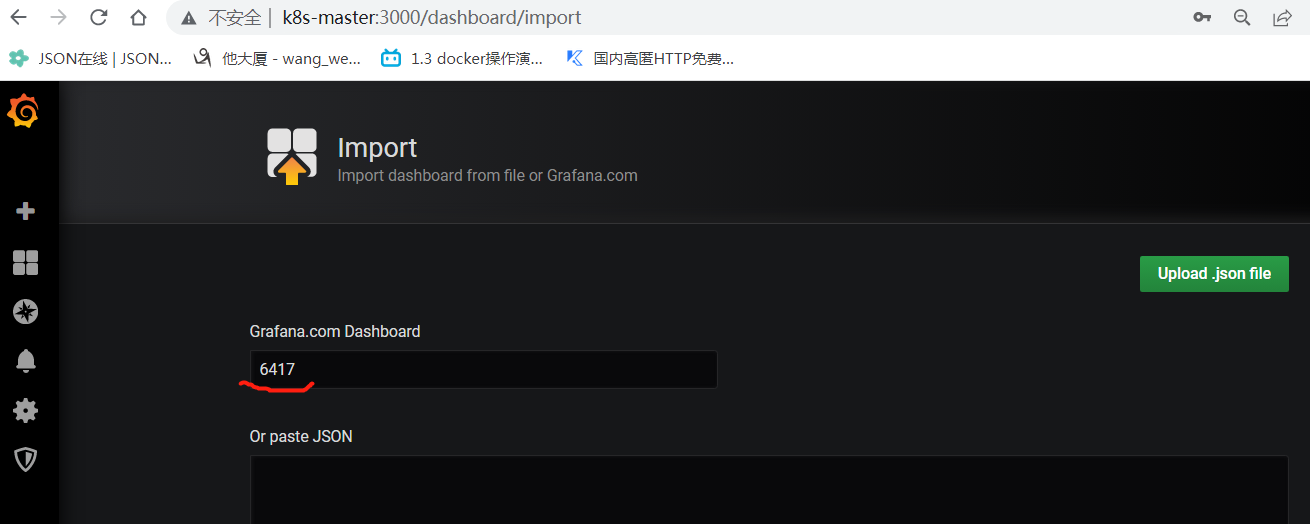
现在看中了id 6417这个模板,可以直接复制id导致模板,如下,也可以下载json文件导入。
4、安装alertmanaer
wget -e "http_proxy=proxy-public.intsit.sfdc.com.cn:443" https://github.com/prometheus/alertmanager/releases/download/v0.21.0/alertmanager-0.21.0.linux-amd64.tar.gz
[mwopr@cnsz22VLK10176:/app/prometheus]$tar -xf alertmanager-0.21.0.linux-amd64.tar.gz
[mwopr@cnsz22VLK10176:/app/prometheus]$mv alertmanager-0.21.0.linux-amd64 alertmanager
[mwopr@cnsz22VLK10176:/app/prometheus]#cp alertmanager/{alertmanager,amtool} /usr/local/bin/
[mwopr@cnsz22VLK10176:/app/prometheus]$alertmanager --version
[mwopr@cnsz22VLK10176:/app/prometheus/alertmanager]$mkdir etc
[mwopr@cnsz22VLK10176:/app/prometheus/alertmanager]$cp alertmanager.yml etc/
[mwopr@cnsz22VLK10176:/app/prometheus/alertmanager]$cat etc/alertmanager.yml
[mwopr@cnsz22VLK10176:/app/prometheus/alertmanager]$alertmanager --config.file etc/alertmanager.yml
高可用部署HA+local存储。
nginx+指定存储。
运行参数设置:https://www.cnblogs.com/mengxp/p/13930515.html
/app/prometheus/prometheus/prometheus --config.file /app/prometheus/prometheus/etc/prometheus.yml --web.listen-address="127.0.0.1:9090" --web.external-url=http://localhost:9090/webUI/prometheus/ --storage.tsdb.path="/app/data/"
编译安装ng
生产操作系统(100.80.100.46):CentOS Linux release 7.2.1511 (Core)
[root@1a01vlb9203zzzz app]# mkdir files
[root@1a01vlb9203zzzz app]# cd files/
[root@1a01vlb9203zzzz files]# tar -xf nginx-1.18.0.tar.gz
[root@1a01vlb9203zzzz files]# cd nginx-1.18.0
[root@1a01vlb9203zzzz nginx-1.18.0]#yum -y install gcc gcc-c++ pcre pcre-devel zlib zlib-devel openssl openssl-devel 基础组件
[root@1a01vlb9203zzzz nginx-1.18.0]# ./configure --prefix=/app/prometheus/nginx --with-http_realip_module --with-http_sub_module --with-http_gzip_static_module --with-http_stub_status_module --with-pcre --with-http_ssl_module
[root@1a01vlb9203zzzz nginx-1.18.0]# make &&make install
nginx配置web认证方式(https://www.cnblogs.com/xiaobaiskill/p/9803867.html)
[root@CNSZ17VLK5412 ~]# yum -y install httpd-tools
[appdeploy@CNSZ17VLK5412 ~]$ htpasswd -b /app/prometheus/nginx/.password admin Bgp@server
htpasswd: cannot modify file /app/prometheus/nginx/.password; use '-c' to create it
[appdeploy@CNSZ17VLK5412 ~]$ htpasswd -bc /app/prometheus/nginx/.password admin Bgp@server 创建用户和文件
Adding password for user admin
[appdeploy@CNSZ17VLK5412 ~]$ cat /app/prometheus/nginx/.password
admin:$apr1$OeFcEdfX$NBwD4Nrb2njacJMmbGwGe1
[appdeploy@CNSZ17VLK5412 ~]$
修改nginx配置信息:
server {
listen 9090;
server_name localhost;
.......
#新增下面两行
auth_basic "Please input password"; #这里是验证时的提示信息
auth_basic_user_file /usr/local/nginx/passwd;
location /{
.......
}
重启nginx: /app/prometheus/nginx/sbin/nginx -s reload
======
promethues启动
[appdeploy@1a01vlb9201zzzz prometheus]$ prometheus --config.file etc/prometheus.yml --web.enable-lifecycle --storage.tsdb.path="/app/data/"
配置启动加载日志:
启动prom:nohup /app/prometheus/prometheus/prometheus --config.file /app/prometheus/prometheus/etc/prometheus.yml --web.enable-lifecycle --storage.tsdb.path="/app/prometheus/prometheus/data" --storage.tsdb.retention="15d" >/app/prometheus/prometheus/prometheus.log &
启动alert:nohup alertmanager --config.file /app/prometheus/alertmanager/etc/alertmanager.yml >/app/prometheus/alertmanager/alertmanager.log &
启动exporter:nohup /app/prometheus/node_exporter/node_exporter >/app/prometheus/node_exporter/node_exporter.log &
传递包文件:
[appdeploy@1a01vlb9201zzzz ~]$ ssh-keygen
[appdeploy@1a01vlb9201zzzz ~]$ ssh-copy-id -i .ssh/id_rsa.pub appdeploy@100.80.100.45
遗留问题:
1、bgp分类告警
2、告警静默操作
客户端telegraf安装部署
采用server端采集方式之后,运维将节省大量的维护工作,统一升级。
如果是场景更加丰富的话,Telegraf对接配置中心。相比更改诸多Exporter代码,简单很多。
Telegraf pipeline的架构,可以在processor这个环节,提前实现一下metrics的预聚合,可以很大程度上降低Prometheus的处理数据压力。
bgp验证:
sum by(vip) (nginx_metric_accepts{job="bgp_ser"}) 按照vip分类求和
sum by(instance,vip) (nginx_metric_accepts{job="bgp_ser"}) 多个参数筛选
我们从计算每个CPU模式的每秒速率开始。PromQLPromQL有一个名为irate的函数,用于计算距离向量中时间序列每秒瞬时增长率。让我们在 node_cpu_seconds_total度量上使用 irate 函数。在查询框中输入函数。在查询框中输入 :
irate(node_cpu_seconds_total{job="node"}[5m])
avg(irate(node_cpu_seconds_total{job="node"}[5m]))by(instance)
[root@prometheus yd]# cat /data/prometheus/up.sh
/data/prometheus/prometheus --web.listenaddress="0.0.0.0:9090" --web.read-timeout=5m --web.maxconnections=10 --storage.tsdb.retention=15d --storage.tsdb.path="data/" --query.max-concurrency=20 --query.timeout=2m
参数说明:
--web.read-timeout=5m 请求链接的最大等待时间,防止太多的空闲链接占用资源
--web.max-connections=512 最大链接数
--storage.tsdb.retention=15d prometheus开始采集监控数据后会存在内存中和硬盘中。对于保留期限的设置 很重要,太长的话 硬盘和内存都吃不消,太短的话 要查历史数据就没有了。企业中设置 15天为宜。
--storage.tsdb.path="data/" 存储数据路径
--query.timeout=2m
--query.max-concurrency=20
上面这两项是对用户执行prometheus查询时候的优化设置,防止太多的用户同时查询,也防止单个用户执行过大的的查询而一直不退出。
pushgateway这种自定义的采集方式,非常的快速,而且极其灵活几乎不收到任何约束。
其实我个人还是非常希望 使用pushgateway来获取监控数据,各类的exporters虽然玲琅满目,但一般情况下 我在企业中 只安装 node_exporter 和 DB_exporter两个,其他种类的 监控数据 我倾向于 全部使⽤pushgateway的方式采集 (要的就是快速~ 灵活~)
======================================================================
告警规则参考:https://awesome-prometheus-alerts.grep.to/rules
promethues全局配置:https://zhuanlan.zhihu.com/p/210352317
监控采集:https://docs.confluent.io/platform/current/kafka/monitoring.html
telegraf组件ha:https://github.com/influxdata/telegraf/tree/master/plugins/inputs/haproxy
利用Prometheus 打造企业分布式监控平台(6)--用Telegraf解放Exporter运维
https://zhuanlan.zhihu.com/p/135410203
Telegraf是插件驱动的,目前支持的采集数据源如下:
CPU、disk(分区)、diskio(磁盘硬件)、mem、snmp
haproxy、
nginx、
redis、
zookeeper、
kafka_consumer、
telegraf安装
下载地址:https://portal.influxdata.com/downloads/
wget https://dl.influxdata.com/telegraf/releases/telegraf-1.17.2-1.x86_64.rpm
sudo yum localinstall telegraf-1.17.2-1.x86_64.rpm
rpm -ivh --prefix=/app/weiwei/ telegraf-1.17.2-1.x86_64.rpm 默认路径有报错
yum install telegraf -y yum安装telegraf组件
yum install telegraf-1.17.2-1.x86_64.rpm -y
[appdeploy@cnsz22VLK10275:/etc/telegraf]#/etc/init.d/telegraf start
Starting the process telegraf [ OK ]
telegraf process was started [ OK ]
[appdeploy@cnsz22VLK10275:/etc/telegraf]#netstat -lpnt |grep 9273
tcp 0 0 0.0.0.0:9273 0.0.0.0:* LISTEN 100447/telegraf
[mwopr@CNSZ22PL256 kafka_exporter-1.2.0.linux-amd64]$ cd /app/kafka_exporter-1.2.0.linux-amd64
[mwopr@CNSZ22PL256 kafka_exporter-1.2.0.linux-amd64]$ ./kafka_exporter --kafka.server=10.203.248.71:9092 启动报错信息
ERRO[0000] Error Init Kafka Client source="kafka_exporter.go:210"
panic: kafka: client has run out of available brokers to talk to (Is your cluster reachable?)
prometheus监控kafka常见的有两种开源方案,
一种是传统的部署exporter的方式,
一种是通过jmx配置监控,本文将采用第二种方式进行配置。
=======================================
promethues监控需求。
===监控面板====
网易云面板:云原生时代的指标监控利器-Prometheus
=======监控kafka======
Prometheus 监控之 kafka:https://www.pianshen.com/article/5022132577/
exporter监控配置(10.203.13.73:9092 )
[appdeploy@cnsz22VLK10175:/home/appdeploy/kafka_exporter-1.2.0.linux-amd64]$./kafka_exporter --kafka.server=10.203.13.73:9092
INFO[0000] Starting kafka_exporter (version=1.2.0, branch=HEAD, revision=830660212e6c109e69dcb1cb58f5159fe3b38903) source="kafka_exporter.go:474"
INFO[0000] Build context (go=go1.10.3, user=root@981cde178ac4, date=20180707-14:34:48) source="kafka_exporter.go:475"
INFO[0001] Done Init Clients source="kafka_exporter.go:213"
INFO[0001] Listening on :9308 source="kafka_exporter.go:499"
状态
可用性
系统属性
uptime
系统文件打开数
系统最大文件打开数
系统线程数
磁盘使用率
使用率
空闲空间
磁盘空间复合告警
磁盘总量
磁盘总使用量
磁盘总使用率
网卡状态
主库数量
接收速率
发送速率
网卡带宽
接收带宽使用率
发送带宽使用率
CPU状态
user used
sys used
iowait
CPU used
内存状态
used
free
buffers
cached
total
available
active
mem使用率
inactive
swapused
Available_mem_used
磁盘IO
读取速率
写入速率
reads
writes
总读取速率
总写入速率
11


【推荐】国内首个AI IDE,深度理解中文开发场景,立即下载体验Trae
【推荐】编程新体验,更懂你的AI,立即体验豆包MarsCode编程助手
【推荐】抖音旗下AI助手豆包,你的智能百科全书,全免费不限次数
【推荐】轻量又高性能的 SSH 工具 IShell:AI 加持,快人一步
· AI与.NET技术实操系列:基于图像分类模型对图像进行分类
· go语言实现终端里的倒计时
· 如何编写易于单元测试的代码
· 10年+ .NET Coder 心语,封装的思维:从隐藏、稳定开始理解其本质意义
· .NET Core 中如何实现缓存的预热?
· 25岁的心里话
· 闲置电脑爆改个人服务器(超详细) #公网映射 #Vmware虚拟网络编辑器
· 零经验选手,Compose 一天开发一款小游戏!
· 通过 API 将Deepseek响应流式内容输出到前端
· AI Agent开发,如何调用三方的API Function,是通过提示词来发起调用的吗